online | memorias.ioc.fiocruz.br
Evaluation of a linear spectral mixture model and vegetation
indices (NDVI and EVI) in a study of schistosomiasis mansoni and
Biomphalaria glabrata
distribution in the state of Minas Gerais, Brazil
Ricardo JPS Guimarães1,2, Corina C Freitas3, Luciano V Dutra3, Ronaldo GC Scholte1,2,
Ronaldo S Amaral4, Sandra C Drummond5, Yosio E Shimabukuro3, Guilherme C Oliveira1,2,
Omar S Carvalho1/+
1Instituto de Pesquisas René Rachou-Fiocruz, Av. Augusto de Lima 1715, 39190-002 Belo Horizonte, MG, Brasil
2Programa de Pós-Graduação em Clínica Médica e Biomedicina, Santa Casa de Misericórdia de Belo Horizonte, Belo Horizonte, MG, Brasil 3Instituto Nacional de Pesquisas Espaciais, São José dos Campos, SP, Brasil 4Secretaria de Vigilância em Saúde, Ministério da Saúde,
Brasília, DF, Brasil 5Secretaria de Estado de Saúde de Minas Gerais, Belo Horizonte, MG, Brasil
This paper analyses the associations between Normalized Difference Vegetation Index (NDVI) and Enhanced Vegetation Index (EVI) on the prevalence of schistosomiasis and the presence of Biomphalaria glabrata in the state of Minas Gerais (MG), Brazil. Additionally, vegetation, soil and shade fraction images were created using a Linear Spectral Mixture Model (LSMM) from the blue, red and infrared channels of the Moderate Resolution Imaging Spec-troradiometer spaceborne sensor and the relationship between these images and the prevalence of schistosomiasis and the presence of B. glabrata was analysed. First, we found a high correlation between the vegetation fraction image and EVI and second, a high correlation between soil fraction image and NDVI. The results also indicate that there was a positive correlation between prevalence and the vegetation fraction image (July 2002), a negative corre-lation between prevalence and the soil fraction image (July 2002) and a positive correcorre-lation between B. glabrata and the shade fraction image (July 2002). This paper demonstrates that the LSMM variables can be used as a substitute for the standard vegetation indices (EVI and NDVI) to determine and delimit risk areas for B. glabrata and schisto-somiasis in MG, which can be used to improve the allocation of resources for disease control.
Key words: schistosomiasis - geographical information system - linear spectral mixture model -
Biomphalaria glabrata - epidemiology
Schistosomiasis mansoni is an endemic disease present in approximately 54 American and African coun-tries (WHO 1985, Chitsuloet al. 2000). The etiological agent is the trematode Schistosoma mansoni (Sambon), which causes a variety of symptoms ranging from acute to chronic forms with predominantly intestinal manifes-tations. Severe forms of the disease may occur, such as splenomegaly, impairment of the central nervous system, fibro-obstruction in the liver and portal hypertension. Schistosomiasis treatment is simple due to readily avail-able drugs that can be administered in a single oral dose (Katzet al. 1989). The disease has been primarily spread-ing from the outskirts of cities to urban centres and other regions of the country (Graeff-Teixeiraet al. 1999). Schis- Schis-tosomiasis is primarily caused by a lack of basic sanita-tion in the peripheries of large urban centres where in natura sewage is directly released into drainage.
Financial support: CNPq (302966/2009-9, 490336/2007-8,
380203/2004-9, 308253/2008-6), FAPEMIG (EDP 1775/03, EDT 61775/03, CRA 0070/04), NIH-Fogarty (5D43TW007012)
+Corresponding author: [email protected] Received 5 February 2009
Accepted 10 February 2010
The intermediate hosts are molluscs of the Biompha-laria genus. Among the three intermediate hosts species of S. mansoni present in Brazil (Biomphalaria glabrata,
Biomphalaria tenagophila and Biomphalaria straminea),
B. glabrata is of the greatest significance due to its exten-sive geographic distribution, higher infection rates and higher effectiveness in the transmission of schistosomia-sis. Indeed, the occurrence of B. glabrata has always been associated with the disease in endemic areas.
The extensive distribution of these intermediate hosts in Minas Gerais (MG), Brazil, results in the wide-ranging distribution of schistosomiasis, which is now commonly found in non-endemic areas (Katz & Carvalho 1983, Carvalhoet al. 1988, 1989). The disease is known to be endemic in the regions north (zone of Médio São Fran-cisco and Itacambira), oriental and central (zone of Alto Jequitinhonha, Oeste, Alto São Francisco and Metalúr-gica). The highest infection rates are found in the north-eastern and north-eastern parts of MG, including Mucuri, Rio Doce and Zona da Mata (Pellon & Teixeira 1950, Katzet al. 1978, Carvalhoet al. 1987, Lambertucciet al. 1987). In the endemic areas, high host concentrations cause a high prevalence of schistosomiasis, where high host con-centrations are associated with other risk factors.
analysis. Increasingly, research into the link between the disease, environmental conditions, geographical informa-tion systems and remote sensing data is being conducted and this paper may play an important role in schistosomia-sis studies (Becket al. 1997, 2000, Baviaet al. 2001).
Recently, Moderate Resolution Imaging Spectro-radiometer (MODIS) satellites with sensors of high temporal resolution and moderated space resolution became operational.
Two vegetation indices (VI) based on MODIS data provide robust spectral measures of the amount of vegetation covering the land. The two indices provide spatial and temporal comparisons of global vegetation conditions that can be used to monitor changes in the Earth’s terrestrial photosynthetic vegetation activity and to detect changes in phenology. Additionally, they allow a biophysical derivation of radiometric and structural vegetation parameters (Hueteet al. 1999).
A drawback of the MODIS sensor data is the rela-tively low spatial resolution. The Linear Spectral Mix-ture Model (LSMM) can be used (Cross et al. 1991) to overcome this restriction. This model estimates propor-tions of determined objects of interest inside a pixel. The “pure” terrestrial coverage for the set of classes of inter-est is identified and their spectra are used to define the “endmember signatures”. All other pixels are assigned proportions of these endmembers (Cross et al. 1991, Quarmby et al. 1992). Each pixel spectral response is considered a linear mixture of the pure pixel (endmem-ber) spectral signatures.
Efforts to predict the prevalence of schistosomia-sis using Geographic Information System (GIS) were first attempted in the Philippines and the Caribbean by Crosset al.(1984). In Brazil, the first studies were per-formed in the state of Bahia and attempted to correlate the disease distribution with Normalized Difference Vegetation Index (NDVI), diurnal temperature differ-ence and the length of the annual dry period (Baviaet al. 2001). Other studies in Brazil using GIS were con-ducted in Pernambuco (Barbosa et al. 2004) and MG (Carvalhoet al. 2005, Freitaset al. 2006, Guimarãeset al. 2006, 2008, 2009, Martins 2008).
The aim of this paper is to use images created us-ing LSMM from MODIS radiometric data to analyse the correlation with schistosomiasis prevalence and B. glabrata presence in MG and compare these results to analyses using NDVI and Enhanced Vegetation Index (EVI) channels.
MATERIALS AND METHODS
MODIS - The MODIS instrument is operating on both the Terra and Aqua spacecraft. It has a viewing swath width of 2,330 km and views the entire surface of the Earth every 1-2 days. Its detectors measure 36 spec-tral bands between 0.405-14.385 µm and it acquires data at three spatial resolutions - 250 m, 500 m and 1,000 m. Data products derived from MODIS observations de-scribe features of the land, oceans and the atmosphere that can be used for studies of processes and trends on local to global scales (Justiceet al. 1998).
The MODIS MOD13 product, which was used in this study, comprises the blue, red, near infrared (NIR) and the middle infrared bands (the radiometric set of chan-nels), as well as the VIs. The VI products contain two indices, the NDVI and a new EVI, which has improved sensitivity to differences in vegetation from sparse to dense vegetation conditions (Justice et al. 1998). The MOD13 product is delivered as a set of image composi-tions produced globally with 1 km, 500 m and 250 m resolution in a 16-day period (Hueteet al. 1999).
The NDVI reduces noise and some uncertainty as-sociated with instrument characteristics and cloud shade effects, but the disadvantages include nonlinearity and scaling problems, signal saturation at high leaf biomass and sensitivity to exposed soil backgrounds (Running et al. 1994, Justiceet al. 1998). The NDVI can be calculated using the formula:
NDVI =
ρ
NIR– ρ
Rρ
NIR+ρ
Rwhere ρNIR = reflectance from NIR and ρR= reflectance
from red.
The EVI offers improved sensitivity in high biomass regions and improved vegetation monitoring (Justiceet al. 1998, Weier & Herring 2004). The EVI is defined:
EVI = G* ρ ρNIR – ρR
NIR + C1 * ρR – C2 * ρB + L
where ρNIR = reflectance from NIR, ρR = reflectance
from red, ρB = reflectance from blue, G is the gain factor,
L is a canopy background adjustment term and C1 and C2 weigh the use of the blue channel in aerosol correction of the red channel. The coefficients used have been usually applied to Landsat TM: L = 1, C1 = 6, C2 = 7.5 and G = 2.5 (Justice et al. 1998).
LSMM - The LSMM is an image processing algo-rithm that generates images with the proportion of each endmember (vegetation, soil and shade) inside a pixel. The proportion values must be nonnegative and they also must add to unity (Shimabukuro & Smith 1991). In this case, the pixel response in any given spectral band is assumed to be a linear combination of the responses of each individual component. For any individual pixel, the linear model can be written as:
ri = Σ (aijxj) + ei i = 1, ..., p n
j = 1
where ri represents the pixel’s mean spectral reflectance in the ith spectral band, aij is the spectral reflectance of the jth component in the ith spectral band, xj is the pro-portion of the jth component within the pixel, n is the number of components, ei is the residual for the ith spec-tral band and p is the number of specspec-tral bands. The pro-portions xj are subjected to two constraints:
Σ xj = 1and xj ≥ 0 for all components
Application of the LSMM to the MODIS radiometric images- The vegetation, soil and shade components (end-members) were extracted from MODIS images. Fig. 1 depicts the spectral answer of the vegetation compo-nent (green) in areas of ciliary’s woods, the shade com-ponent (blue) in the area corresponding to a dam and the soil component (red) in areas of exposed soil in (i) the summer period (from 17 January 2002-1 February 2002) and (ii) the winter period (from 28 July 2002-12 August 2002).
Schistosomiasis prevalence and presence of B. glabra-ta - Schistosomiasis prevalence data were gathered from the Brazilian Health National Foundation and the Health Secretariat of Minas Gerais Annual Reports. Informa-tion on the presence of Biomphalaria was obtained from Souza et al. (2001) and from the Helminthiasis Laboratory and Medical Malacology of the Rene Rachou Research Institute-Fiocruz (MG) (Carvalhoet al. 2008).
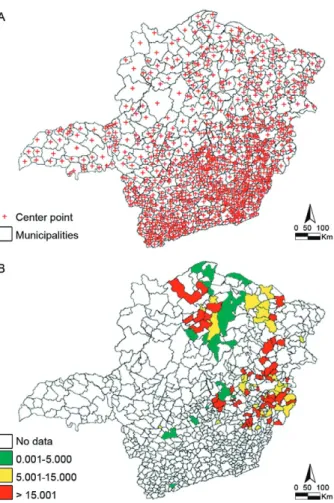
There were 853 points (pixels) in MG selected to cor-respond to the mass centre of each municipality, as de-picted in Fig. 2A. The correlation between fraction im-ages and the VIs was analysed at these 853 points in two seasons (January and July 2002) to determine the extent to which they are linearly related and then represent the same information.
Additionally, 96 municipalities from MG were stud-ied, where information for these municipalities on schis-tosomiasis prevalence and the presence of B. glabrata
was available, as depicted in Fig. 2B. Because these data were available at the municipality level, the averages were extracted by considering the pixels inside area of each municipality for all of the shade, soil and vegetation fraction images.
RESULTS
The soil, vegetation and shade fraction images were generated using the soil, vegetation and shade compo-nents, respectively, of each pixel from the spectral an-swer in MODIS’ several bands.
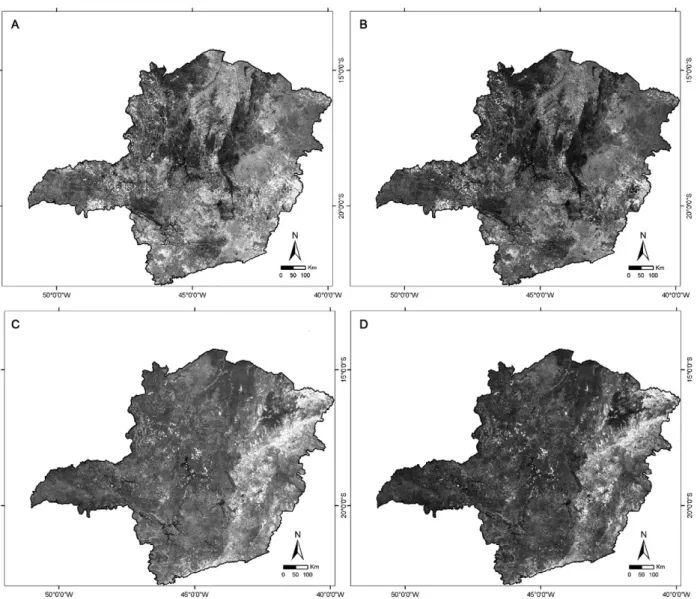
Figs 3 and 4 present the VIs (NDVI and EVI) and the fraction images from each season (January and July 2002) for MG. As apparent in Fig. 3, the highest values (bright pixels) have a similar pattern in the vegetation
0.5960780
0.5364702
0.4768624
0.4172546
0.3576468
0.2980390
0.2384312
0.1788234
0.1192156
0.0596078
0.0000000
0.3690 0.7412 1.1134 1.4856 1.8578 2.2300
Spectral answer
Wavelength
Shade Soil Vegetation
A
0.3529410
0.3176469
0.2823528
0.2470587
0.2117646
0.1764705
0.1411764
0.1058823
0.0705882
0.0352941
0.0000000
0.3690 0.7412 1.1134 1.4856 1.8578 2.2300
Spectral answer
Wavelength
Shade Soil Vegetation
B
Fig. 1: spectral answer of the shade (blue), soil (red) and vegetation (green) components. Extracted of the Moderate Resolution Imaging Spectroradiometer images: A: summer; B: winter.
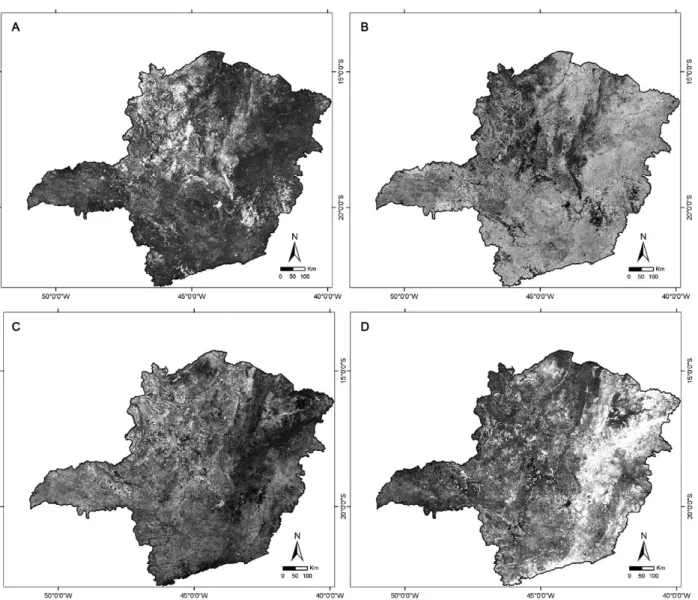
fraction image and in EVI. In Fig. 4, NDVI depicts a similar pattern, however negatively related, with the soil fraction image.
Table I depicts correlations between the VIs and the vegetation, soil and shade fraction images for the two periods (January and July). There was a high correlation between the vegetation fraction image and the EVI (0.90 and 0.96 in the January and July images, respectively) and between the soil fraction image and the NDVI (-0.86 and -0.88 in January and July, respectively).
These results demonstrate that the atmosphere and soil components influenced the NDVI results mainly in the rainy season when the effect of soil between scarcely vegetated areas was greater. Additionally, both the veg-etation fraction image and the EVI were more correlated with the NDVI in the July image (0.85 and 0.91, respec-tively) than the January image (0.65 and 0.63, respective-ly). This is likely due to the fact that rain is nearly absent in July and the vegetation is dry, which consequently minimises the effect of the soil component in the NDVI.
Correlations were higher in July than January for all the variables except the shade fraction image, which had higher correlations with January variables (Table I). This may be because the rainy season is in January, at which time there is more shade from the trees.
The Table II shows the correlation values between the prevalence of schistosomiasis, the presence of B. gla-brata and the soil, vegetation and shade fraction images from MODIS data in January and July 2002.
Correlations that are significant at the 5% are high-lighted in bold. There is not a significant correlation to the fraction images of the rainy season (January 2002) as much as to the prevalence as to the existence of B. glabrata. On the other hand, the prevalence is positively correlated with the vegetation fraction in July 2002 but negatively correlated with the soil fraction. This indi-This indi-cates that the prevalence was associated with the type of vegetation because in the dry season there is better dif-ferentiation between the biomes (e.g., forest, cerrado and
caatinga). Prevalence was negatively correlated with soil
Fig. 4: similar behavior, however inverse, in the soil fraction image (A) and in Normalized Difference Vegetation Index (NDVI) (B) of January/2002 and the soil fraction image (C) and in NDVI (D) of July/2002.
TABLE I
Correlations between the vegetation indices and the vegetation, soil and shade fraction images for the January/2002 [summer (s)] and July/2002 [winter (w)] dates
EVIs NDVIs VEGs SOILs SHADs EVIw NDVIw VEGw SOILw SHADw
EVIs - 0.63 0.90 -0.40 -0.36 0.18 0.16 0.17 -0.07 -0.10
NDVIs 0.63 - 0.65 -0.85 0.41 0.29 0.33 0.27 -0.26 0.05
VEGs 0.90 0.65 - -0.50 -0.34 0.18 0.14 0.19 -0.05 -0.15
SOILs -0.40 -0.85 -0.50 - -0.53 -0.24 -0.27 -0.24 0.30 -0.14
SHADs -0.36 0.41 -0.34 -0.53 - 0.15 0.25 0.12 -0.25 0.20
EVIw 0.18 0.29 0.18 -0.24 0.15 - 0.91 0.96 -0.71 -0.12
NDVIw 0.16 0.33 0.14 -0.27 0.25 0.91 - 0.85 -0.88 0.25
VEGw 0.17 0.27 0.19 -0.24 0.12 0.96 0.85 - -0.71 -0.17
SOILw -0.07 -0.26 -0.05 0.30 -0.25 -0.71 -0.88 -0.71 - -0.57
SHADw -0.10 0.05 -0.15 -0.14 0.20 -0.12 0.25 -0.17 -0.57
fraction, including areas of exposed soil. The shade frac-The shade frac-tion in July 2002 was positively correlated with the pres-ence of B. glabrata, indicating that the mollusc inhabits areas with different forms of relief. Shade fraction can indicate water retention in the soil and in areas with the presence of water bodies (e.g., river, lakes and lagoons).
DISCUSSION
The vegetation fraction image of the LSMM was highly correlated with the EVI, while the soil fraction image was highly correlated with the NDVI for both dates. EVI minimizes the atmospheric and soil influ-ences, as reported by Justiceet al. (1998) and Weier and Herring (2004). Our results indicate that the vegetation fraction image of the LSMM also minimizes the influ-ences of the atmosphere and soil, which makes these im-ages more accurate than the NDVI in the changing of type of vegetation (biome).
This study also found that the variables were not highly correlated between the dry and rainy season, which demonstrates that variables from both seasons can be used in multiple regression analysis. Our results show that the variables from the LSMM in the dry sea-son were significantly correlated with the prevalence of the disease and the presence of the mollusc. This may be due to the fact that higher concentrations of snails occur in the dry season, which increases disease transmission due to the decrease in rain and volume of water bodies and people searching for water bodies to minimize the warmth, either for drinking, bathing or entertainment. This information reiterates the importance of conduct-ing studies on water bodies and snail presence.
The results show that variables from the LSMM can be used in place of the EVI and NDVI to determine and delimit risk areas for the presence of B. glabrata and for the occurrence of schistosomiasis in MG. This informa-tion can be used to improve the allocainforma-tion of resources in disease control.
The fraction images of the LSMM presented in this paper have been used in the following papers:
Freitas et al. (2006), Guimarães et al. (2008) and Martins (2008) used the vegetation, soil and shade frac-tion images to estimate schistosomiasis prevalence in regression models. However, only Martins (2008) ob-tained a model with vegetation fraction image during the dry season.
Martins-Bedé et al. (2010) presented the decision tree approach to model and classify infection risk. In this ap-proach, the main tree was compared to three sub-trees and two sub-trees with the shade fraction image from the dry season (ShadeW) were very similar to the main tree, which did not have the variable ShadeW.
Additionally, Martins-Bedé et al. (2009) proposed the application of a similarity-based fuzzy case-based reasoning approach to classify the prevalence of schisto-somiasis in MG using fraction images.
We observed that fraction images were highly use-ful in the study of schistosomiasis. The fraction images obtained in the dry and rainy seasons can characterise the environment, such as the type of biome (Affonso 2003, Ferreira 2003), geomorphology (Sousa 1998), hy-drography (Hansen et al. 2008) and land cover change (Adams et al. 1995), which are important factors for predictive models.
The use of MODIS images from other dates and places is recommended in order to verify if there is a high corre-lation between fraction images, VIs and the prevalence of schistosomiasis and the occurrence of Biomphalaria.
REFERENCES
Adams JB, Sabol DE, Kapos V, Almeida Filho R, Roberts A, Smith MO, Gillespie AR 1995. Classification of multispectral images based on fractions of endmembers: application to land-cover change in the Brazilian Amazon. Remote Sensing of Environment52: 137-154.
Affonso AG 2003. Caracterização de fisionomias vegetais na Amazô-nia Oriental através de videografia aerotransportada e imagens Landsat 7 ETM+, MSc Thesis, Instituto Nacional de Pesquisas
Espaciais, São José dos Campos, 124 pp.
Barbosa CS, Araújo KC, Antunes L, Favre T, Pieri OS 2004. Spatial distribution of schistosomiasis foci on Itamaracá Island, Pernam-buco, Brazil. Mem Inst Oswaldo Cruz99 (Suppl. I): 79-83.
Bavia ME, Malone JB, Hale L, Dantas A, Marroni L, Reis R 2001. Use of thermal and vegetation index data from earth observing satellites to evaluate the risk of schistosomiasis in Bahia, Brazil.
Acta Trop79: 79-85.
Beck LR, Lobitz BM, Wood BL 2000. Remote sensing and human health: new sensors and new opportunities. Emerg Infect Dis 6: 217-227.
Beck LR, Rodriguez MH, Dister SW, Rodriguez AD, Washino RK, Roberts DR, Spanner MA 1997. Assessment of a remote sensing-based model for predicting malaria transmission risk in villages of Chiapas, Mexico. Am J Trop Med Hyg56: 99-106.
Carvalho OS, Amaral RS, Dutra LV, Scholte RGC, Guerra MAM 2008. Distribuição espacial de Biomphalaria glabrata, B. straminea e B. tenagophila, hospedeiros intermediários do Schis-tosoma mansoni no Brasil. In OS Carvalho, PM Zech Coelho, HL Lenzi (eds.),Schistosoma mansoni e esquistossomose: uma visão multidisciplinar, Editora Fiocruz, Rio de Janeiro, 1124 pp.
Carvalho OS, Dutra LV, Moura AC, Freitas CC, Amaral RS, Drum-mond SC, Freitas CR, Scholte RG, Guimarães RJ, Melo GR, Ragoni V, Guerra M 2005. Desenvolvimento de um sistema de informações para o estudo, planejamento e controle da esquis-tossomose no estado de Minas Gerais, XII Simpósio Brasileiro de Sensoriamento Remoto, INPE, Goiânia, p. 2083-2086.
Carvalho OS, Massara CL, Rocha RS, Katz N 1989. Esquistossomose mansoni no sudoeste do estado de Minas Gerais (Brasil). Rev Saude Publica23: 341-344.
TABLE II Correlation of variables
Variables Prevalence Biomphalaria glabrata
Shadea -0.10 -0.07
Soila 0.01 0.17
Vegetationa 0.11 -0.11
Shadeb -0.10 0.30
Soilb -0.38 -0.12
Vegetationb 0.50 -0.05
Carvalho OS, Rocha RS, Massara CL, Katz N 1987. Expansão da esquistossomose mansoni em Minas Gerais. Mem Inst Oswaldo Cruz82 (Suppl. IV): 295-298.
Carvalho OS, Rocha RS, Massara CL, Katz N 1988. Primeiros casos autóctones de esquistossomose mansoni no município de Para-catu, noroeste do estado de Minas Gerais (Brasil). Rev Saude Publica 22: 237-239.
Chitsulo L, Engels D, Montresor A, Savioli L 2000. The global status of schistosomiasis and its control. Acta Trop77: 41-51.
Cross AM, Settle JJ, Drake NA, Paivinen RTM 1991. Subpixel mea-surement of tropical forest cover using AVHRR data. Int J Remo-te Sens12: 1119-1129.
Cross ER, Sheffield C, Perrine R, Pazzaglia G 1984. Predicting areas endemic for schistosomiasis using weather variables and a Land-sat data base. Mil Med149: 542-544.
Ferreira ME 2003. Análise do modelo linear de mistura espectral na discriminação de fitofisionomias do Parque Nacional de Bra-sília (bioma cerrado), MSc Thesis, Universidade de Brasília, Brasília, 96 pp.
Freitas CC, Guimarães RJ, Dutra LV, Martins FT, Gouvêa EJ, San-tos RA, Moura AC, Drummond SC, Amaral RS, Carvalho OS 2006. Remote sensing and geographic information systems for the study of schistosomiasis in the state of Minas Gerais, Brazil, IEEE International Geoscience and Remote Sensing Symposium, Denver, p. 2436-2439.
Graeff-Teixeira C, dos Anjos CB, de Oliveira VC, Velloso CF, da Fon-seca MB, Valar C, Moraes C, Garrido CT, do Amaral RS 1999. Identification of a transmission focus of Schistosoma mansoni in the southernmost Brazilian state, Rio Grande do Sul. Mem Inst Oswaldo Cruz94: 9-10.
Guimarães RJ, Freitas CC, Dutra LV, Felgueiras CA, Moura AC, Amaral RS, Drummond SC, Scholte RG, Oliveira G, Carvalho OS 2009. Spatial distribution of Biomphalaria mollusks at São Francisco River Basin, Minas Gerais, Brazil, using geostatistical procedures. Acta Trop109: 181-186.
Guimarães RJ, Freitas CC, Dutra LV, Moura AC, Amaral RS, Drum-mond SC, Scholte RG, Carvalho OS 2008. Schistosomiasis risk estimation in Minas Gerais state, Brazil, using environmental data and GIS techniques. Acta Trop108: 234-341.
Guimarães RJPS, Freitas CC, Dutra LV, Moura AC, Amaral RS, Drummond SC, Guerra M, Scholte RG, Freitas CR, Carvalho OS 2006. Analysis and estimative of schistosomiasis prevalence for the state of Minas Gerais, Brazil, using multiple regression with social and environmental spatial data. Mem Inst Oswaldo Cruz 101 (Suppl. I): 91-96.
Hansen MC, Shimabukuro YE, Potapov P, Pittman K 2008. Com-paring annual MODIS and PRODES forest cover change data for advancing monitoring of Brazilian forest cover. Remote Sensing of Environment112: 3784-3793.
Huete AR, Justice CO, van Leeuwen W 1999. MODIS vegetation index (MOD13) algorithm theoretical basis document.Available from: http://modis.gsfc.nasa.gov/data/atbd/atbd_mod13.pdf.
Justice CO, Vermote E, Townshend JR, DeFries R, Roy PD, Hall DK, Salomonson VV, Privette JL, Riggs G, Strahler A, Lucht W, Myneni RP, Knyazikhin Y, Running WS, Nemani RR, Wan Z, Huete AR, van Leeuwen W, Wolfe RE, Giglio L, Muller JP, Lew-is P, Barnsley MJ 1998. The moderate resolution imaging spec-troradiometer (MODIS): land remote sensing for global change research. IEEE Trans Geosci Remote Sens36: 1228-1249.
Katz N, Carvalho OS 1983. Introdução recente da esquistossomo-se mansoni no sul do estado de Minas Gerais, Brasil. Mem Inst Oswaldo Cruz78: 281-284.
Katz N, Dias EP, de Souza CP, Bruce JI, Coles GC 1989. Rate of ac-Rate of ac-tion of schistosomicides in mice infected with Schistosoma man-soni. Rev Soc Bras Med Trop22: 183-186.
Katz N, Mota E, Oliveira VB, Carvalho EF 1978. Prevalência da es-quistossomose em escolares no estado de Minas Gerais, Resumos do XIV Congresso da Sociedade Brasileira de Medicina Tropical e III Congresso da Sociedade Brasileira de Parasitologia, Editora Universitária, João Pessoa, 102 pp.
Lambertucci JR, Rocha RS, Carvalho OS, Katz N 1987. A esquis-tossomose mansoni em Minas Gerais. Rev Soc Bras Med Trop 20: 47-52.
Martins FT 2008. Mapeamento do risco da esquistossomose no es-tado de Minas Gerais usando dados ambientais e sociais, MSc Thesis, Instituto Nacional de Pesquisas Espaciais, São José dos Campos, 145 pp.
Martins-Bedé FT, DutraLV, Freitas CC, Guimarães RJ, Amaral RS, Drummond SC, Carvalho OS 2010. Schistosomiasis risk map-Schistosomiasis risk map-ping in the state of Minas Gerais, Brazil, using a decision tree approach, remote sensing data and sociological indicators. Mem Inst Oswaldo Cruz 105: 541-548.
Martins-Bedé FT, Godo L, Sandri S, Dutra LV, Freitas CC, Carvalho OS, Guimarães RJ, Amaral RS 2009. Classification of schisto-somiasis prevalence using fuzzy case-based reasoning. In J Ca-bestany, F Sandoval, A Prieto, JM Corchado (eds.), Bio-inspired systems: computational and ambient intelligence, Springer Ber-lin Heidelberg, Salamanca, p. 1053-1060.
Pellon AB, Teixeira I 1950. Distribuição geográfica da esquistosso-mose mansônica no Brasil,Divisão de Organização Sanitária, Rio de Janeiro, 117 pp.
Quarmby NA, Townshend JR, Settle JJ, White KH, Milnes M, Hindle TL, Silleos N 1992. Linear mixture modelling applied to AVHRR data for crop area estimation. Int J Remote Sens13: 415-425.
Running WS, Justice CO, Salomonson V, Hall D, Barker J, Kaufman JY, Strahler AH, Huete AR, Muller JP, Vanderbilt V, Wan ZM, Teillet P, Carneggie D 1994. Terrestrial remote sensing science and algorithms planned for EOS/MODIS. Int J Remote Sens15: 3587-3620.
Shimabukuro YE, Smith JA 1991. The least-square mixing models to generate fraction images derived from remote sensing multispec-tral data. IEEE Trans Geosci Remote Sens29: 16-20.
Sousa CJ 1998. Carta de vulnerabilidade à erosão como subsídio ao zoneamento ecológico-econômico em área intensamente an-tropizada, MSc Thesis, Instituto Nacional de Pesquisas Espaci-ais, São José dos Campos, 172 pp.
Souza CP, Caldeira RL, Drummond SC, Melo AL, Guimarães CT, Soares DM, Carvalho OS 2001. Geographical distribution of
Biomphalaria snails in the state of Minas Gerais, Brazil. Mem Inst Oswaldo Cruz96: 293-302.
Weier J, Herring D 2004. Measuring vegetation (NDVI & EVI). [cited 2004 Nov] Available from: http://earthobservatory.nasa.gov/Li-brary/MeasuringVegetation/measuring_vegetation_4.html.