Vegetation indices in the prediction of biomass
and grain yield of white oat under irrigation levels
1Anderson Prates Coelho2, David Luciano Rosalen2, Rogério Teixeira de Faria2
INTRODUCTION
White oat is an excellent agricultural option for cultivation in the Brazilian winter, due to its multiple uses. It can be used for no-till production, direct grazing, silage, hay and grain production. Most of the Brazilian territory presents a dry winter, and water plays a fundamental role in the white oat yield. With irrigation, the biomass and grain yield increase to up to 18 % and 52 %, respectively (Choudhary & Prabhu 2016, Panasiewicz et al. 2017).
ABSTRACT
RESUMO
Water stress in agricultural crops can be accurately identified by remote sensing (Ihuoma & Madramootoo 2017). Several sensors and indices have been used for irrigation management, presenting low cost and high viability (Ihuoma & Madramootoo 2017). These include structural indices and chlorophyll, photochemical and thermal indicators (Zarco-Tejada et al. 2013). Among the most well-known indices are the structural ones, which include the Normalized Difference Vegetation Index (NDVI) (Rouse et al. 1974), Renormalized Difference Vegetation Index (RDVI), Reverse Vegetation Index
1. Manuscript received in Feb./2018 and accepted for publication in May/2018 (http://dx.doi.org/10.1590/1983-40632018v4851523). 2. Universidade Estadual Paulista, Faculdade de Ciências Agrárias e Veterinárias, Departamento de Engenharia Rural,
Vegetation indices are widely used to indicate the nutritional status of crops, as well as to estimate their harvest yield. However, their accuracy is influenced by the phenological stage of evaluation and the index used. The present study aimed to evaluate the accuracy of the Normalized Difference Vegetation Index (NDVI) and Inverse Ratio Vegetation Index (IRVI) in the prediction of grain yield and biomass of white oat cultivated under irrigation levels, besides indicating the best phenological stage for evaluation. The irrigation levels consisted of 11 %, 31 %, 60 %, 87 % and 100 % of the maximum evapotranspiration, with four replicates. The mean values for NDVI and IRVI were determined using an active terrestrial sensor, at four phenological stages (4, 8, 10 and 10.5.4). The white oat grain yield and biomass may be estimated with a high precision using the NDVI and IRVI. The NDVI was more accurate than the IRVI. The grain yield estimate was more accurate from the flag leaf sheath appearance stage (10), whereas, for the biomass, the best estimate was for the kernel watery ripe stage (10.5.4).
KEYWORDS: Geotechnology; remote sensing; water stress.
Índices de vegetação na predição da produtividade de biomassa e grãos de aveia-branca sob lâminas de irrigação
Índices de vegetação são muito utilizados para indicar o estado nutricional das culturas, bem como estimar sua produtividade final. No entanto, sua precisão é influenciada pelo estágio fenológico da avaliação e pelo índice utilizado. Objetivou-se avaliar a acurácia do Índice de Vegetação por Diferença Normalizada (IVDN) e do Índice de Vegetação de Proporção Inversa (IVPI), na predição da produtividade de grãos e biomassa de aveia-branca cultivada sob lâminas de irrigação, além de indicar o melhor estádio fenológico para avaliação. As lâminas de irrigação foram de 11 %, 31 %, 60 %, 87 % e 100 % da evapotranspiração máxima, com quatro repetições. Os valores médios de IVDN e IVPI foram determinados utilizando-se um sensor terrestre ativo, em quatro estágios fenológicos (4, 8, 10 e 10.5.4). A produtividade de grãos e biomassa de aveia branca podem ser estimadas com elevada precisão utilizando-se os índices IVDN e IVPI. O IVDN apresentou maior acurácia do que o IVPI. A estimativa da produtividade de grãos resultou em maior acurácia a partir do estádio de aparecimento da bainha da folha bandeira (10), enquanto, para a biomassa, a melhor estimativa foi para o estádio de grão aquoso (10.5.4).
(RVI) and Inverse Ratio Vegetation Index (IRVI) (Richardson & Wiegand 1977).
The evaluation of vegetation indices enables to identify the nutritional status of plants, especially in relation to nitrogen (Santos et al. 2017, Zhao et al. 2018). As the value of these indices varies with the crop growth stage, the crop coefficient (kc) for irrigation management can be defined as its function (Kamble et al. 2013). Other applications of these indices include the estimation of productivity, biomass, protein content, nitrogen fertilizer content and weed control (Yao et al. 2012, Kapp Júnior et al. 2016, Pantazi et al. 2016).
The accuracy for predicting biomass and crop yield using the vegetation indices depends on several factors, such as the climate of the region, crop, phenological stage of evaluation, and even the index used (Bolton & Friedl 2013, Bredemeier et al. 2013). The NDVI may be insensitive to increased crop biomass when there is extensive ground cover by the plant canopy (Povh et al. 2008). Therefore, the evaluation of other indices with simple relationships, such as the IRVI, may be more accurate in predicting the crop yield at a certain time (Li et al. 2010). Thus, it is important to define the best stage of the crop cycle for evaluation using geotechnologies, in order to avoid a higher soil cover and, consequently, the saturation of the index; and to identify the index that is most adequate, with better prediction accuracy, in relation to the agronomic variables.
Thus, this study aimed to evaluate the accuracy of two vegetation indices (NDVI and IRVI) in predicting the grain yield and biomass of white oat cultivated under irrigation levels, besides indicating the best phenological stage to evaluate
and define the irrigation levels that guarantee the maximum and minimum values for NDVI and IRVI, respectively.
MATERIAL AND METHODS
The study was carried out at the experimental farm of the Universidade Estadual Paulista (Unesp), in Jaboticabal, São Paulo state, Brazil (21º14′44″S, 48º17′00″W and 545 m above the sea level). The climate of the region, according to the Köppen classification, is Cwa, subtropical, relatively dry in the winter, with summer rains, presenting an average annual temperature and precipitation of 22 ºC and 1,424.6 mm, respectively (Alvares et al. 2013). The soil of the experimental area is classified as an Eutrophic Red Oxisol (Embrapa 2013), whose physical and chemical attributes are presented in Tables 1 and 2, respectively (Raij et al. 2002).
The white oat (IAC 7) seeds (with 95 % of germination rate) were sown on 09 May 2017, at a density of 80 kg ha-1, with 17 cm line spacing,
in an area previously cultivated with Urochloa
brizantha ‘Marandu’. Liming was performed at 30
days before the installation of the experiment, at a dose of 1.5 t ha-1 of limestone with PRNT equal to
80. Planting fertilization included: 20 kg ha-1 of N,
160 kg ha-1 of P
2O5 and 160 kg ha -1 of K
2O. Covering
fertilization was carried out twice with N (urea), at a dose of 100 kg ha-1; the first application was during
the oat tillering (60 % of the dose); and the second during the rubber phase (40 % of the dose). The “sprinkler axis” type experimental design was used. This design enables the distribution of irrigation water at variable application depths, with a distance from
OM: organic matter; BS: base saturation; CEC: cation exchange capacity.
Depth pH OM Presin S H + Al Al K Ca Mg BS CEC BS%
cm CaCl2 g dm-³ ____ mg dm-³ ____ ___________________________________ mmolc dm-³ ___________________________________
0-20 5.6 40 67 5 21 1 3.4 36 13 52.7 73.9 71
20-40 5.8 40 68 5 20 1 3.2 36 11 50.3 70.4 71
Table 2. Chemical attributes of the soil at the experimental area.
Depth Density Moisture (field capacity) Moisture (permanent wilting point) Sand Clay Silt Soil texture cm g cm-3 ___________________________________ cm3 cm-3 ___________________________________ ____________ g kg-1 ____________
0-20 1.45 0.45 0.33 310 470 220 Clayed
20-40 1.49 0.41 0.30 270 520 210 Clayed
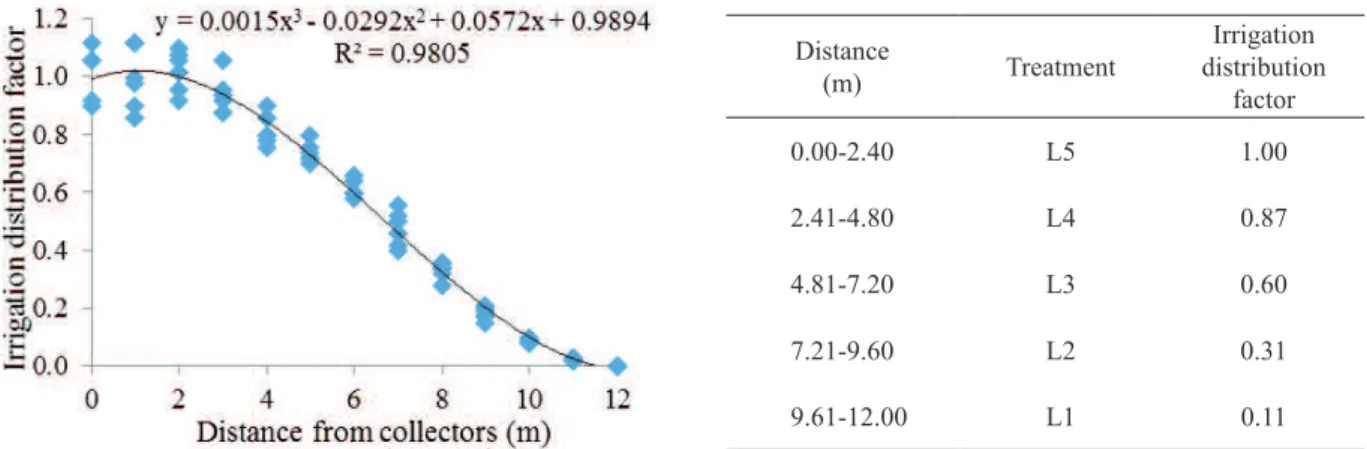
the sprinkler centerline (Lauer 1983). In the field test, the fraction of sprinkler precipitation distribution was also defined (Figure 1).
Sprinklers Senninger Model 3023-2 and nozzles ¾ “M 08Qx05, with row spacing of 6.0 m, were used. The water application rate of the sprinklers was measured in the field using collectors, with a rate of 12 mm h-1 for the highest irrigation level. The
treatments included five irrigation levels: 11 % (L1), 31 % (L2), 60 % (L3), 87 % (L4) and 100 % (L5) of the crop evapotranspiration (ETc). The treatments were distributed in an experimental design of rows, with four replications.
The sprinkler precipitation distribution factor was determined by the collector test (Figure 1). The experimental plots were 4.5 m long and 2.4 m wide, in a total area of 216 m2 (24 m × 9 m). The
first 50 cm on each side of the plots were considered as border.
The irrigation management followed the crop water demand, according to the FAO-56 method, using daily climatic data obtained from the automatic agrometeorological station of the Unesp. The reference evapotranspiration (ETo) was estimated daily using the Penman-Monteith equation (Allen et al. 1998), while the evapotranspiration of the oat crop (ETc) was calculated by the product of ETo and kc (Allen et al. 1998).
Irrigation was always performed when the water deficit in the area was equal to 23 mm. This was calculated according to the phenological stages of the white oat and physical attributes of the soil (Table 1). The effective root depth of 40 cm and soil water availability factor of 50 % were used in the calculation (Allen et al. 1998).
There were no temperature abnormalities during the experimental period (Figure 2a). The mean maximum, minimum and average temperatures
Figure 1. Irrigation distribution factor of sprinklers, as a function of distance or irrigation treatment, with sprinklers spaced at 6.0 m in the row.
Figure 2. Maximum, minimum and average daily temperatures (a); precipitation, ETc and daily irrigation depth (b), during the experimental period (09 May to 24 August 2017).
(a) (b)
Distance
(m) Treatment
Irrigation distribution
factor
0.00-2.40 L5 1.00
2.41-4.80 L4 0.87
4.81-7.20 L3 0.60
7.21-9.60 L2 0.31
before flowering were 26.4 ºC, 13.8 ºC and 19.5 ºC, respectively, and 27.2 ºC, 13.1 ºC and 19.6 ºC, respectively, between flowering and harvest.
According to Ugarte et al. (2007), high temperatures before winter cereal anthesis are more deleterious to crops than high temperatures after anthesis. They also reported that the maximum temperature limit for this period is 28 ºC. The accumulated precipitation and ETc for the oat growth cycle were 126.6 mm and 207.4 mm, respectively (Figure 2b). The irrigation depth for the treatment with 100 % of ETc (L5) was 158 mm, with values varying proportionately with the water application rate for other treatments.
The ground sensor used was the portable GreenSeeker HandHeldTM. It is noteworthy that this sensor automatically generates two vegetation indices, NDVI (equation 1) and IRVI (equation 2), from the measurement of spectral response at 650 nm (red band) and 770 nm (near infrared band). The collection of data with the GreenSeeker was carried out manually, by passing over the canopy (0.5 m above) of the white oat. The area sampled per plot was 5.9 m2, corresponding to 9.8 m of displacement,
with a useful width of 0.6 m captured by the sensor, generating an average value of 20 to 30 measurements of NDVI (equation 1) and IRVI (equation 2) per repetition, with the GreenSeeker calibration always performed on soil without vegetation:
NDVI = ρnir - ρr
ρnir + ρr (1)
IRVI = ρr ρnir
(2)
where NDVI is the vegetation index by normalized difference, IRVI the inverse ratio of vegetation index, ρnir the near infrared reflectance (770 nm) and ρr the red reflectance (650 nm).
The NDVI and IRVI indices were determined at four phenological stages: pseudocaule appearance (4), rubbery (8), flag leaf sheath appearance (10) and kernel watery ripe (10.5.4), according to the phenology scale for winter cereals by Feeks & Large (Large 1954). Each replicate presented the mean value of NDVI and IRVI, which correlated with the grain yield and biomass of each plot for the analysis of simple linear regression.
The grain yield of the white oat was calculated by harvesting 2 m2 of each plot. The grain moisture
content was standardized at 14 % to calculate yield. To obtain the biomass, 0.5 m2 of each plot was
harvested and placed in a forced circulation oven at 65 ºC, for 72 h, to obtain the dry matter.
The fitting quality of the model was evaluated by the adjusted determination coefficient (R2)
(Cornell & Berger 1987), Root Mean Square Error (RMSE) and Mean Bias Error (MBE) (Ghilani & Wolf 2006): N ) Yest (Yobs RMSE N 1 i 2 i i
∑
= −= (3)
N ) Yest (Yobs MBE N 1 i i i
∑
= −= (4)
where N is the number of data, Xobsi the observed values of X, Yobsi the observed values of Y and Yesti the estimated values of Y.
The outliers were removed as described by Belsley et al. (1980). The variance analysis of the models was performed by the F test (1 % of probability). Adjusted determination coefficient values above 0.7 were considered high.
RESULTS AND DISCUSSION
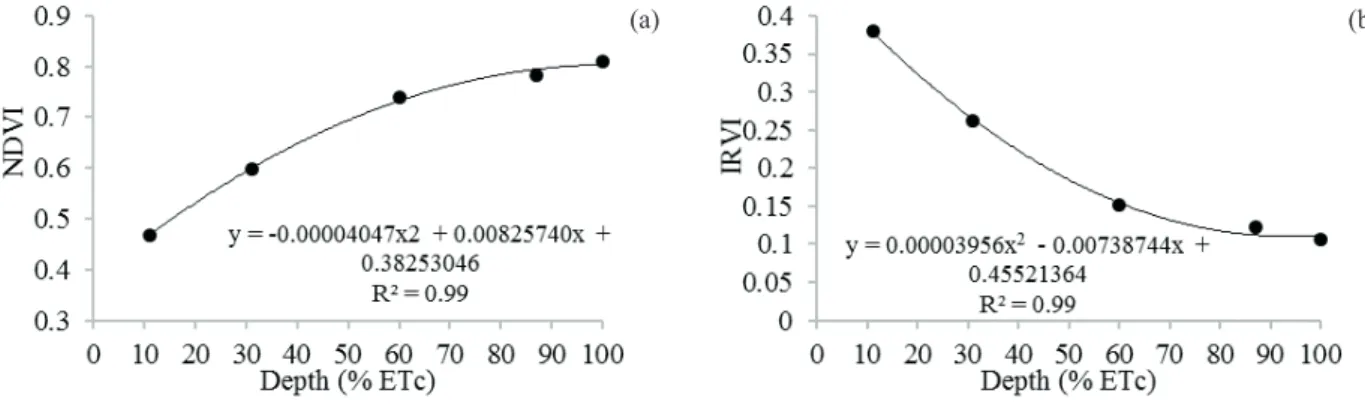
The maximum and minimum values for NDVI and IRVI were obtained at the irrigation levels of 102 % and 93.4 % of the ETc, respectively (Figure 3). That is, the deficit irrigation can induce physiological disturbances in white oat, as the maximum and minimum values of NDVI and IRVI were close to 100 % of the ETc, therefore accurately indicating the physiological state of plants (Ihuoma & Madramootoo 2017). As the IRVI is the ratio of red reflectance and infrared reflectance, the values decrease with the increase in biomass, because the higher the biomass, the lower the red band reflectance (650 nm) and the higher the infrared band reflectance (770 nm).
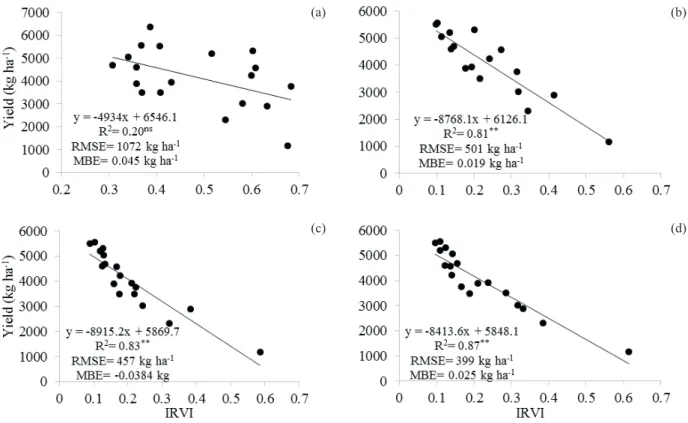
Except for the first analysis of NDVI and IRVI at the stage 4, all regression estimates were statistically significant (p < 0.0001) to estimate the oat grain yield (Figures 4 and 5).
The low correlation between NDVI and IRVI and grain yield in the first analysis may be explained as a function of the crop fertilization and phenological stage (low soil cover). Covering fertilization with N was carried out in two stages, with the first dose (60 % of the total dose) applied to the treatment rows. In addition, as the oat crop was at the beginning of its development process, the nutrient demand was low, being fulfilled by the amount applied at sowing
and at the first cover, and there were no significant differences between treatments.
The NDVI presented a higher accuracy in the estimation of grain yield than the IRVI. The accuracy (R2) of the NDVI was higher in the last
two analyses, and the error (RMSE) was lower than that obtained by the IRVI. However, it was observed that the error and precision of the model generated for the NDVI stabilized at the stage 10, whereas,
Figure 3. Regression estimates for irrigation levels that guarantee the maximum values of NDVI (a) and IRVI (b). Mean values per treatment at the stage 10.5.4 (kernel watery ripe). ETc: crop evapotranspiration.
Figure 4. Performance of the models using the NDVI in the estimation of the white oat yield at the stages 4 (a), 8 (b), 10 (c) and 10.5.4 (d), according to the phenological scale of Feeks and Large (Large 1954). *, ** and ns Significant at 5 % and 1 %
and non-significant, respectively.
(a)
(d) (c)
(b)
for the IRVI, an increasing trend in precision and a decreasing trend in error were observed with the evaluation stage. This might have occurred due to the saturation of the NDVI values generated by the large soil cover in the advanced stages of the crop cycle, which can be corrected using adjustments in the assessment of readings in different infrared bands (Gu et al. 2013).
Similarly to the findings of the present study, Wang et al. (2014) reported that the highest correlation with wheat grain yield was obtained with the NDVI and at the grain filling start stage (10.5.4). This is because vegetation indices provide an estimate of the chlorophyll content in the leaves of plants (Zarco-Tejada et al. 2013). Therefore, leaves with a higher concentration of chlorophyll have a direct correlation with the final yield (Pramanik & Bera 2013), thus increasing the rate of photosynthesis and photoassimilates for grain filling (Zhang et al. 2013).
Although vegetation indices have been widely used in studies on N doses, their use in experiments with irrigation levels also provides good results. For instance, in the present study, there was a difference
in the values between treatments, since, according to Zhang et al. (2011), water stress decreases the chlorophyll content in the leaves, affecting the NDVI readings. This is because the treatments with a small water application layer increase N losses by volatilization (Viero et al. 2017). In addition, water is the transport medium of nutrients for plants and, therefore, water deficiency in the soil leads to nutritional stress in plants (Lisar et al. 2012).
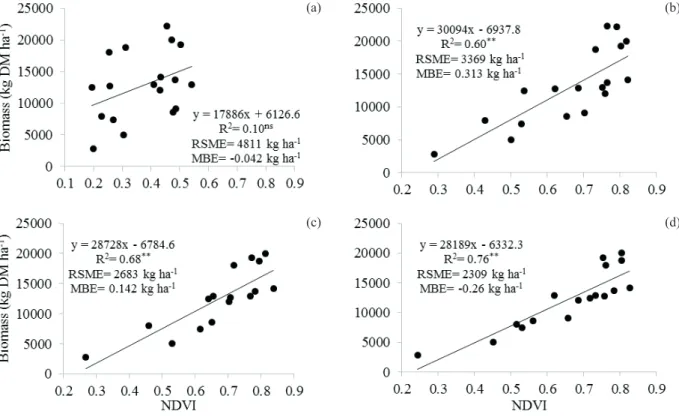
All regression estimates were statistically significant (p < 0.0001) for the estimation of white oat biomass using the NDVI and IRVI indices, except for the first analysis (Figures 6 and 7). The highest accuracy for the models was observed for the analysis at the stage 10.5.4. The regression estimates that were significant were more accurate when the NDVI was used, in all the evaluations, presenting more accurate (R2) and smaller error (RMSE). The trend (MBE)
was practically nil in all evaluations and for the two indices studied.
The biomass estimate was not as accurate as the grain yield estimate. In peanut, Zerbato et al. (2016) reported an R2 of 0.27 in the estimation of crop
biomass, whereas, in rice and barley, the highest R2
Figure 5. Performance of the models using the IRVI in the estimation of white oat grain yield at the stages 4 (a), 8 (b), 10 (c) and 10.5.4 (d), according to the phenological scale of Feeks and Large (Large 1954). *, ** and ns Significant at 5 % and 1 %
and non-significant, respectively.
(a)
(d) (c)
Figure 6. Performance of the NDVI models in the estimation of white oat biomass at the stages 4 (a), 8 (b), 10 (c) and 10.5.4 (d), according to the phenological scale of Feeks and Large (Large 1954). DM: dry mass. *, ** and ns Significant at 5 % and
1 % and non-significant, respectively.
Figure 7. Performance of the models using the IRVI in the estimation of white oat biomass at the stages 4 (a), 8 (b), 10 (c) and 10.5.4 (d), according to the phenological scale of Feeks and Large (Large 1954). DM: dry mass. *, ** and ns Significant at
5 % and 1 % and non-significant, respectively. (a)
(d) (c)
(b) (a)
(d) (c)
observed were 0.51 and 0.76, respectively, presenting a low estimation accuracy (Gnyp et al. 2014, Tilly et al. 2015). This might be due to the great spatial variability of this attribute, being influenced by several factors, such as spacing, plant height, shading and genetic potential. In winter crops, which are marketed as lineages, this variability is even higher, which is not as pronounced as that in hybrids (Gnyp et al. 2014).
By evaluating two devices and the NDVI and IRVI indices in the estimation of the biomass and N content in the leaf, Kapp Júnior et al. (2016) did not observe differences between the devices and indices, presenting a similar correlation coefficient. For the leaf area estimation, the IRVI is more accurate than the NDVI (Kulig et al. 2014). This might be associated with the saturation of NDVI values in dense vegetation, as previously reported by Povh et al. (2008).
CONCLUSIONS
1. The grain yield and biomass of white oat may be estimated with high accuracy using the NDVI and IRVI vegetation indices;
2. The NDVI presents a higher accuracy than the IRVI in the estimation of white oat yield;
3. The estimation of white oat grain yield presents a higher accuracy from the appearance stage of the leaf sheath (10), whereas the best estimate for biomass is at the kernel watery ripe stage (10.5.4); 4. Irrigation deficit is not recommended for white
oat, according to the irrigation levels calculated as a function of the maximum value for the NDVI (102 % of the ETc) and IRVI (93.4 % of the ETc).
ACKNOWLEDGMENTS
The authors thank the Conselho Nacional de
Desenvolvimento Científico e Tecnológico (CNPq), for the scholarship granted to the first author.
REFERENCES
ALLEN, R. G. et al. Crop evapotranspiration: guidelines for computing crop water requirements. Rome: FAO, 1998. (Irrigation and drainage paper, 56).
ALVARES, C. A. et al. Köppen’s climate classification
map for Brazil. Meteorologische Zeitschrift, v. 22, n. 6, p. 711-728, 2013.
BELSLEY, D. A. et al. Identifying influential data and
sources of collinearity: regression diagnostics. New York: John Wiley & Sons, 1980.
BOLTON, D. K.; FRIEDL, M. A. Forecasting crop yield using remotely sensed vegetation indices and crop phenology metrics. Agricultural and Forest Meteorology, v. 173, n. 1, p. 74-84, 2013.
BREDEMEIER, C. et al. Estimativa do potencial produtivo em trigo utilizando sensor óptico ativo para adubação nitrogenada em taxa variável. Ciência Rural, v. 43, n. 7, p. 1147-1154, 2013.
CHOUDHARY, M.; PRABHU, G. Response of fodder oat varieties to irrigation and fertilizer gradient. Range Management and Agroforestry, v. 37, n. 2, p. 201-206, 2016.
CORNELL, J. A.; BERGER, R. D. Factors that influence the value of the coefficient of determination in simple
linear and nonlinear regression models. Phytopathology, v. 77, n. 1, p. 63-70, 1987.
E M P R E S A B R A S I L E I R A D E P E S Q U I S A AGROPECUÁRIA (Embrapa). Sistema brasileiro de
classificação de solos. 3. ed. Brasília, DF: Embrapa, 2013. GHILANI, C. D.; WOLF, P. R. Adjustment computations: spatial data analysis. 4. ed. New Jersey: John Wiley & Sons, 2006.
GNYP, M. L. et al. Hyperspectral canopy sensing of paddy
rice aboveground biomass at different growth stages. Field
Crops Research, v. 155, n. 1, p. 42-55, 2014.
GU, Y. et al. NDVI saturation adjustment: a new approach for improving cropland performance estimates in the Greater Platte river basin, USA. Ecological Indicators, v. 30, n. 1, p. 1-6, 2013.
IHUOMA, S. O.; MADRAMOOTOO, C. A. Recent advances in crop water stress detection. Computers and
Electronics in Agriculture, v. 141, n. 1, p. 267-275, 2017.
KAMBLE, B. et al. Estimating crop coefficients using
remote sensing-based vegetation index. Remote Sensing, v. 5, n. 4, p. 1588-1602, 2013.
KAPP JÚNIOR, C. et al. Use of active canopy sensors to discriminate wheat response to nitrogen fertilization under no-tillage. Engenharia Agrícola, v. 36, n. 5, p. 886-894, 2016.
KULIG, B. et al. Effect of the method of plant protection
on the yield, root development and formation of vegetation indices of faba bean canopy. Bulgarian Journal of
LAUER, D. A. Line-source sprinkler systems for experimentation with sprinkler-applied nitrogen fertilizers.
Soil Science Society of America Journal, v. 47, n. 1, p. 124-128, 1983.
LI, F. et al. Evaluating hyperspectral vegetation indices for estimating nitrogen concentration of winter wheat at
different growth stages. Precision Agriculture, v. 11, n. 4, p. 335-357, 2010.
LISAR, S. Y. S. et al. Water stress in plants: causes, effects
and responses. In: RAHMAN, I. M. M. (Ed.). Water stress. Rijeka: Intech, 2012. p. 1-14.
PANASIEWICZ, K. et al. Response of three oat forms to sprinkling irrigation and nitrogen fertilization. Turkish
Journal of Field Crops, v. 22, n. 1, p. 81-88, 2017. PANTAZI, X. E. et al. Active learning system for weed species recognition based on hyperspectral sensing. Biosystems Engineering, v. 146, n. 1, p. 193-202, 2016.
POVH, F. P. et al. Comportamento do NDVI obtido por sensor ótico ativo em cereais. Pesquisa Agropecuária
Brasileira, v. 43, n. 8, p. 1075-1083, 2008.
PRAMANIK, K.; BERA, A. K. Effect of seedling age and
nitrogen fertilizer on growth, chlorophyll content, yield and economics of hybrid rice (Oryza sativa L.). International
Journal of Agronomy and Plant Production, v. 4, n. 5, p. 3489-3499, 2013.
RAIJ, B. V. et al. Análise química para avaliação da
fertilidade de solos tropicais. Campinas: IAC, 2001. RICHARDSON, A. J.; WIEGAND, C. L. Distinguishing vegetation from soil background information.
Photogrammetric Engineering and Remote Sensing, v. 43, n. 12, p. 1541-1552, 1977.
ROUSE, J. W. et al. Monitoring vegetation systems in the great plains with ERTS. In: EARTH RESOURCES TECHNOLOGY SATELLITE-1 SYMPOSIUM, 3., 1973, Washington, DC. Proceedings… Washington, DC: NASA, 1973. p. 307-317.
SANTOS, G. O. et al. Use of active optical sensor in the characteristics analysis of the fertigated brachiaria with treated sewage. Engenharia Agrícola, v. 37, n. 6, p. 1213-1221, 2017.
TILLY, N. et al. Fusion of plant height and vegetation indices for the estimation of barley biomass. Remote Sensing, v. 7, n. 9, p. 11449-11480, 2015.
UGARTE, C. et al. Grain weight and grain number responsiveness to pre-anthesis temperature in wheat, barley and triticale. Field Crops Research, v. 100, n. 2, p. 240-248, 2007.
VIERO, F. et al. Urease inhibitor and irrigation management to mitigate ammonia volatilization from urea in no-till corn. Revista Brasileira de Ciência do Solo, v. 41, e0160567, 2017.
WANG, L. et al. Predicting grain yield and protein content in wheat by fusing multi-sensor and multi-temporal remote-sensing images. Field Crops Research, v. 164, n. 1, p. 178-188, 2014.
YAO, Y. et al. Active canopy sensor-based precision N management strategy for rice. Agronomy for Sustainable
Development, v. 32, n. 4, p. 925-933, 2012.
ZARCO-TEJADA, P. J. et al. A PRI-based water stress index combining structural and chlorophyll effects: assessment using diurnal narrow-band airborne imagery and the CWSI thermal index. Remote Sensing of Environment, v. 138, n. 1, p. 38-50, 2013.
ZERBATO, C. et al. Agronomic characteristics associated
with the normalized difference vegetation index (NDVI)
in the peanut crop. Australian Journal of Crop Science, v. 10, n. 5, p. 758-764, 2016.
ZHANG, X. et al. Effects of root interaction and nitrogen
fertilization on the chlorophyll content, root activity, photosynthetic characteristics of intercropped soybean and microbial quantity in the rhizosphere. Plant and Soil Environment, v. 59, n. 2, p. 80-88, 2013.
ZHANG, Y. J. et al. Effect of water stress on leaf photosynthesis, chlorophyll content, and growth of oriental lily. Russian Journal of Plant Physiology, v. 58, n. 5, p. 844-850, 2011.