Daniele Gutterres Pinto(1), Denise Cybis Fontana(1), Genei Antonio Dalmago(2), Elizandro Fochesatto(3), Matheus Boni Vicari(4), Carolina Bremm(5), Gilberto Rocca da Cunha(2),
Jorge Alberto de Gouvêa(2) and Anderson Santi(2)
(1)Universidade Federal do Rio Grande do Sul, Departamento de Plantas Forrageiras e Agrometeorologia, Avenida Bento Gonçalves, no 7.712, Agronomia, CEP 91540-000 Porto Alegre, RS, Brazil. E-mail: daniele.gutterres@gmail.com, dfontana@ufrgs.br (2)Embrapa Trigo, Rodovia BR 285, Km 294, CEP 99050-970 Passo Fundo, RS, Brazil. E-mail: genei.dalmago@embrapa.br, gilberto.cunha@embrapa.br, jorge.gouvea@embrapa.br, anderson.santi@embrapa.br (3)Faculdades Integradas do Vale do Iguaçu, Departamento de Agronomia, Padre Saporiti, no 717, Rio D’areia, CEP 84600-000 União da Vitória, PR, Brazil. E-mail: elizandrofochesatto@hotmail.com (4)University College London, Department of Geography, Gower Street, WC1E6BT, London, United Kingdom. E-mail: matheus_boni_vicari@hotmail.com (5)Fundação Estadual de Pesquisa Agropecuária, Sede, Divisão de Pesquisa e Inovação Tecnológica, Gonçalves Dias, no 570, Menino Deus, CEP 90130-060 Porto Alegre, RS, Brazil. E-mail: carolina-bremm@fepagro.rs.gov.br
Abstract – The objective of this work was to identify the spectral bands, vegetation indices, and periods of the canola crop season in which the correlation between spectral data and biophysical indicators (total shoot dry matter and grain yield) is most significant. The experiment was carried out during the 2013 and 2014 crop seasons at Embrapa Trigo, in the state of Rio Grande do Sul, Brazil. A randomized complete block design was used, with four replicates, and the treatments consisted of five doses of nitrogen topdressing. Plant dry matter, grain yield, and phenology were measured. The canola spectral response was evaluated by measuring the canola canopy reflectance using a spectroradiometer, and, with this data, the SR, NDVI, EVI, SAVI, and GNDVI vegetation indices were determined. Pearson’s correlations between the spectral and biophysical variables of canola showed that the red (620 to 670 nm) and near-infrared (841 to 876 nm) bands were the best to estimate the dry matter. The vegetative period is the most indicated to obtain the most significant correlations for canola. All the used vegetation indices are adequate for estimating the dry matter and grain yield of canola.
Index terms: Brassica napus,EVI, GNDVI, NDVI, SAVI, spectroradiometry.
Correlações entre dados espectrais e biofísicos em dossel
de canola cultivada na região subtropical do Brasil
Resumo – O objetivo deste trabalho foi a identificação das bandas espectrais, dos índices de vegetação e dos períodos do ciclo da canola em que a correlação entre os dados espectrais e os indicadores biofísicos (matéria seca total da parte aérea e rendimento de grãos) é mais significativa. Os experimentos foram conduzidos nas safras de 2013 e 2014, na Embrapa Trigo, no Estado do Rio Grande do Sul. Utilizou-se o delineamento experimental em blocos ao acaso, com quatro repetições, e os tratamentos foram cinco doses de nitrogênio em cobertura. Foram determinados a matéria seca das plantas, o rendimento de grãos e a fenologia. A resposta espectral da canola foi avaliada por medições de reflectância do dossel, com espectrorradiômetro, e, a partir desses dados, foram calculados os índices de vegetação SR, NDVI, EVI, SAVI e GNDVI. As correlações de Pearson entre as variáveis espectrais e biofísicas da canola mostraram que as melhores bandas para estimativa da matéria seca são as do vermelho (620 a 670 nm) e do infravermelho próximo (841 a 876 nm). O período vegetativo é o mais indicado para obtenção de correlações mais significativas para a canola. Todos os índices de vegetação utilizados são adequados para estimativas da matéria seca e do rendimento de grãos da canola. Termos para indexação: Brassica napus,EVI, GNDVI, NDVI, SAVI, espectrorradiometria.
Introduction
Research programs should focus on grain yield, since, from an economic viewpoint, it is the most important variable to the farmer because it determines the economic return of the crop.
Grain yield can be predicted by agrometeorological-spectral models in which the agrometeorological-spectral variable is usually represented by vegetation indices, considered remote indicators of vegetation vigor. Theses indices are proposed based on the antagonistic response of
the visible and near infrared due to the accumulation of biomass (Jensen, 2009). The higher the amount of
biomass, the lower the reflectance is in the visible region
due to the increased absorption by the photosynthetic pigments. In the near infrared, the increased biomass
causes the reflectance to increase due to increased multiple scattering and additive reflectance (Jensen,
2009; Ponzoni et al., 2012).
Agrometeorological-spectral models, with some variants in the selected terms and the type of adjusted equations, have been proposed in the literature (Rosa et al., 2010; Mabilana et al., 2012). Studies have been conducted in areas with climatic and management conditions similar to those of the present study for the following annual crops: soybean (Melo et al., 2008), irrigated rice (Klering et al., 2016), and wheat (Junges & Fontana, 2011). Despite the importance of grain yield studies, models to estimate canola grain yields
adjusted to the specific management and climate
conditions of the state of Rio Grande do Sul are not yet available in the literature.
Canola (Brassica napus L. var. oleifera) has become an interesting, feasible option as a winter cereal for crop rotation in southern Brazil. Also, its high oil content in the grains generates great liquidity in the market,
increasing crop demand and demand for specific
knowledge regarding the culture to meet production
bottlenecks and increase the crop productive efficiency
in the predominant subtropical climate conditions, in Rio Grande do Sul. Although the introduction of canola in Brazil is not recent, research on this culture
is still not very expressive, requiring efforts to increase
the basis of information and knowledge.
It may be assumed that models similar to those used for other annual crops can also be adjusted for canola. Therefore, basic studies to identify the most relevant variables that best relate to the biophysical variables of canola must be pursued since these must be the input variables in the models.
Thus, this study aimed to model grain yield of canola, focusing on the spectral component of the agrometeorological-spectral models. The objective was to identify the spectral bands, vegetation indices, and periods of the canola crop season in which the correlation between spectral data and biophysical indicators (total shoot dry matter and grain yield) is
most significant.
Materials and Methods
The experiments were conducted in the experimental
area of Embrapa Trigo (28º11'40"S, 52º10'20"W), in
the municipality of Coxilha, in the state of Rio Grande
do Sul, Brazil, during the 2013 and 2014 harvests. The
climate of the region is Cfa type, according to Köppen’s classification. The Hyola 61 canola cultivar was sown
and the study followed a randomized complete block design with four replicates. The treatments consisted
of five doses of nitrogen top dressing: 10, 20, 40, 80,
and 160 kg ha-1 N (urea, 45% nitrogen) to characterize
the different management conditions and increase
the variability of the crop’s spectral and biophysical
responses. The previous summer crops were soybean and bean in the 2013 and 2014 crop years, respectively.
Canola was sown spaced 0.34 m between rows and with minimum sowing density of 40 plants per square meter on April 22, 2013 and April 29, 2014.
From the emergence of the seedlings, two paired plants, representative of the plot, were collected biweekly to determine shoot dry matter. After collection, in the laboratory, the plants were separated
in leaves, branches, flowers and siliques, and then
placed in a forced air circulation oven for drying until constant mass at 70ºC. Also, plant phenology was recorded every four days. The new phenological stage
of the canopy/plot was defined as a stage at which at least 50% of the plants had entered that stage. Areas
of 1.02 and 6 m2 per plot were manually harvested and
threshed using a plot harvester (Wintersteiger, Nursery
model, Austria) to determine grain yield in the 2013 and 2014 harvests, respectively. After the threshing, the grains were packed in tagged paper containers, which were placed in a forced air circulation oven for drying to a constant mass at 70°C. After the grains were dried to a constant mass, they were sieved through for cleaning and weighed to determine dry matter and
grain yield (calculated at 8% humidity).
Canola spectral response was evaluated by
measuring canopy reflectance using a LI-1800 spectroradiometer (LI-COR, Lincoln, Nebraska,
USA) with 2 nm spectral resolution, between 350 nm and 1,100 nm, at 1 m above the top of the canopy. A barium sulfate plate (BaSO4) was used to simulate a
Lambertian surface of known reflectance as reference. Canopy reflectance was given as the ratio between the energy reflected by the canopy and by the reference
sky, cloud free days to ensure similar illumination and observation conditions, and always around noon to
maximize solar elevation in the area and season of the year. Reflectance per plot was measured on the seven
following dates: 7/15, 7/30, 8/15, 8/30, 9/13, 9/26, and 11/5 in 2013; and 5/20, 6/4, 7/15, 8/5, 8/19, 9/9, and 9/22
in 2014. Canopy reflectance data were used to calculate
the vegetation indices (Jensen, 2009): simple ratio
(SR), normalized difference vegetation index (NDVI), enhanced vegetation index (EVI), soil-adjusted vegetation index (SAVI), and green normalized difference vegetation index (GNDVI), as follows:
SR= ; NDVI= - + ;
EVI= G - L+ +C1
nir r nir r nir r
nir r nir
ρ ρ ρ ρ ρ ρ
ρ ρ ρ
(
) (
)
(
)
ρρ ρρ ρ ρ ρ
ρ
r b
nir r nir r
n
+C2 ;
SAVI= - + +L 1+L ; and
GNDVI=
(
)
(
) (
)
(
)
iir-ρg ρnir+ρg ;
(
) (
)
in which: ρnir, ρr, ρg,and ρb are the reflectances in the
near infrared (841 to 876 nm), red (620 to 670 nm), green (545 to 565 nm), and blue (459 to 479 nm), respectively; L is the constant that minimizes soil effect (L=1); G, gain factor (G=2.5); C1 and C2, the adjustment factors to correct for atmospheric aerosols (C1=6.5 and C2=7.5).
The spectral bands used to compute the vegetation indices were made compatible with the moderate resolution imaging spectroradiometer (Modis) sensor
band width and sensitivity by applying a filter function obtained from the spectral library of the ENVI 5.0 software (Exelis, 2016). Therefore, the reflectance data were multiplied by the filter function values for each
wavelength and, then, the band mean was calculated. This compatibilization aimed at allowing subsequent comparisons with orbital data.
The total shoot dry matter and grain yield data of canola were subjected to the analysis of variance, at
5% probability, while the model included the fixed effects of block, treatment, year, and treatment x year
interaction. The total shoot dry matter evaluations performed throughout 2013 and 2014 were considered as measures repeated in the time. The treatment means
were compared by Tukey’s test, at 5% probability.
The data obtained in the two harvests were treated as a single dataset separated into three crop cycles:
vegetative, flowering and maturation. Then, Pearson’s
correlations were established between: the shoot dry
matter accumulated and the reflectance in the blue,
green, red and near-infrared bands; total shoot dry matter and vegetation indices; and grain yield and
vegetation indices. The maximum vegetation index (maximum value obtained in the cycle) and the sum
of all vegetation indices (summation of the values obtained in the cycle) were correlated with grain yield.
Pearson correlations were tested by Student’s t-test, at 1% probability.
Results and Discussion
The different nitrogen treatments and the evaluations over two harvesting periods, with different
meteorological conditions, promoted the expected
variability of the crop biophysical indicators. Total
shoot dry matter and grain yield varied significantly,
which allowed correlation analyses.
The accumulated shoot dry matter was higher for all treatments in the 2013 crop year compared with 2014 (Table 1). The values of this biophysical indicator were
significantly different between the doses of topdressing
nitrogen fertilization treatments, and higher for the 160 kg ha-1 N in comparison with 10 and 20 kg ha-1
treatments for both harvests (Table 1).
Grain yield was also significantly higher in 2013
compared with 2014 crop year, which varied between 2,595.79 kg ha-1 (10 kg N ha-1) and 4,029.98 kg ha-1
(80 kg N ha-1) in 2013, and 1,129.81 kg ha-1 (10 kg N ha-1)
and 1,552.69 kg ha-1 (80 kg N ha-1) in 2014. The pattern
found is similar to the results found by Kaefer et al. (2014), who subjected canola plants to increasing doses of nitrogen fertilization and reported increased grain yield. The higher grain yield in the 2013 crop year was
expected, due to the differences observed in the shoot
dry matter between the two harvests.
higher air temperatures in 2014 accelerated the canola growth cycle, which resulted in lower growth and consequently lower accumulation of shoot dry matter (Pinto et al., 2017).
The spectroradiometer measurements also showed higher accumulated shoot dry matter in 2013, which displayed a different pattern throughout the electromagnetic spectrum. In the two harvests, the
reflectance (Figure 1) increased in the red, yellow and green bands from the vegetative period until flowering, and decreased during the grain filling period. On the contrary, in the blue band, the spectral reflectance decreased from the vegetative to the flowering period, and increased during grain filling. In the near infrared, the reflectance decreased steadily from the vegetative
period to the end of the cycle.
Despite the similar spectral reflectance patterns of the two harvests (Figure 1), the reflectance in
the red and yellow bands was lower in 2014, in
comparison with the reflectance in 2013, in the
flowering period, and the reflectance was higher in the vegetative and grain filling periods in 2014 in
comparison with 2013. In the vegetative and grain
filling periods, in 2013, canola had greater biomass
yield, which absorbed more radiation in the red and yellow bands for the photosynthesis processes,
compared with 2014. During the flowering periods, the reflectance increased less in 2014 than in 2013,
possibly indicating that in 2014 there were fewer
flowers in the canopy, which reflected more radiation
in the visible bands.
The higher shoot dry matter (Table 1) in 2013 resulted in higher vegetation indices compared with
2014 (Figure 2), as shown by the position of the box plots and the median values. This result was expected
since several studies have shown that vegetation indices are indicators of green vegetation activity (Jensen, 2009; Monteiro et al., 2012; Ponzoni et al., 2012). The
vegetation activity includes leaf area index (LAI),
green coverage, chlorophyll content, green biomass,
Table 1. Accumulated shoot dry matter (DM) (g m-2) and grain yield (kg ha-1) for the studied nitrogen topdressing doses
(urea, kg ha-1) applied to canola (Brassica napus) crop in the 2013 and 2014 harvests(1) in municipality of Coxilha, state of
Rio Grande do Sul, Brazil.
Harvest Nitrogen doses
10 20 40 80 160
2013 Total DM 1,070.89Ba 1,063.08Ba 1,147.33ABa 1,162.71ABa 1,241.32Aa Grain yield 2,595.79Ba 3,325.39ABa 3,054.66ABa 4,029.98Aa 3,091.52ABa
2014 Total DM 573.38Bb 543.91Bb 585.05ABb 670.45ABb 713.77Ab
Grain yield 1,129.81Bb 1,275.14ABb 1,401.51ABb 1,552.69Ab 1,461.96ABb
(1)Means followed by equal letters, uppercase in the rows and lowercase in the columns, do not differ by Tukey’s test, at 5% probability.
Figure 1. Spectral reflectance in the blue (ρ blue), green (ρ green), yellow (ρ yellow), red (ρ red), and near infrared (ρ near
infrared - NIR) bands for the three developmental stages of canola (Brassica napus): vegetative, flowering, and grain filling,
in the 2013 (A) and 2014 (B) harvests in municipality of Coxilha, state of Rio Grande do Sul, Brazil.
0.00 0.02 0.04 0.06 0.08 0.10 0.12
near infrared
0.35 0.40 0.45 0.50 0.55 0.60
Blue Green Yellow Red NIR
Vegetative Flowering Grain filling
blue,
green,
yellow
,
red
0.00 0.02 0.04 0.06 0.08 0.10 0.12
0.35 0.40 0.45 0.50 0.55 0.60
Vegetative Flowering Grain filling
and photosynthetically absorbed active radiation (Jensen, 2009). Furthermore, greater variability of the vegetation indices was also observed in 2014.
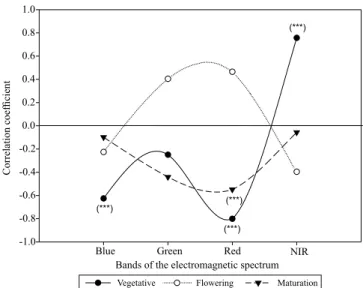
In the vegetative period, Pearson’s correlation coefficients (r) between the accumulated total shoot dry matter and the reflectance levels of the spectral bands analyzed (Figure 3) were negative and significant in
the blue (-0.63) and red (-0.80) bands, negative and
nonsignificant in the green (-0.25), and positive and significant in the near-infrared (0.76) ones.
The observed data pattern is consistent with the current knowledge on the interaction between solar radiation and the dense and green vegetative canopy. The higher the biomass in the canopy during the cycle, the lower the electromagnetic radiation (REM)
reflectance is in the visible bands, due to the greater
amount of photosynthesizing pigments absorbing the radiation to carry out photosynthesis (Ponzoni et al., 2012), which resulted in negative correlation
coefficients. The correlation coefficient was not significant in the green band because photosynthetic
pigments do not absorb the solar radiation in this
band, thus determining the reflectance peak in the green band in the typical vegetation reflectance curves
(Jensen, 2009). The opposite of the blue and red bands was observed in the near infrared, that is, the higher the biomass in the canopy, the greater the REM
reflectance was, which resulted in positive correlation coefficients. It is noteworthy that the red and near
infrared bands are widely used to calculate vegetation indices because they are the most well correlated
with green biomass. Monteiro et al. (2012) correlated the LAI with hyperspectral data in a bean crop and reported negative correlations between the LAI and the bands at the visible wavelengths, and positive bands at the near infrared wavelengths.
During flowering, the correlation coefficients were
negative in the blue (-0.23) and near infrared (-0.40) bands, and positive in the green (0.40) and red (0.46)
bands, but not statistically significant (Figure 3). Positive coefficients indicated that both reflectance and
shoot dry matter of canola increased as result of a large
amount of inflorescences in the canopy during canola flowering, which reflected part of the visible radiation, increasing this band reflectance. According to Thomas (2003), in the flowering peak, canola produces a layer of flowers about 30-cm thick, which can reflect
the visible electromagnetic radiation, reducing the amount of solar radiation that could be used by photosynthetically active plant structures of the plant.
In the near infrared, the correlation coefficient was negative, possibly due to the lower reflectance at these wavelengths, because the leaves were below the flower
layer, with less interaction with REM.
Reflectance and biomass were not correlated at maturation, and the correlation coefficients were
lower than the previous ones and were not statistically
significant (Figure 3). At this stage, reflectance and biomass are not expected to have good correlation coefficients, since the plants are in the grain filling
stage, with translocation of photoassimilates from the photosynthesizing organs (sources) to organs that
SR NDVI EVI SAVI GNDVI
0.0 0.2 0.4 0.6 0.8 1.0
SR
0 5 10 15 20 25
SR NDVI EVI SAVI GNDVI
NDVI, EVI, SA
VI, GNDVI
0.0 0.2 0.4 0.6 0.8 1.0
5 10 15 20 25
A B
Figure 2. Box plots of the normalized difference vegetation index (NDVI), enhanced vegetation index (EVI), soil adjusted
do not perform photosynthesis, the grains (drains) (Slewinski & Braun, 2010). The plants enter the senescence process during this stage, increasing the
variability of the relationship between incident and
reflected solar radiation.
Positive and statistically significant correlation
values were observed between all vegetation indices
(SR, NDVI, EVI, SAVI, and GNDVI) and shoot
dry matter of canola (Figure 4 A), in the vegetative
period. In contrast to it, the correlation coefficients were negative and not statistically significant for all vegetation indices during flowering. In the maturation period, correlation coefficients were again positive for all vegetation indices, but statistically significant only for the SR and NDVI indices.
The higher correlations between the vegetation indices and shoot dry matter in the vegetative period
were expected since, in this period, the plant biomass
in the canopy increases through the photosynthetic process, and the vegetation indices are known to be highly correlated with the chlorophyll content and
green biomass (Jensen, 2009). Negative correlation coefficients during flowering were due to the slightly
increased or even unchanged total plant biomass, and decreased vegetation indices. This decrease can be
attributed to the increased reflectance in the visible bands caused by the flowers, as already mentioned. During maturation, the correlation coefficients were
again positive, as both total biomass and vegetation
Figure 3. Pearson’s correlation coefficients between
the shoot dry matter of canola and the reflectance of electromagnetic radiation in the blue, green, red and near-infrared bands of the electromagnetic spectrum, in the following developmental stages: vegetative, flowering, and maturation – harvests of 2013 and 2014, in the municipality of Coxilha, in the state of Rio Grande do Sul, Brazil. ***Significant at 1% probability.
Stages
Correlation coef
ficient
-0.8 -0.6 -0.4 -0.2 0.0 0.2 0.4 0.6 0.8 1.0
SR NDVI EVI SAVI GNDVI
SR NDVI EVI SAVI GNDVI
0.0 0.2 0.4 0.6 0.8 1.0
Sum Maximum
A B
Vegetative Flowering Maturation
Index
Figure 4. Pearson’s correlation coefficients between canola (Brassica napus) total dry matter and the vegetation indices
indices decreased. However, the coefficients were lower than those in the vegetative period. The flower
petals usually fall during maturation, but interception and absorption of photosynthetically active radiation (PAR) by siliques and stems may continue. Fochesatto
et al. (2016) evaluated the interception efficiency of
PAR by canola reproductive structures and stems for
five nitrogen doses (10, 20, 40, 80, and 160 kg ha-1 N)
and reported that the efficiency of PAR interception
by the reproductive structures and stems of the canola
canopy can reach 70% of the total canopy interception
in the plots treated with 160 kg ha-1 N.
Therefore, intrinsic characteristics of the canola
crop, such as the intense flowering and the existence of
photosynthesizing structures besides the leaves, make the interaction between the crop and solar radiation, as
well as its detection by remote sensors, very specific.
These characteristics are important and should be taken into account both for the differentiation of other crops and for the construction of grain yield estimation models.
The grain yield and vegetation indices had positive
correlation coefficients for both analyzed parameters (the maximum value of vegetation index during the
cycle and the sum of all vegetation indices in the
same period) (Figure 4 B). However, the correlation coefficients between grain yield and the sum of all
vegetation indices in the cycle were similar and
statistically significant for all vegetation indices, and higher than the correlation coefficients of grain yield with the maximum vegetation index, which were not statistically significant. This pattern is consistent
because the sum of all vegetation indices is related to the development of biomass during the development cycle. Despite being related to higher biomass
accumulation, the maximum vegetation index is
limited by the saturation of vegetation indices, more
evident in some indices such as NDVI in high biomass
values (Risso et al., 2012).
The vegetation indices, expressed from parameters derived from reflectance curves – the maximum vegetation index during the cycle and the sum of all
vegetation indices in the same period –, have been
widely used, especially in the context of grain yield
modeling. Junges (2011) found positive correlations
between the maximum and the integrated NDVI, for
wheat grain yield in Rio Grande do Sul. Similarly, Rodrigues et al. (2013) associated vegetation indices
and absorption of atmospheric CO2, which is useful in
the context of climate change discussions.
There is, therefore, a correlation between the spectral data (vegetation indices) and the biophysical
data of the canola (which reflect plant biomass growth),
allowing the use of these spectral data to feed spectral or agrometeorological-spectral models of grain yield and biomass increase.
Conclusions
1. The most indicated spectral bands to obtain the
most significant correlations for canola (Brassica napus) are the red and near-infrared, while the vegetative cycle is the most appropriate phenological stage, under subtropical climate conditions.
2. The vegetation indices SR, NDVI, EVI, SAVI, and GNDVI are appropriate to represent the total shoot
dry matter and the grain yield of canola.
3. The best results for grain yield estimation using vegetation indices are obtained by summing all the
index values recorded during the canola cycle.
Acknowledgments
To Universidade Federal do Rio Grande do Sul
(UFRGS), to Embrapa Trigo, and to Conselho Nacional de Desenvolvimento Científico e Tecnológico (CNPq),
for the support provided.
References
DALMAGO, G.A.; CUNHA, G.R. da; TOMM, G.O.; SANTI, A.; PIRES, J.L.F. Canola. In: MONTEIRO, J.E.B.A. (Org.).
Agrometeorologia dos cultivos: o fator meteorológico na
produção agrícola. Brasília: INMET, 2009. p.131-150.
EXELIS. Spectral Library Viewer. Available at: <http://www.
exelisvis.com/docs/SpectralLibBrowser.html>. Accessed on: Apr.
24 2016.
FOCHESATTO, E.; NIED, A.H.; BERGAMASCHI, H.; DALMAGO, G.A.; PINTO, D.G.; KOVALESKI, S.; CUNHA, G.R. da; GOUVEA, J.A. Interception of solar radiation by the
productive structures of spring canola hybrids. Ciência Rural, v.46, p.1790-1796, 2016. DOI: 10.1590/0103-8478cr20151571.
JENSEN, J.R. Sensoriamento remoto do ambiente: uma
perspectiva em recursos terrestres. 2.ed. São José dos Campos: Parêntese, 2009. 598p.
JUNGES, A.H.; FONTANA, D.C. Modelo agrometeorológico-espectral de estimativa de rendimento de grãos de trigo no Rio
KAEFER, J.E.; GUIMARÃES, V.F.; RICHART, A.; TOMM, G.O.; MÜLLER, A.L. Produtividade de grãos e componentes de produção da canola de acordo com fontes e doses de nitrogênio.
Pesquisa Agropecuária Brasileira, v.49, p.273-280, 2014. DOI:
10.1590/S0100-204X2014000400005.
KLERING, E.V.; FONTANA, D.C.; ROGLIO, V.S.; ALVES, R. de C.M.; BERLATO, M.A. Modelo agrometeorológico-espectral para estimativa da produtividade de grãos de arroz irrigado no
Rio Grande do Sul. Bragantia, v.75, p.247-256, 2016. DOI: 10.1590/1678-4499.287.
MABILANA, H.A.; FONTANA, D.C.; FONSECA, E.L. da. Desenvolvimento de modelo agrometeorológico espectral para
estimativa de rendimento do milho na Província de Manica -
Moçambique. Revista Ceres, v.59, p.337-349, 2012. DOI: 10.1590/
S0034-737X2012000300007.
MELO, R.W. de; FONTANA, D.C.; BERLATO, M.A.; DUCATI,
J.R. An agrometeorological-spectral model to estimate soybean yield, applied to southern Brazil. International
Journal of Remote Sensing, v.29, p.4013-4028, 2008. DOI:
10.1080/01431160701881905.
MONTEIRO, P.F.C.; ANGULO FILHO, R.; XAVIER, A.C.; MONTEIRO, R.O.C. Assessing biophysical variable
parameters of bean crop with hyperspectral measurements.
Scientia Agricola, v.69, p.87-94, 2012. DOI:
10.1590/S0103-90162012000200001.
PINTO, D.G.; FONTANA, D.C.; DALMAGO, G.A.; CUNHA, G.R. da; FOCHESATO, E.; VICARI, M.B.; GOUVÊA, J.A. de; SANTI, A. Temporal dynamics of spectral reflectance and
vegetation indices during the canola crop cycle in southern
Brazil. Ciência Rural, v.47, e20151403, 2017. DOI: 10.1590/0103-8478cr20151403.
PONZONI, F.J.; SHIMABUKURO, Y.E.; KUPLICH, T.M.
Sensoriamento remoto da vegetação. 2.ed. atual e ampl.
Cubatão: Oficina de Textos, 2012. 160p.
RAPACZ, M. Frost resistance and cold acclimation abilities of
spring-type oilseed rape. Plant Science, v.147, p.55-64, 1999. DOI: 10.1016/S0168-9452(99)00098-9.
RISSO, J.; RIZZI, R.; RUDORFF, B.F.T.; ADAMI, M.; SHIMABUKURO, Y.E.; FORMAGGIO, A.R.; EPIPHANIO, R.D.V. Índices de vegetação Modis aplicados na discriminação
de áreas de soja. Pesquisa Agropecuária Brasileira,v.47, p.1317-1326, 2012. DOI: 10.1590/S0100-204X2012000900017.
RODRIGUES, C.P.; FONTANA, D.C.; MORAES, O.L.L. de;
ROBERTI, D.R. NDVI e fluxo de CO2 em lavouras de soja no Rio
Grande do Sul. Revista Brasileira de Meteorologia, v.28, p.95-104, 2013. DOI: 10.1590/S0102-77862013000100011.
ROSA, V.G.C. da; MOREIRA, M.A.; RUDORFF, B.F.T.; ADAMI, M. Estimativa da produtividade de café com base em um
modelo agrometeorológico-espectral. Pesquisa Agropecuária
Brasileira, v.45, p.1478-1488, 2010. DOI:
10.1590/S0100-204X2010001200020.
SLEWINSKI, T.L.; BRAUN, D.M. Current perspectives on the
regulation of whole-plant carbohydrate partitioning. Plant Science, v.178, p.341-349, 2010. DOI: 10.1016/j.plantsci.2010.01.010.
THOMAS, P. Canola: grower’s manual. Winnipeg: Canola Council
of Canada, 2003. Available at:
<http://www.canolacouncil.org/crop- production/canola-grower’s-manual-contents/chapter-2-canola-varieties/canola-varieties#brassica>. Accessed on: Aug. 5 2013.