Curva de absorção de micronutrientes na cultura do girassol
Luiz Henrique Saes Zobiole1, César de Castro2, Fábio Alvares de Oliveira2,
Adilson de Oliveira Júnior2, Adônis Moreira3
ABSTRACT
Most studies in the literature regarding the uptake of micronutrients [zinc (Zn), manganese (Mn), iron (Fe), copper (Cu) and boron (B) accumulation] by sunflower are old. For this reason, this work is aimed to establish curves of sunflower micronutrient accumulation in tropical edaphoclimatic conditions. The experiment was conducted in field on Rhodic Eutrudox, located at the experimental farm of Embrapa Soja in Londrina-PR, using the commercial hybrid BRS 191. The experimental design was completely randomized, with four replicates. The experimental units consisted of 14 lines with a spacing of 0.70 meter between lines and 25.0 meters in length, with final density of 42,858 plants per hectare. Plants samples were collected every 14 days after emergence. After each collection, plants were divided into petiole, leaf, stem, capitulum and achenes. They were dried until reaching constant weight. Then, dry matter was weighed and the concentrations of Zn, Mn, Fe, Cu, and B were determined in the vegetal tissue. Micronutrient uptake occurred faster in the phase initiated 42 days after emergence (DAE). Iron was the most absorbed micronutrient, accumulating higher amounts in the achenes as well as in relation to the total absorbed. Fe, Mn, Zn, B and Cu concentrations were 38.06, 19.68, 9.20, 8,62 and 4.27 mg plant-1, respectively.
Index terms:Helianthus annuus, nutrient uptake rate, micronutrients, mineral nutrition.
RESUMO
Devido ao fato de a maioria dos trabalhos encontrados na literatura a respeito do acúmulo dos micronutrientes [zinco (Zn), manganês (Mn), ferro (Fe), cobre (Cu) e boro (B)] no girassol serem antigos, objetiva-se, com este trabalho estabelecer curvas de acúmulo de micronutrientes em um híbrido de girassol na condição edafoclimática dos trópicos. O experimento foi instalado no campo sobre Latossolo Vermelho distroférrico de textura argilosa, localizado na fazenda experimental da Embrapa Soja, em Londrina-PR, utilizando o híbrido comercial BRS 191. O delineamento experimental utilizado foi o inteiramente casualizado, com quatro repetições. As unidades experimentais foram constituídas de 14 linhas, com espaçamento de 0,70 m entre linhas e 25 m de comprimento, com densidade final de 42.858 plantas ha-1. As amostras das plantas foram coletadas em intervalos de 14 dias após a emergência. Após cada
coleta, dividiram-se as plantas em pecíolo, folha, caule, capítulo e aquênios, sendo que as mesmas foram secas até peso constante, quando foram tomados os pesos da matéria seca e determinados os teores de Zn, Mn, Fe, Cu e B no tecido vegetal. A absorção de micronutrientes ocorreu em maior velocidade a partir dos 42 dias após a emergência (DAE). O Fe foi o micronutriente mais absorvido, acumulando maior quantidade tanto nos aquênios como em relação ao total absorvido. O acúmulo total de Fe, Mn, Zn, B e Cu foram 38,06, 19,68, 9,20, 8,62 e 4,27 mg planta-1, respectivamente.
Termos para indexação:Helianthus annuus, marcha de absorção, micronutrientes, nutrição mineral.
(Received in august 3, 2009 and approved in September 24, 2010) INTRODUCTION
Sunflower has a wide suitability in Brazilian edaphoclimatic conditions due to its tolerance to low temperatures on its initial phase of development and also moderate resistance to drought, which makes it possible to be cultivated from South to North of Brazil (Castro et al., 1996; Castro & Farias, 2005).
As most areas are concentrated in the Cerrado, which is a”savanna-like” region, localized in central Brazil (Companhia Nacional de Abastecimento - Conab, 2008), it is important to know the behavior of this crop in current conditions because several factors influence nutrient
uptake, among them the exploration capacity of the root system, edaphoclimatic conditions, soil properties and water and nutrient availability. The nutritional demand is variable with the sunflower development cycle. However, in a general way, for macronutrients as well as for micronutrients, it follows the accumulation rate of dry matter during the vegetative stage until the end of flowering (Gachon, 1972; Sfredo, 1984; Castro & Oliveira, 2005).
It is relevant to know how the uptake of nutrients occurs during the periods of the plant vegetative cycle (Sfredo et al., 1984). In relation to micronutrients, such data are even less known with the exception of boron (B),
1Universidade Estadual de Maringá/UEM – Avenida Colombo – 5790 – 87020-900 – Maringá-PR – lhzobiole@uol.com.br 2Empresa Brasileira de Pesquisa Agropecuária/Embrapa Soja/CNPSO – Londrina, PR
which has been given relatively more importance when considering this crop mainly because of the fact that deficiencies of this nutrient have caused more problems in sunflower crop (Castro, 1996).
In general, the most limiting micronutrient to sunflower crop is B, which deficiency may cause slight or imperceptible symptoms (hidden hunger) to total loss of production by the fall of the capitulum. However, the occurrence of visual symptoms and nutritional problems associated to other nutrients, such as Cu, Fe, Mn and Zn in crop conditions are not frequent considering that sunflower is generally cultivated in soils with adequate fertility for soybeans or corn crops (Castro & Oliveira, 2005).
Due to the fact that many works found in literature about micronutrients (B, Cu, Fe, Mn and Zn) concentrations in sunflower are old, this work is aimed at establishing curves of micronutrients accumulation in a sunflower hybrid in Brazilian current environmental conditions.
MATERIAL AND METHODS
The experiment was carried out in field conditions from 10/09/2001 to 20/01/2002 in Rhodic Eutrudox with clay texture in the experimental area of Embrapa Soybean, Londrina, Paraná State, Brazil, at coordinates 23o23’S,
51o11’W.
The BRS 191 hybrid of sunflower with early cycle was planted on 03/10/2001. The chemical analysis (Empresa Brasileira de Pesquisa Agropecuária - Embrapa, 1997) of the soil is presented in Table 1. The cultivation system adopted was regular tillage. In sowing, fertilization was done by throwing before plowing and was constituted of 300 kg ha-1 of the 05-20-20 formula (N, P
2O5 and K2O). Two
surface applications were carried out. The first one was applied at 21 days after sowing using 25 kg ha-1 of N
plus 1 kg ha-1 of B (source urea – 44% of N and boric
acid – 18% of B), and the second at 35 days after sowing with the same rate of N and B applied at the first one.
The experimental design used was completely randomized, with four replicates. The experimental units were constituted of 14 lines with 0.70 meters among lines and 25.0 meters in length, with final density of 42,858 plants per hectare.
Plants samples were collected every 14 days after emergence. After each collection, plants were divided into petiole, leaf, stalk, capitulum and achenes. The leaves were washed with deionized water, were dried in a ventilated oven at ± 65o C until they reached constant
weight and digested to obtain nitric-perchloric extracts. Cu, Fe, Mn and Zn concentrations were determined by spectrometry of atomic absorption while total B by dry-ashing digestion in a muffle furnace in 500o C for 1.5 h
determined by colorimeter of Azometin H (Malavolta et al., 1997).
According to the design proposed, data errors were tested through Levene and Shapiro-Wilks (p 0.05) with the aim of evaluating their variance and normality. In the regression analyzes, the most significant equations were chosen in the SigmaPlot 10.0 program. The best adjusted model adopted was the one of Gaussian in which:
All data were submitted to variance analysis (ANOVA) at 5% probability through SAS program.
RESULTS AND DISCUSSION
The beginning of the flowering period (R.4/R.5) occurred at 56 days after emergence (DAE). Therefore, the sampling for leaf diagnosis was carried out in the beginning of flowering as described by Blamey et al. (1997). The results of micronutrients concentrations on sunflower leaf tissue obtained in the start of flowering (Table 2) in which it is possible to consider these limits sufficient to a good development of sunflower plants by Sfredo et al. (1984) and Castro & Oliveira (2005).
The values obtained in this study show that they are in agreement with those obtained by Sfredo et al. (1984) and Castro & Oliveira (2005), with exception to Fe in which the content presented was higher to those of the other authors. This is probably due to the fact that the place where the experiment was carried out has clay texture and is originated from basaltic material presenting in its genesis high iron content, which led to a higher absorption of this element by the sunflower plant.
y = ae[-0,5(x-x
0/b)2]
Table 1 – Chemical properties of the Rhodic Eutrudox collected on the plow layer (0-20 cm) at Embrapa Soja (Londrina-PR).
(1)Walkley & Black. (2)Mehlich 1. (3)KCI 1,0 mol L-1. (4)Ca(CH3COO)2.H2O 0,5 mol L-1.
pH C P(2) K(2) Ca(3) Mg(3) Al(3) H+Al(4) SB T V
CaCl2 g dm-3(1) --- cmolc dm-3--- --- % --
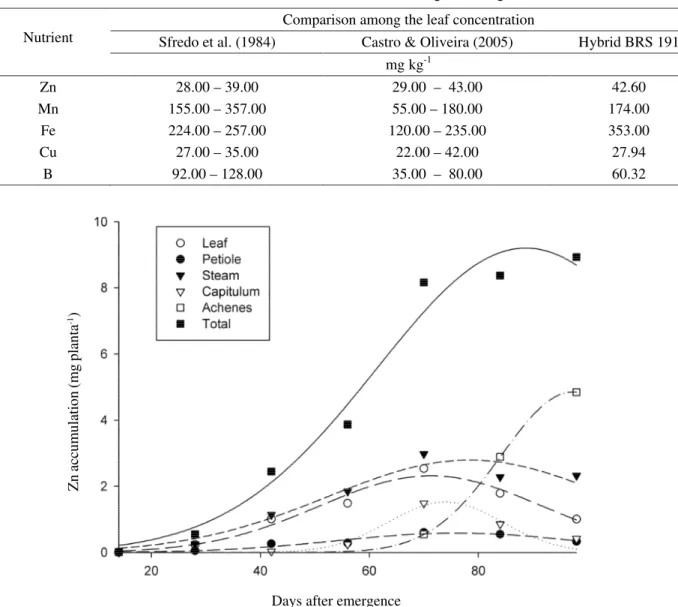
It is possible to observe that up to 28 DAE Zn accumulation was low, mainly because of the low development of the plant which was at V.14. From this period on, the speed of Zn accumulation increased rapidly with higher accumulation at 89 DAE at R.7 (Figure 1), with maximum point of 9.2 mg plant-1 of Zn (Table 3). In the
diagnostic leaf, the concentration was 42.6 mg kg-1, value
considered adequate (Table 2)
It is noticeable that there was an intense Zn translocation from the leaf, stem and capitulum to achenes formation and, in the same way as for Sfredo & Sarruge (1990), the highest accumulations occurred in
the stem and achenes. In the achenes, such accumulation happened at 97 DAE (R.9), with 4.85 mg plant-1 of Zn representing an exportation of 52% of all
Zn absorbed by the plant, differing from that shown by Sfredo (1984) which obtained 30% of exportation by the achenes.
The maximum total Mn accumulation occurred at 81 DAE (Figure 2) presenting 19.68 mg plant-1 of Mn (Table 4),
and one of the organs responsible for such concentration was the leaves followed by the stalk with maximum point for leaves at 77 DAE, accumulating 9.80 mg plant-1 of Mn. Sfredo & Sarruge (1990) also obtained
Table 2 – Micronutrient concentration in sunflower leaf tissue at the R5 growth stage.
Figure 1 – Zinc accumulation (mg plant-1) in different plant parts during the crop growth.
Days after emergence
Z
n
ac
cu
m
ul
at
io
n
(m
g
pl
an
ta
-1)
Comparison among the leaf concentration
Sfredo et al. (1984) Castro & Oliveira (2005) Hybrid BRS 191 Nutrient
mg kg-1
Zn 28.00 – 39.00 29.00 – 43.00 42.60
Mn 155.00 – 357.00 55.00 – 180.00 174.00
Fe 224.00 – 257.00 120.00 – 235.00 353.00
Cu 27.00 – 35.00 22.00 – 42.00 27.94
a maximum at 80 DAE and only 8% of the manganese absorbed was exported through the harvest.
Regarding Fe, it was the most absorbed element by the plant presenting maximum accumulation at 78 DAE (Figure 3) with a total of 38.06 mg Fe/plant (Table 5). Analyzing the several parts of the plants separately, the leaf was the organ with most importance in absorption with maximum point of 21.07 mg Fe plant-1 absorbed at 69
DAE. The exportation through achenes represented 16% of the total Fe absorbed. Sfredo & Sarruge (1990) also
observed that in tropical conditions, the Fe is the most taken up element. However, it only presented 7.0% of exportation through harvest. Sfredo et al. (1984) say that due to the amounts absorbed, Fe and Mn can show deficiency problems when excessive limestone quantities are applied, which may cause immobilization of these nutrients (Malavolta, 2006; Fageria, 2009).
Copper accumulation in the plant occurred in higher amount in the leaves at 73 DAE (Figure 4) with maximum point of 1.84 mg plant-1 of Cu (Table 6). This nutrient
Figure 2 – Manganese accumulation (mg plant-1) in different plant parts during the crop growth.
Table 3 – Maximum points with respective regression analyses and coefficient of determination (R2)*.
(1)leaf+petiole+steam+capitulum+achenes *P<0.01).
Days after emergence
M
n
ac
cu
m
ul
at
io
n
(m
g
pl
an
ta
-1)
Variables Maximum point (mg plant-1) Equation R2
Zinc Total(1) 9.20 9.20*exp(-0.5*((x-88.69)/27.25)2) 0.989
Zinc Leaf 2.31 2.32*exp(-0.5*((x-71.23)/20.39)2) 0.981
Zinc Petiole 0.58 0.58*exp(-0.5*((x-75.93)/21.95)2) 0.967
Zinc Steam 2.79 2.79*exp(-0.5*((x-78.36)/25.95)2) 0.972
Zinc Capitulum 1.52 1.52*exp(-0.5*((x-73.96)/10.38)2) 0.954
exportation through achenes was relatively high in relation to the total absorbed by the plant (4.27 mg plant-1 of Cu)
which is equivalent to 36%, differently from Sfredo & Sarruge (1990) who observed a 22% exportation rate of copper by achenes. Also, these same authors verified a maximum accumulation for leaves and stalks at 80 DAE. For this study, the leaves presented maximum accumulation at 73 DAE and the stalk at 81 DAE.
Boron, which usually presents higher nutritional deficiency in field (Blamey et al., 1987), presented sufficient
Figure 3 – Iron accumulation (mg plant-1) in different plant parts during the crop growth.
levels (60.3 mg kg-1) for a great development of the crop in
this study, according to Castro & Oliveira (2005). However, Sfredo et al. (1984) considered that the minimum concentration in the leaf should be 92 mg kg-1, which would
be theoretically low (Table 2). On the other hand, Blamey (1977) established that sufficient levels for boron in the leaves should be 47 mg kg-1, which would be above the
optimum level in this case.
Similarly to the other micronutrients, B accumulation in the sunflower plants was low until 28 DAE Table 4 – Maximum points with respective regression analyses and coefficient of determination (R2)*.
(1)leaf+petiole+steam+capitulum+achenes *P<0.01).
Days after emergence
F
e
ac
cu
m
ul
at
io
n
(m
g
pl
an
ta
-1)
Variables Maximum point (mg plant-1) Equation R2
Manganese Total(1) 19.68 19.68*exp(-0.5*((x-80.90)/21.96)2) 0.996
Manganese Leaf 9.80 9.80*exp(-0.5*((x-77.58)/23.22)2) 0.997
Manganese Petiole 1.93 1.93*exp(-0.5*((x-77.01)/19.48)2) 0.982
Manganese Steam 3.97 3.97*exp(-0.5*((x-79.20)/20.41)2) 0.993
Manganese Capitulum 2.96 2,96*exp(-0.5*((x-80.34)/15.03)2) 0.961
due to the lower development of the plants. From this period on, the speed of B accumulation increased rapidly presenting a higher accumulation at 80 DAE at R.7 (Figure 5), with maximum point of 8.62 mg plant-1 (Table 7).
It is possible to observe that, after B maximum accumulation in the leaf at 69 DAE, there was an
accentuated decrease of contents in this organ, showing an intense translocation of this element to the other organs such as the achene which presented maximum accumulation at 95 DAE with mg plant-1 of B and
exportation of approximately 18% of the total boron through harvest.
Figure 4 – Copper accumulation (mg plant-1) in different plant parts during the crop growth.
Table 5 – Maximum points with respective regression analyses and coefficient of determination (R2)*.
(1)leaf+petiole+steam+capitulum+achenes *P<0.01).
Days after emergence
C
u
ac
cu
m
ul
at
io
n
(m
g
pl
an
ta
-1)
Variables Maximum point (mg plant-1) Equation R2
Iron Total(1) 38.06 38.06*exp(-0.5*((x-77.91)/23.93)2) 0.967
Iron Leaf 21.07 2.07*exp(-0.5*((x-69.04/19.7)2) 0.979
Iron Petiole 2.82 2.82*exp(-0.5*((x-65.51)/19.15)2) 0.988
Iron Steam 9.17 9.17*exp(-0.5*((x-79.78)/24.16)2) 0.939
Iron Capitulum 6.08 6.08*exp(-0.5*((x-95.01)/21.67)2) 0.953
Table 6 – Maximum points with respective regression analyses and coefficient of determination (R2)*.
(1)leaf+petiole+steam+capitulum+achenes *P<0.01).
Figure 5 – Boron accumulation (mg plant-1) in different plant parts during the crop growth.
Table 7 – Maximum points with respective regression analyses and coefficient of determination (R2)*.
(1)leaf+petiole+steam+capitulum+achenes *P<0.01).
Days after emergence
B
ac
cu
m
ul
at
io
n
(m
g
pl
an
ta
-1)
Variables Maximum point (mg plant-1) Equation R2
Copper Total(1) 4.27 4.27*exp(-0.5*((x-84.16)/22.48)2) 0.987
Copper Leaf 1.84 1.84*exp(-0.5*((x-72.77)/17.14)2) 0.964
Copper Petiole 0.13 0.13*exp(-0.5*((x-70.09)/22.30)2) 0.961
Copper Steam 1.00 1.00*exp(-0.5*((x-81.16)/22.74)2) 0.993
Copper Capitulum 0.70 0.70*exp(-0.5*((x-83.92)/16.81)2) 0.962
Copper Achenes 1.56 1.56*exp(-0.5*((x-96.95)/13.02)2) 0.999
Variables Maximum point (mg plant-1) Equation R2
Boron Total(1) 8.62 8.62*exp(-0.5*((x-80.39)/20.48)2) 0.994
Boron Leaf 2.54 2.54*exp(-0.5*((x-69.76)/19.60)2) 0.996
Boron Petiole 0.49 0.49*exp(-0.5*((x-73.91)/21.08)2) 0.981
Boron Steam 3.07 3.07*exp(-0.5*((x-76.81)/18.04)2) 0.963
Boron Capitulum 2.25 2.25*exp(-0.5*((x-85.43)/14.67)2) 0.999
CONCLUSIONS
The micronutrients (B, Cu, Fe, Mn and Zn) uptake occurred faster in the period starting at 42 days after emergence (DAE).
Independently of the growth stage, micronutrients were absorbed in relatively high quantities by the sunflower crop.
The extraction order was the following: Fe > Mn > Zn > B > Cu and the exportation through achenes was: Fe > Zn > Mn > B > Cu.
REFERENCES
BLAMEY, F.P.C. Boron nutrition of sunflower
(Helianthus annuss L.) on Avalon medium Sandy loam.
Agrochemophysica, Pretoria, v.8, p.5-10, 1976.
BLAMEY, F.P.C.; EDWARDS, D.G.; ASHER, C.J. Nutritional disorders of sunflower. Queensland: University of Queensland, 1987. 72p.
BLAMEY, F.P.C.; ZOLLINGER, R.K.; SCNEITER, A.A. Sunflower production and culture. In: SCNEITER, A.A. Sunflower science and technology. Madison: American Society of Agronomy, 1997. p.595-670.
CASTRO, C.; CASTIGLIONI, V.B.R.; BALLA, A.; LEITE, R.M.V.B.C.; MELLO, H.C.; GUEDES, L.C.A.; FARIAS, J.R. A cultura do girassol. Londrina: Embrapa Soja, 1996. 38p.
CASTRO, C.; FARIAS, J.R.B. Ecofisiologia do girassol. In: LEITE, R.M.V.B.C.; BRIGHENTI, A.M.; CASTRO, C. (Eds.). Girassol no Brasil. Londrina: Embrapa Soja, 2005. p.64-218.
CASTRO, C.; OLIVEIRA, F.A. Nutrição e adubação do girassol. In: LEITE, R.M.V.B.C.; BRIGHENTI, A.M.; CASTRO, C. (Eds.). Girassol no Brasil. Londrina: Embrapa Soja, 2005. p.317-373.
COMPANHIA NACIONAL DE ABASTECIMENTO. Sexto levantamento: safra 2004/2005. Disponível em: <http://www.conab.gov.br>. Acesso em: 17 jul. 2008. EMPRESA BRASILEIRA DE PESQUISA
AGROPECUÁRIA. Manual de métodos de análise de solo. Rio de Janeiro: CNPS/Embrapa, 1997. 212p. FAGERIA, N. K. The use of nutrients in crops plants. Boca Raton: CRC, 2009. 430p.
GACHON, L. La cinétique de l’absorption dês éléments nutritifs majeurs chez Le tournesol. Annales
Agrononmie, Paris, v.23, p.547-566, 1972.
MALAVOLTA, E. Manual de nutrição mineral de plantas. Piracicaba: Agronômica Ceres, 2006. 631p. MALAVOLTA, E.; VITTI, G.C.; OLIVEIRA, S.A.
Avaliação do estado nutricional das plantas: princípios e aplicações. Piracicaba: Potafos, 1997. 319p.