Vol.54, n. 3: pp. 559-568, May-June 2011
ISSN 1516-8913 Printed in Brazil BRAZILIAN ARCHIVES OF
BIOLOGY AND TECHNOLOGY
A N I N T E R N A T I O N A L J O U R N A L
Biochemical Characterisation of a Glucoamylase from
Aspergillus niger
Produced by Solid-State Fermentation
Christiane Trevisan Slivinski
1,
Alex Vinicius Lopes Machado
1, Jorge Iulek
2, Ricardo
Antônio Ayub
3and Mareci Mendes de Almeida
1*1Departamento de Engenharia de Alimentos; Centro de Ciência e Tecnologia de Alimentos; Universidade Estadual
de Ponta Grossa; Ponta Grossa - PR - Brasil. 2Departamento de Química; Centro de Biotecnologia; Universidade Estadual de Ponta Grossa; Ponta Grossa - PR - Brasil. 3Departamento de Fitotecnia e Fitossanidade; Centro de Biotecnologia; Universidade Estadual de Ponta Grossa; Av. Gal. Carlos Cavalcanti, 4748; 84030-000; Ponta Grossa - PR - Brasil
ABSTRACT
In this work, glucoamylase was produced by Aspergillus niger in solid-state fermentation. The enzyme was partially purified by ammonium sulphate precipitation and ion exchange and gel filtration chromatographies. Its molecular mass was estimated as 118.17 kDa by electrophoresis. The partially purified enzyme had an optimum pH range of 4.5-5.0 and an optimum temperature of 60 °C, with average activity 152.85 U mL-1. Thermal and pH stability assays with the crude extract showed that more than 60 % of the activity remained at pH 4.6 and 60 °C, even after an exposition to these conditions longer than 24 h. Yet, after purification, the enzyme was stable at these for at least 4 h, which indicated that its purification for use in starch saccharification was inadvisable. KM and Vmax were 0.34 mg
mL-1 and 160.22 U mL-1, respectively.
Key words: glucoamylase, Aspergillus niger, solid-state fermentation, biochemical characterization, purification
*Author for correspondence: [email protected]
INTRODUCTION
Fermentation processes can be accomplished by bacteria, fungi or yeast, and the choices depend upon the desired product. For enzyme production, there is a preference towards the usage of filamentous fungi because they present a better capability to secret high protein levels in the culture media (Gouka et al., 1997), either solid or submerged (Koutinas et al., 2003). A suitable substrate determination is extremely important for the process feasibility and the substrate must be cheap (Couto and Sanromán, 2006).
The amylolytic enzymes play an important role in the food industry and many industrial processes involving starch require these enzymes for the hydrolysis. The hydrolysis occurs at high temperatures and involves two steps, liquefaction and saccharification, for which the pH and the temperature must be well determined to avoid the undesirable by-products (Buchholz and Seibel, 2008).
thus promoting an almost complete starch hydrolysis into glucose (Selvakumar et al., 1996). Its main application is on the production of syrups with 96-98 % of glucose (Aiyer, 2005; Guzmán-Maldonado and Paredes-Lópes, 1995). The glucoamylase is added to the starch paste at the saccharifying step when it is around 60 ºC, thus the enzyme must be stable at this temperature for a long time. The hydrolyzates can be used as carbon source in fermentations; in other cases, they can be part of the final product, such as in soft drinks, ice-creams, sauces, tinned fruits, breads, etc. (Aiyer, 2005). Most of the industrially used glucoamylases are produced by Aspergillus and Rhizopus genus lineages; the one from the former is the most thermostable (Norouzian et al., 2006).
The goals of this work were to partially purify and to characterize biochemically the glucoamylase
from Aspergillus niger produced in
solid-statefermentation using a potato processing residue as substrate.
MATERIALS AND METHODS
Microorganisms
A culture of Aspergillus niger NRRL 330 lineage grown in acidified potato dextrose agar (PDA) and stored at 4 ºC was used in this work.
Culture medium, inoculum preparation and fermentation conditions
Potato processing residue was used as the substrate for the fungus growth; 50 g, without any supplementation, were poured into 250 mL Erlenmeyer flasks, the humidity was adjusted to 85 % (w/w) and then autoclaved at 121 ºC for 15 min. Analyses of the medium thus prepared showed that it contained, in g 100 mL-1: starch, 12.56; reducing sugars, 0.21; glucose, 0.00.; proteins, 1.30; lipids, 0.04; fibers, 0.43; ashes, 0.56; phosphorous, 0.02; nitrogen, 0.21, at pH 5.1. One mililiter of spore suspension at 107 ufc mL-1 (Spier et al., 2006) was added to each flask and then fermented at 32 ºC for 48 h without stirring. After fermentation, 25 mL of acetate buffer (0.1 mol L-1, pH 4.6) was added to each flask, followed by trituration with a glass rod. The flasks were then stirred in a shaker (New Brunswick Scientific, Edison, NJ - USA, C25KC) at 150 rpm and 15 °C for 1 h, followed by centrifugation at 12,500 × g and 4 °C for 15 min (Himac CR21G,
Hitachi Koki, Tokyo, Japan). Finally, the supernatant, hereafter considered the crude extract, was filtered through paper (Whatman no 1) and stored at 4 °C.
Enzymatic assay
The method described by Silva et al. (2005) was adapted to give a final volume of 1 mL, which contained the enzyme solution (200 µL), soluble starch at 5 mg mL-1 (333 µL) and acetate buffer (0.1 mol L-1, pH 4.6) (467 µL). The reaction was carried out for 15 min at 60 °C and then was inactivated by heating at 100 °C for 5 min. The control contained 200 µL of the enzyme solution and 800 µL of the same acetate buffer. Both enzyme produced and free glucose as in the control were quantified by the glucose oxidase method (Dahlqvist, 1961). One glucoamylase unit corresponded to the amount of enzyme that catalysed the formation of 1.0 µmol of glucose per minute under the assay conditions.
Kinetic studies of the glucoamylase production The fungus growth was carried out for 120 h at 32 °C under the previously described conditions. Two sets of flasks, comprising 11 flasks each were used for fermentation and samples as whole flask were withdrawn at each 12 h.
Partial purification of glucoamylase
The precipitated fraction at 60-85 % ammonium sulphate saturation of the crude extract at 4 °C was centrifuged at 12,500 × g for 30 min, re-dissolved in acetate buffer (0.1 mol L-1, pH 4.6) and dialyzed against phosphate buffer (5 mmol L-1, pH 6.9). The sample was loaded into a column (C16/20, 16.0 mm diameter and 16.0 cm height - GE
Healthcare) with anionic exchange resin
(Q-Sepharose Big Beads Coarse - GE Healthcare); 4.0 mL fractions were collected at a 60 mL h-1 flow, using as eluents, in the sequence, phosphate buffer 5, 20 and 200 mmol L-1 (pH 6.9), then a 0.0-1.0 mol L-1 NaCl gradient followed by elutions with constant NaCl concentrations at 1, 2 and 3 mol L-1, all NaCl solutions in phosphate buffer
(200 mmol L-1, pH 6.9). These samples were read
at 280 nm for each fraction.
The fractions with glucoamylase activity were pooled, dialyzed against acetate buffer at 5 mmol L-1, (pH 4.6), and loaded into a column (C16/20, 16 mm diameter and 16.0 cm height - GE
(SP-Sepharose Fast Flow - GE Healthcare); 4.0 mL fractions were collected at a 60 mL h-1 flow, using as eluents, in the sequence, acetate buffer 5, 20 and 200 mmol L-1 (pH 4.6), then a 0.0-2.0 mol L-1 NaCl gradient (in the last buffer). Finally, the fractions with glucoamylase activity were pooled, dialyzed and loaded into a column (17 mm diameter and 78.5 cm height) with gel filtration resin (Sephadex G-100 - Sigma-Aldrich); 4.0 mL fractions were collected at a 8 mL h-1 flow, using acetate buffer (5 mmol L-1, pH 4.6) as eluent. The absorbance of each fraction was read at 280 nm.
During all purification steps, the presence of glucoamylase and its specific activity were monitored with enzymatic assays, SDS-PAGE electrophoreses at 10 % (Laemmli, 1970) and protein content assays (Lowry, 1951) using bovine serum albumin as standard.
Determination of the optimum temperature and pH for the partially purified glucoamylase A 2k complete factorial design with the center point and the axial (star) points was used to determine the optimum temperature and pH. The response variable was the glucoamylase activity, measured as described previously (Table 2). The results were evaluated with the Experimental Design modulus using the software Statistica for Windows, version 5.0 (StatSoft, Inc., Chicago-IL).
Effect of the temperature and pH on the glucoamylase stability
These assays were carried out for both the crude extract and the partially purified enzyme. The pH
stability was assayed at 3.6, 4.0, 4.6 and 5.0 with acetate buffer (0.1 mol L-1) and at 6.0 and 7.0 with phosphate buffer (0.1 mol L-1). In each assay, 0.5 mL of the sample was diluted with 19.5 mL of the above-cited buffers and incubated at 60 ºC. The experiment was carried out for 24 h. A 1 mL aliquot was withdrawn after 0, 2, 4, 8 and 24 h. The aliquots were diluted in 30 mL of acetate buffer (0.1 mol L-1, pH 4.6), and kept at 60 ºC. Then, the residual activity was measured.
The glucoamylase thermostability was assayed at 15, 35, 60 and 70 °C. In each assay, 0.5 mL of the sample was diluted with 19.5 mL of acetate buffer (0.1 mol L-1, pH 4.6). The experiment was carried out for 24 h; a 1 mL aliquot was withdrawn after 0, 2, 4, 8 and 24 h. The aliquots were cooled in ice bath and then the residual activity was measured at 60 °C and pH 4.6.
Determination of the kinetic parameters (KM e
Vmax)
The enzymatic assay was carried out with starch solution in the concentration range 1 - 10 mg mL-1, sampled at 1 mg mL-1 steps, pH 4.6, acetate buffer (0.1 mol L-1) and 60 °C as described above. The
KM and Vmax values were calculated from a Hanes-Woolf plot (Hanes, 1932).
RESULTS AND DISCUSSION
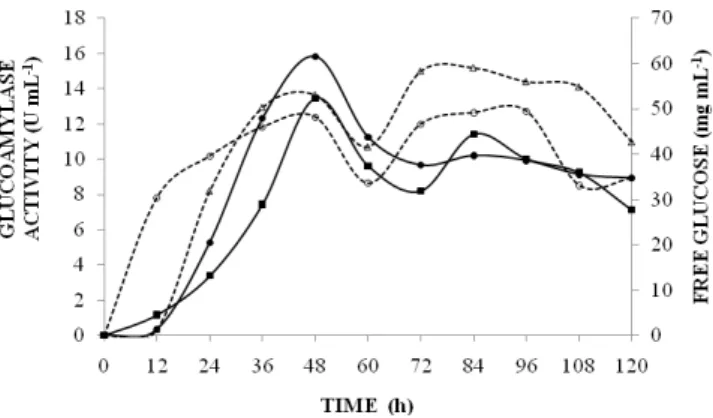
Kinetic study of glucoamylase production Figure 1 shows the glucoamylase activity and the free glucose concentration during the enzyme production.
Evidently A. niger was capable to produce glucoamylase in solid-state fermentation using a potato processing residue as substrate and the best yield was after 48 h (13.46 U mL-1 for assay number 1 and 15.82 U mL-1 for assay number 2). In the beginning as the enzyme was produced, the free glucose concentration grew up to 48 h and then its concentration as well as the glucoamylase activity started to fall. The enzyme production by the microorganism is repressed due to the glucose high concentration (Rajoka and Yasmeen, 2005) known as "glucose repression", which involves complex interactions between DNA binding repressors, their cognate elements and components of the transcriptional machinery in yeast (Griggs and Johnston, 1991; Keleher et al., 1992; Hu et al., 1995; Treitel and Carlson, 1995; De Vit et al., 1997; Park et al., 1999). Nevertheless, when the
glucose concentration decreases, the
microorganism starts to produce glucoamylase again and then to hydrolyze the starch to produce more glucose. This modulation (initial repression and subsequent desrepression) was also observed for Saccharomyces diastaticus (Kim et al., 2004).
Partial purification of glucoamylse
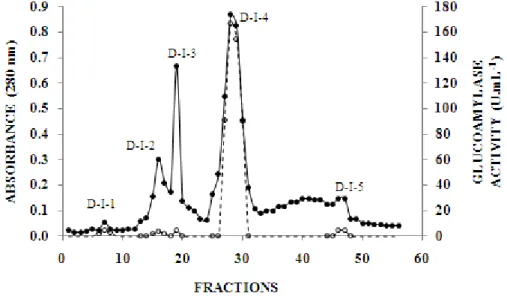
Ammonium sulphate precipitation was the first step of the purification procedure; the fraction precipitated in the saturation range 60-85 % was the one with most of the glucoamylase activity and therefore loaded onto the Q-Sepharose column after re-dissolving and dialysis. Figure 2a showed the corresponding chromatographic profile in which peaks were identified from A to G. Fractions from all the peaks were assayed, but only no 80-85, which were included in pool D, eluted during the gradient in which phosphate buffer was kept constant at 200 mmol L-1, (pH 6.9), with the NaCl concentration changing from 0.0 to 1.0 mol L-1, had glucoamylase activity. This pool, after new dialysis, was then loaded onto the SP-Sepharose column (Fig. 2b). Two peaks, D-I and D-II, were obtained and the corresponding fractions were assayed. Only the fractions 4-9 (peak/pool D-I) had significant glucoamylase activity and was then further loaded onto the sephadex G-100 column. This resulted five peaks, D-I-1, D-I-2, D-I-3, D-I-4 and D-I-5, (Fig. 2c), but only fractions 27-30 (peak/pool D-I-4) had glucoamylase activity.
Figure 2b - SP-Sepharose chromatography profile. (●) absorbance in 280 nm; (○) glucoamylase activity, determined for relevant fractions.
Figure 2c - Sephadex G-100 chromatography profile. (●) absorbance in 280 nm; (○) glucoamylase activity, determined for relevant fractions.
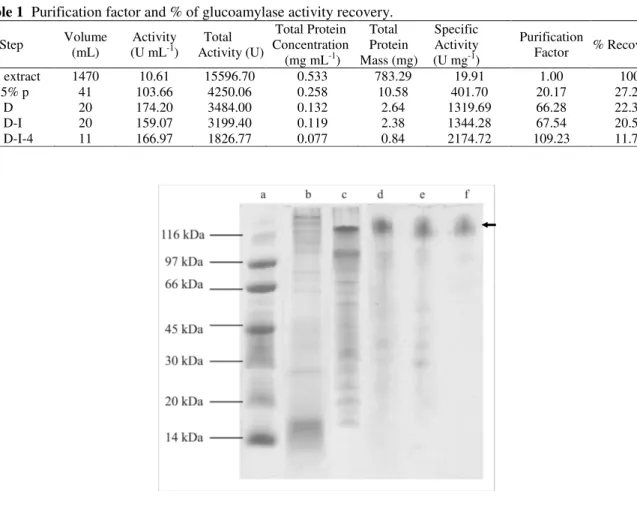
Table 1 summarizes the results from each purification step. The enzyme purity increased 109.23-folds with a 11.71 % yield and a final specific activity of 2174.72 U mg-1.
The partial purification was confirmed by SDS-PAGE electrophoresis (Fig. 3). The presumed
Table 1 Purification factor and % of glucoamylase activity recovery.
Step Volume
(mL)
Activity
(U mL-1)
Total Activity (U)
Total Protein Concentration
(mg mL-1)
Total Protein Mass (mg)
Specific Activity (U mg-1)
Purification
Factor % Recovery
Raw extract 1470 10.61 15596.70 0.533 783.29 19.91 1.00 100
60-85% p 41 103.66 4250.06 0.258 10.58 401.70 20.17 27.24
pool D 20 174.20 3484.00 0.132 2.64 1319.69 66.28 22.33
pool D-I 20 159.07 3199.40 0.119 2.38 1344.28 67.54 20.51
pool D-I-4 11 166.97 1826.77 0.077 0.84 2174.72 109.23 11.71
Figure 3 - SDS-PAGE electrophoretic profile including relevant samples from all purification steps. The lanes were loaded with: A) molecular mass markers (116 kDa 2-β -galactosidase; 97 kDa, phosphorylase b; 66 kDa, albumin; 45 kDa, ovalbumin; 30 kDa, carbonic anhydrase; 20,1 kDa, trypsin inhibitor and 14,4 kDa, α-lactalbumin); B) crude extract; C) ammonium sulphate 60-85% saturation precipitate; D) pool D; E) pool D-I and F) pool D-I-4. On lane F, an arrow indicates the presumed glucoamylase band.
Optimum pH and temperature determination Tables 2 and 3 show the assay results. The dependent variable values were coded and the response variable was the enzyme activity. Both pH and temperature variables, as well as their interaction, were significant at p < 0.05.
As observed in Table 3, both variables were significant, with a higher effect from the pH. At increasing the level from -1 to +1, the pH effect was negative, while the temperature effect was positive. Concerning the interaction, the effect was negative, implying that the set pH 3.6 and temperature 46 °C had a higher effect than any of these isolated variables.
The results in Table 4 showed that the model was predictive and statistically significant, with Fcal/Ftab equal to 54.21, p < 0.05. The mathematical model derived from the statistical analysis is presented in the equation below, which gives R2 = 0.9964 for the experimental data, where Ŷ represents the number of glucoamylase activity units, X1 represents the numerical value of the pH and X2 represents the numerical value of the temperature (°C):
Ŷ = 138,837 – 35,865 X1 – 39,315 X12 + 8,306 X2 –
Table 2 - Factorial design matrix, factors temperature and pH, 2k with center point (triplicate) and axial (star) points. The response is the glucoamylase activity.
pH T (ºC) pH T (ºC) Activity
coded decoded (U mL-1)
1 - 1 - 1 3.6 46 70.33
2 + 1 - 1 6.9 46 32.83
3 - 1 + 1 3.6 71 128.76
4 + 1 + 1 6.9 71 10.01
5 + 1.41 0 7.5 60 13.48
6 - 1.41 0 3.0 60 105.55
7 0 + 1.41 5.0 75 68.64
8 0 - 1.41 5.0 40 46.91
9 0 0 5.0 60 138.98
10 0 0 5.0 60 138.88
11 0 0 5.0 60 138.68
Table 3 - Temperature and pH effects on the partially purified glucoamylase activity.
Effects Pure error t(2) p
Mean 138.837 0.0881 1574.288 0.000000
(1) pH (L) - 71.7306 0.1081 - 663.107 0.000002
(2) Temperature (L) 16.6117 0.1081 153.566 0.000042
(1) e (2) - 40.6250 0.1527 - 265.953 0.000014
Table 4 - Variance analysis (ANOVA) to determine the optimal pH and temperature.
Quadratic Sum
Degrees of Freedom
Quadratic
Average Fcal Ftab Fcal/Ftab
Regression 26174.11 5 5234.82 273.78 5.05 54.21
Residue 95.61 5 19.12
Lack of fit 95.56 3 31.85
Pure error 0.05 2 0.02
Total 26269.72 10
R2 = 0.9964, p<0.05.
Effect of temperature and pH on the stability of glucoamylase
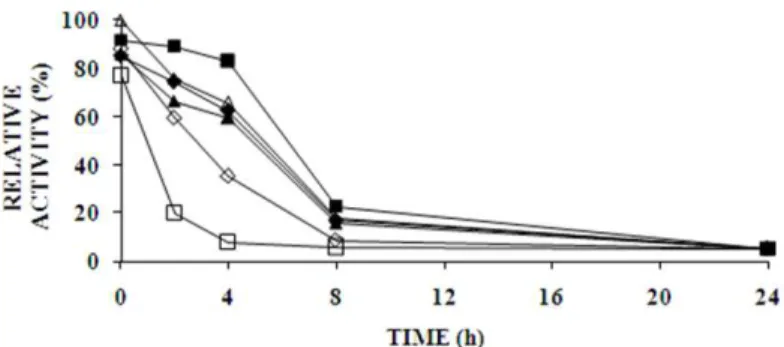
For the crude extract, the stability pH and temperature stability range were 4.0-5.0 and 35-60 °C, respectively, with 72.87 % activity at pH 4.6 and 60.33 % activity at 60 °C, when exposed for more than 24 h (Figures 4a and 4c).
This showed that the enzyme was thermostable with a good action in acidic pH. For the partially purified enzyme, a reasonable amount of activity remained up to 4 h at pH 6.0 and 60 °C, but after 8 h only 25 % activity remained (Figures 4b and 4d), an unfavourable fact for an industrial application of the purified enzyme.
Figure 4a - Stability of glucoamylase (crude extract) with respect to the pH: ▲ 3.6, ♦ 4.0, ∆ 4.6, ■
Figure 4b - Stability of the partially purified glucoamylase with respect to the pH: ▲ 3.6, ♦ 4.0, ∆ 4.6, ■ 5.0, ◊ 6.0, □ 7.0. The activity was measured at 60°C.
Figure 4c - Stability of glucoamylase (crude extract) with respect to the temperature : ■ 15 °C, ▲
35 °C, ♦ 60 °C and ●70 °C. The residual activity was measured at 60 °C and pH 4.6.
Figure 4d - Stability of the partially purified glucoamylase with respect to the temperature: ■ 15 °C, ▲ 35 °C, ♦ 60 °C and ●70 °C. The residual activity was measured at 60 °C and pH 4.6.
Determination of the kinetic parameters (KM e
Vmax)
The KM and Vmax values calculated from the Hanes-Woolf plot for the partially purified glucoamylase
were 0.34 mg mL-1 and 160.22 U mL-1,
Figure 5a - V0 values for the partially purified glucoamylase. 5b. Hanes-Woolf plot for the partially purified glucoamylase.
The potato processing residue contains large amount of starch, especially when the dry mass is considered (from the 15.34 % of dry mass, starch corresponded to 12.56 %). This makes this residue an excellent carbon source, besides a starch source, for the amylase synthesis. Pandey et al. (1999) and Gupta et al. (2003) have reported the need of a starch source to induce the amylase production by fungi, yeast and bacteria. These
microorganisms cannot assimilate complex
molecules such as starch in native form, thus, they start to synthesize specific enzymes to transform the complex substrate into simple molecules, which assures the microorganism growth and development. According to Badino et al. (1999), starch hydrolysis into glucose is faster than the
microorganism glucose consumption, which
causes the growth inhibition and the enzyme synthesis repression due to the accumulation of the reaction product. Therefore, the absence of glucose in the residue is an extremely important factor to induce the glucoamylase synthesis. For an industrial application of glucoamylase, it is important to take into consideration the optimal conditions for the enzyme action and stability. The results from the factorial design showed that the optimum temperature was around 60 °C while the optimum pH was 4.5-5.0 or even lower. This temperature, associated with the acidic pH value is valuable for industrial applications, as these conditions reduce microbial contaminations. According to Gomes et al. (2007), in the industrial processes to hydrolyze the starch, at the saccharification step, the system must have the pH between 4.2-5.0. Additionally, the enzymes need
the material to be cooled to temperatures below 60 ºC. The crude extract prepared during this work maintained more than 60 % of the glucoamylase activity for more than 24 h when kept at 60 ºC and pH 4.6. These characteristics are satisfactory for the glucoamylase use in the starch processing industry during the saccharification step, which is carried out at exactly these optimal stability and activity conditions. Nevertheless, after the partial purification, the stability period decreased (not more than 25 % activity remained after 8 h), which disfavored the industrial use of the purified enzyme. On the other hand, when one intends to study the molecule physical chemical properties related to its action, a high degree of purification is mandatory.
The calculated molecular mass of 118.17 kDa was higher than the reported for the glucoamylase I (91 kDa) produced by A. niger (Aalbeek et al., 2002), the latter considered to be in native form, that is, without any proteolytic action, but quite similar to the one (112 kDa) reported for glucoamylase II produced by the same organism by Pazur and Kleppe (1971). This could be an important information for a future work on the structure determination of a non-cleaved enzyme (Aleshin et al., 1994).
ACKNOWLEDGEMENTS
REFERENCES
Aalbaek, T.; Reeslev, M.; Jensen, B. and Eriksen, S.H. (2002). Acid protease and formation of multiple forms of glucoamylase in batch and continuous cultures of Aspergillus niger. Enzyme Microb. Technol., 30, 410-415.
Aiyer, P. (2005). Amylases and their applications. Afr. J. Biotechnol.,4, 1525-1529.
Aleshin, A.E.; Hoffman, C.; Firsov, L.M. and Honzatko, R.B. (1994). Refined crystal structures of glucoamylase from Aspergillus awamori var. X100.
J. Mol. Biol., 238, 575-591.
Badino, A.C.; Facciotti, M.C.R. and Schmidell, W. (1999). Estimation of the rheology of glucoamylase fermentation broth from the biomass concentration and shear conditions. Biotechnol. Tech., 13, 723-726. Buchholz, K. and Seibel, J. (2008). Industrial
carbohydrate biotransformation. Carbohydr.Res.,
343, 1966-1979.
Couto, S.R. and Sanromán, M.A. (2006). Application of solid-state fermentation to food industry: a review. J. Food Eng., 76, 291-302.
Dahlqvist, A. (1961). Determination of maltase and isomaltase activities with a glucose-oxidase reagent.
Biochem. J., 80, 547-551.
De Vit, M.J.; Waddle, J.A. and Johnston, M. (1997) Regulated nuclear translocation of the Mig1 glucose repressor. Mol. Biol. Cell, 8,1603-1618.
Gomes, E.; Guez, M.A.U.; Martin, N. and Silva, R. (2007). Thermostable enzymes: sources, production and industrial application. Quim. Nova, 30, 136-145. Gouka, R.J.; Punt, P.J. and Van Den Hondel,
C.A.M.J.J. (1997). Efficient production of secreted proteins by Aspergillus: progress, limitations and prospects. Appl. Microbiol. Biotechnol., 47,1–11. Griggs, D.W. and Johnston, M. (1991) Regulated
expression of the GAL4 activator gene in yeast provides a sensitive genetic switch for glucose repression. Proc. Natl. Acad. Sci., 88,8597-8601. Gupta, R.; Mohapatra, H.; Goswami, V.K. and
Chauhan, B. (2003). Microbial α- amylases: a biotechnological perspective. Process Biochem., 38,:
1599-1616.
Guzmán-Maldonado, H. and Parede-Lópes, O. (1995). Amylolytic enzymes and products derived from starch: a review. Crit. Rev. Food Sci. Nutr., 35, 373-403.
Hanes, C.S. (1932). Studies on plant amylases: The effect of starch concentration upon the velocity of hydrolysis by the amylase of germinated barley.
Biochem. J., 26, 1406–1421.
Hu, Z.; Nehlin, J.O.; Ronne, H. and Michels, C.A. (1995), MIG1-dependent and MIG1-independent glucose regulation of MAL gene expression in
Saccharomyces cerevisiae. Curr. Genet., 28, 258-266.
Keleher, C.A.; Redd, M.J.; Schultz, J.; Carlson, M. and Johnson, A. (1992), Ssn6-Tup1 is a general repressor of transcription in yeast. Cell, 68,709-719.
Kim, T.S.; Lee, S.B. and Kang, H.S. (2004). Glucose repression of STA1 expression is mediated by the Ngr1 e Sfl1 repressors and the Srb8-11 complex. Mol. Cell. Biol., 24, 7695-7706.
Koutinas, A.A.; Wang, R. and Webb, C. (2003). Estimation of fungal growth in complex, heterogeneous culture. Biochem. Eng. J.,14,93–100. Laemmli, U.K. (1970). Cleavage of structural proteins
during the assembly of the head of bacteriophage T4.
Nature, 227, 680-685.
Lowry, O.H.; Rosebrough, N.J.; Farr, A.L. and Randall, R.J. (1951). Protein measurement with the folin- phenol reagents. J. Biol. Chem.,193, 265-275.
Norouzian, D.; Akbarzadeh, A.; Scharer, J.M. and Moo-Young, M. (2006). Fungal glucoamilases.
Biotechnol. Adv.,24, 80-85.
Pandey, A.; Selvakumar, P.; Soccol, C.R. and Nigam, P. (1999). Solid-state fermentation for the production of industrial enzymes. Curr. Sci., 77, 149-162. Park, S.H.; Koh, S.S.; Chun, J.H.; Hwang, H.J. and
Kang, H.S. (1999), Nrg1 is a transcriptional repressor for glucose repression of STA1 gene expression in
Saccharomyces cerevisiae. Mol. Biol. Cell, 19, 2044-2050.
Pazur, J.H. and Kleppe, K. (1971). Glucoamylase structure and properties of the two form so of glucoamylase from Aspergillus niger. Carbohydr. Res., 20, 83-96.
Rajoka, M. and Yasmeen, A. (2005). Induction, and production studies of a novel glucoamylase of
Aspergillus niger. World J. Microbiol. Biotechnol.,
21, 179-187.
Selvakumar, P.; Ashakumary, L. and Pandey, A. (1996). Microbial synthesis of starch saccharifying enzyme in solid state fermentation. J. Sci. Ind. Res.,
55, 443-449.
Silva, R.N.; Asquieri, E.R. and Fernandes, K.F. (2005). Immobilization of Aspergillus niger glucoamylase onto a polyaniline polymer. Process Biochem., 40, 1155-1159.
Spier, M.R.; Woiciechowski, A.L.; Vandenbergue, L. and Soccol, C.R. (2006). Production and characterization of amylases by Aspergillus niger
under solid state fermentation using agro industrials products. Int. J. Food Eng., 2, 1-19.
Treitel, M.A. and Carlson, M. (1995), Repression by SSN6-TUP1 is directed by MIG1, a repressor/activator protein. Proc. Nat. Acad. Sci., 92, 3132-3136.