ISSN 0104-6632 Printed in Brazil
www.abeq.org.br/bjche
Vol. 30, No. 03, pp. 467 - 476, July - September, 2013
Brazilian Journal
of Chemical
Engineering
ENZYMATIC HYDROLYSIS OPTIMIZATION OF
SWEET POTATO (
Ipomoea batatas
) PEEL USING
A STATISTICAL APPROACH
E. Betiku
*, O. O. Akindolani and A. R. Ismaila
Biochemical Engineering Laboratory, Department of Chemical Engineering, Phone: + 234-803-6602988, Fax: +234 (36) 232401, Obafemi Awolowo University, Ile-Ife 220005, Osun State, Nigeria.
E-mail: [email protected]
(Submitted: March 14, 2012 ; Revised: August 27, 2012 ; Accepted: August 30, 2012)
Abstract - In this work, two-step enzymatic hydrolysis of sweet potato peel was optimized. The effects of time, enzyme dose and temperature on glucose concentration were investigated. The Box-Behnken design was applied and a total of 17 experimental runs were generated for each step. For the liquefaction step, an ANOVA test showed the quadratic model obtained to be significant (p < 0.05). The statistical model predicted
the maximum glucose concentration to be 126.66 g/L at a temperature of 56.4 °C, α-amylase dose 1% (v/v)
and time 60 min. A quadratic model was also obtained for the saccharification step and the model was also significant (p < 0.05). The statistical model for the second step predicted the maximum glucose concentration to be 178.39 g/L, established at the temperature of 45 °C, glucoamylase dose 1% (v/v) and time 60 min. The optimized liquefaction and saccharification conditions were validated with the actual glucose concentrations of 126.03 and 176.89 g/L, respectively.
Keywords: Hydrolysis; Enzymes; Optimization; Response surface methodology; Sweet potato peel.
INTRODUCTION
Ipomoea batatas L., commonly known as sweet potato, is a dicotyledonous plant which belongs to the family Convolvulaceae, ranked as the seventh most important food crop in global production. In most industries, restaurants and homes where sweet potatoes are eaten or processed into more value-added products, the peel is essentially treated as a waste product and poses disposal problems. Hence, to help keep the environment clean and also find a cheap alternative carbon source for cultivation of many microorganisms, this peel can be hydrolyzed to fermentable sugars, which can be converted to valuable products like citric acid, gluconic acid, oxalic acid, and ethanol, among others. Conven-tionally, starch is hydrolyzed by acid catalysis, but
corrosion-resistant materials, gave rise to high colour and salt ash content (after neutralization), used more energy for heating and was relatively difficult to control (Chaplin and Bucke, 1990). The two steps involved in enzymatic process are liquefaction and saccharification (Blanco et al., 2000). In the first
step, the enzyme α-amylase cleaves 1,4-glycosidic
Brazilian Journal of Chemical Engineering
(1981a) and Kim and Hamdy (1985), while other studies on enzymatic hydrolysis include Azhar and
Hamdy (1981b), Sawai et al. (2004) and Shariffa
et al. (2009) to mention a few. However, all of these studies were carried out on the starch from the pulp of the sweet potato. In addition, none of the reported work made use of experimental design such as Response Surface Methodology (RSM). RSM, origi-nally described by Box and Wilson (1951), is a useful optimization tool which has been applied in research to study the effect of individual variables and their interactions on response variables. Besides the fact that RSM is a less laborious and more cost effective method for gathering research results than the classical methods, its main advantage is the ability to reduced the number of experimental runs needed to provide sufficient information for statisti-cally acceptable results. RSM has been applied to many area of research, but only a few have reported its application to enzymatic hydrolysis of starch. These include the work of Kunamneni and Singh (2005) on maize and Vázquez et al. (2009) on potato (Solanum tuberosum).
In this work, sweet potato peel was converted into fermentable sugars in a two-step enzymatic hydroly-sis. To optimize the process, RSM was applied to determine the effects of three-level-three-factor and their reciprocal interactions on the glucose released both at the liquefaction and saccharification steps.
MATERIALS AND METHODS Sweet Potato Peel Preparation
Freshly harvested mature sweet potatoes were obtained from a local market in Ogbomoso, Oyo State, Nigeria. The sweet potatoes were washed in clean water to remove dirt and adhering latex. They were manually peeled, the weight of the peel measured and recorded followed by drying to constant weight using a plate dryer and milled to flour.
Enzymatic Studies
For this work, a two-step enzymatic hydrolysis method was adopted. In the first step (liquefaction), partially purified bacterial alpha amylase (6.4 units/ml) was used, while for the second step (saccharification), partially purified fungal glucoa-mylase (789.6 units/ml) was employed. The enzymes
were purchased from the Federal Institute of Industrial Research Oshodi (Nigeria).
Experimental Design
For the liquefaction of the sweet potato peel starch, the Box-Behnken experimental design was employed for the optimization. A three-level-three-factor design was applied, which generated 17 experimental runs. This included 6 factorial points, 6 axial points and 5 central points to provide informa-tion regarding the interior of the experimental region, making it possible to evaluate the curvature effect. Selected hydrolysis variables for the liquefaction of the sweet potato peel starch were time (X1),
α-amylase dose (X2) and temperature (X3). The coded
independent variables levels are depicted in Table 1, while Table 2 shows the 17 experimental runs generated in terms of coded variables, the observed glucose concentrations, the predicted glucose con-centrations and the residual values. Also, for the saccharification step, the Box-Behnken experimental design was applied to generate 17 experimental runs with selected variables of time (X1), glucoamylase
dose (X2) and temperature (X3). The coded
inde-pendent variables levels are shown in Table 3 and Table 4 displays the 17 experimental runs generated in terms of coded variables, the observed glucose concentrations, the predicted glucose concentrations and the residual values.
Two-Step Enzymatic Peel Starch Hydrolysis
For the hydrolysis investigation, the method of Betiku and Ajala (2010) was adopted. The sweet potato peel flour obtained was made into a starch slurry by adding appropriate quantity of water. In order to make a 27.5% (w/v) slurry, 10 g of flour was weighed into 20 mL of a 26 ppm CaCl2 solution.
Table 1: Factors and their levels for the Box-Behnken design (liquefaction step).
Coded variable levels
Variable Symbol
-1 0 +1
Time (min) X1 20 40 60
α-Amylase dose % (v/v) X2 0.5 0.75 1
Temperature (°C) X3 50 60 70
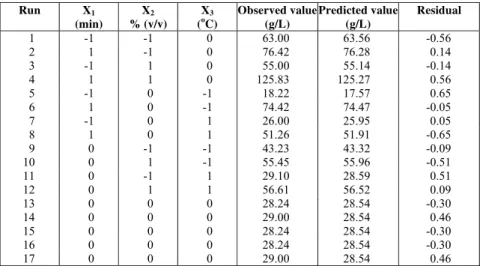
Table 2: Liquefaction data for the observed glucose concentration, predicted glucose concentration and residual values.
Run X1 (min)
X2 % (v/v)
X3
(oC) Observed value (g/L) Predicted value (g/L) Residual 1 -1 -1 0 63.00 63.56 -0.56 2 1 -1 0 76.42 76.28 0.14 3 -1 1 0 55.00 55.14 -0.14
4 1 1 0 125.83 125.27 0.56
5 -1 0 -1 18.22 17.57 0.65 6 1 0 -1 74.42 74.47 -0.05 7 -1 0 1 26.00 25.95 0.05 8 1 0 1 51.26 51.91 -0.65 9 0 -1 -1 43.23 43.32 -0.09 10 0 1 -1 55.45 55.96 -0.51 11 0 -1 1 29.10 28.59 0.51 12 0 1 1 56.61 56.52 0.09 13 0 0 0 28.24 28.54 -0.30 14 0 0 0 29.00 28.54 0.46 15 0 0 0 28.24 28.54 -0.30 16 0 0 0 28.24 28.54 -0.30 17 0 0 0 29.00 28.54 0.46
Table 3: Factors and their levels for the Box-Behnken design (sacchari-fication step).
Coded variable levels
Variable Symbol
-1 0 +1
Time (min) X1 10 35 60
Glucoamylase dose % (v/v) X2 0.5 0.75 1
Temperature (°C) X3 40 50 60
Reducing Sugar Assay
The DNS method described by Miller (1959) and modified DNS Reagent were used to determine the reducing sugar produced, which was expressed as glucose in this work. To 1 ml of the supernatant, 3 ml of the DNS solution was added to the test tube and was boiled for 15 min, cooled and diluted appropriately after which their absorbance were measured at a wavelength of 540 nm using a UV-Visible Spectrophotometer (Libra 21 Model). Dextrose equivalent (DE) was calculated as follows:
Reducing sugar expressed as glucose
DE 100
Sample dry weight
⎛ ⎞
⎜ ⎟
=⎜ ⎟×
⎜ ⎟
(1)
Statistical Data Analysis
The data obtained from both the liquefaction and saccharification steps were analyzed statistically using response surface methodology, in order to fit the second-order mathematical model generated by the Design-Expert software version 8.0.3.1 (Stat-Ease Inc., Minneapolis, USA). To correlate the response variable to the independent variables, multiple regression was used to fit the coefficient of the polynomial model of the response in each case. The quality of the fit of the model was evaluated using test of significance and analysis of variance (ANOVA). The fitted second-order mathematical model is described in Eq. (2).
k k k
2
0 i i ii i ij i j
Brazilian Journal of Chemical Engineering
where Y is the response factor (glucose concentra-tion), bo is the intercept value, bi (i = 1, 2, …, k) is
the first order model coefficient, bij is the interaction
effect, and bii represents the quadratic coefficients of
Xi, and e is the random error.
RESULTS AND DISCUSSION
Optimization of the Liquefaction Step of Sweet Potato Peel Starch Hydrolysis
In order to find a useful means of disposing of sweet potato peel, optimization of the two-step enzymatic hydrolysis of the peel to glucose-rich syrup, needed by food and pharmaceutical industries, was carried out. The glucose-rich syrup obtained could also serve as an alternative carbon source for cultivation of many microorganisms for production of such products as citric acid, gluconic acid, oxalic
acid, and ethanol, among others. Results of the liquefaction step as designed by Box Behnken are presented in Table 3, which contained the coded factors considered in this study with observed values, predicted values as well as the residual values obtained.
Design Expert 8.0.3.1 software (Trial version) was employed to evaluate and determine the coeffi-cients of the full regression model equation and their statistical significance. Table 5 shows the results of test of significance for every regression coefficient. The results revealed that the p-values of the model terms were significant, i.e., p < 0.05. In this case, the three linear terms (X1, X2, X3), three cross-products
(X1X2, X1X3, X2X3) and the three quadratic terms
(
1
2 X ,
2
2
X and X ) were all markedly23 significant
model terms at 95% confidence level. Table 6 shows the analysis of variance of the regression equation model.
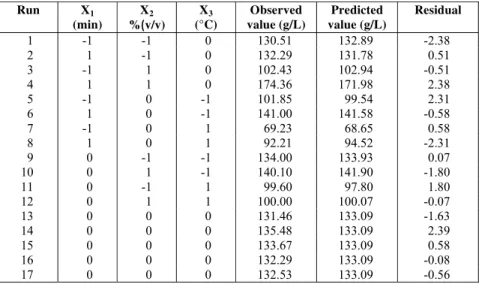
Table 4: Saccharification data for the observed glucose concentration, predicted glucose concentration and residual values.
Run X1
(min) X2
%(v/v) X3
(°C)
Observed value (g/L)
Predicted value (g/L)
Residual
1 -1 -1 0 130.51 132.89 -2.38
2 1 -1 0 132.29 131.78 0.51
3 -1 1 0 102.43 102.94 -0.51
4 1 1 0 174.36 171.98 2.38
5 -1 0 -1 101.85 99.54 2.31 6 1 0 -1 141.00 141.58 -0.58 7 -1 0 1 69.23 68.65 0.58 8 1 0 1 92.21 94.52 -2.31 9 0 -1 -1 134.00 133.93 0.07 10 0 1 -1 140.10 141.90 -1.80 11 0 -1 1 99.60 97.80 1.80
12 0 1 1 100.00 100.07 -0.07
13 0 0 0 131.46 133.09 -1.63
14 0 0 0 135.48 133.09 2.39
15 0 0 0 133.67 133.09 0.58
16 0 0 0 132.29 133.09 -0.08
17 0 0 0 132.53 133.09 -0.56
Table 5: Test of significance for every regression coefficient for the liquefaction step.
Source Sum of squares df Mean square F-Value p-Value
X1 3432.48 1 3432.48 8753.30 <0.0001
X2 822.96 1 822.96 2098.67 <0.0001
X3 100.47 1 100.47 256.20 <0.0001
X1 X2 823.98 1 823.98 2101.26 <0.0001
X1 X3 239.32 1 239.32 610.30 <0.0001
X2 X3 58.45 1 58.45 149.05 <0.0001
2 1
X 2414.77 1 2414.77 6157.99 <0.0001
2 2
X 3200.56 1 3200.56 8161.88 <0.0001
2 3
Table 6: Analysis of variance (ANOVA) of the regression equation for the liquefaction step.
Source Sum of squares df Mean Square
F-value p-Value
Model 11618.83 9 1290.98 3292.19 <0.0001
Residual 2.74 7 0.39
Lack of Fit 2.05 3 0.68 3.95 0.109
Pure Error 0.69 4 0.17
Cor Total 11621.57 16
R2=99.98%, R2 (adj) = 99.95%
The model Fisher F-test of 3292.19 with low
probability value [(pmodel > F) = 0.0001]
demon-strated a high significance for the regression model (Kunamneni and Singh, 2005). The goodness of fit was checked by the coefficient of determination (R2).
Guan and Yao (2008) reported that R2 should be at
least 0.80 for the good fit of a model. For the
liquefaction step, the R2 was 99.98% while the
adjusted R2 was found to be 99.95% and all p-value coefficients were less than 0.0001, which implied that the model proved suitable for the adequate representation of the actual relationship between the
selected variables (Vázquez et al., 2009). These
values indicated that the regression is statistically significant; only 0.02% of the total variation was not explained by this regression model. Furthermore, the value of the R2 obtained in this work showed a high consistency between the observed values and the predicted values. The lack-of-fit term of 0.109 was not significant relative to the pure error (Vázquez et al., 2009). In this case, a non-significant lack of fit
is good (Vázquez et al., 2009). Therefore, it could be used for theoretical prediction of the liquefaction of sweet potato peel starch. The final regression equation in terms of coded factors for the Box-Behnken response surface quadratic model for the liquefaction step is described in Eq. (3).
1 2
1 2 3
1 2 1 3 2 3
2 2 2
3
Y 28.54 20.71X 10.14X – 3.54X
14.35X X – 7.74X X 3.82X X
23.95X 27.57X – 10.02X
= + +
+ +
+ +
(3)
where Y = reducing sugar produced (expressed as glucose) in g/L.
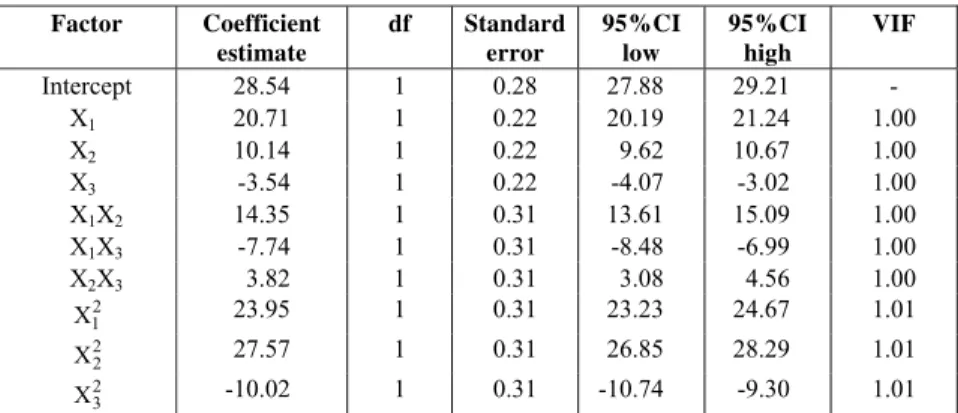
The low values of standard error observed in the intercept and all the model terms showed that the regression model fits the data well and the prediction was good (Table 7). The variance inflation factor (VIF) obtained in this work revealed that the center points are orthogonal to all other factors in the model (Table 7).
Table 7: Regression coefficients and significance of response surface quadratic for the liquefaction step.
Factor Coefficient estimate
df Standard error
95%CI low
95%CI high
VIF
Intercept 28.54 1 0.28 27.88 29.21 -
X1 20.71 1 0.22 20.19 21.24 1.00
X2 10.14 1 0.22 9.62 10.67 1.00
X3 -3.54 1 0.22 -4.07 -3.02 1.00
X1X2 14.35 1 0.31 13.61 15.09 1.00
X1X3 -7.74 1 0.31 -8.48 -6.99 1.00
X2X3 3.82 1 0.31 3.08 4.56 1.00
2 1
X 23.95 1 0.31 23.23 24.67 1.01
2 2
X 27.57 1 0.31 26.85 28.29 1.01
2 3
Brazilian Journal of Chemical Engineering
The graphical representations of the regression equation for the optimization of the liquefaction step are displayed as three dimensional (3-D) surfaces in Figure 1(a)-(c). Figure 1a shows the response surface plot representing the effect of time, α-amylase dose and their reciprocal interaction on hydrolysis yield while keeping temperature constant. The results showed that a linear relationship exists between both
time and α-amylase dose. As both the time and
α-amylase dose increase, the glucose concentration
also increases. The curvature nature of the surface plot in Figure 1a indicates a mutual interaction between α-amylase and time (Yuan et al., 2008). The response surface plot representing the effect of temperature, time and their reciprocal interaction on
glucose concentration while keeping α-amylase
constant is presented in Figure 1(b). The results showed that increasing hydrolysis temperature does not favour glucose accumulation. Figure 1c describes the response surface plot representing the effect of
temperature, α-amylase dose and their reciprocal
interaction on glucose concentration while hydroly-sis time was held constant. The results revealed that
high temperature and high α-amylase dose favour
glucose accumulation.
The optimal values of the independent variables selected for the liquefaction step were obtained by solving the regression equation (Eq. (3)) using the Design-Expert software. The optimal condition for this step was estimated as X1 = 60 min, X2 = 1% (v/v) and
X3 = 56.4 °C. The predicted glucose concentration
under the above condition was Y = 126.66 g/L. To verify the prediction of the model, the optimal condition was applied to three independent replicates and the average glucose concentration obtained was 126.03 g/L (dextrose equivalent of 50.4), which is well within the estimated value of the model equation. Valetudie et al. (1993) reported dextrose equivalent of 25 when bacterial α-amylase was used for 24 h to hydrolyze sweet potato starch.
0.50 0.63 0.75 0.88 1.00 20.00 30.00 40.00 50.00 60.00 20 40 60 80 100 120 140 G lu c os e c o nc e nt ra ti on ( g/ L) Time (min) Alpha amylase dose %(v/v)
50.00 55.00 60.00 65.00 70.00 20.00 30.00 40.00 50.00 60.00 10 20 30 40 50 60 70 80 G luc ose c onc en tr at ion ( g /L ) Time (min) Temperature (deg C)
(a) (b) 50.00 55.00 60.00 65.00 70.00 0.50 0.63 0.75 0.88 1.00 10 20 30 40 50 60 70 G luc os e c onc ent rat ion ( g/ L)
Alpha amylase dose %(v/v) Temperature (deg C)
(c)
Figure 1(a)-(c): Surface plots for liquefaction of sweet potato peel.
(a) effect of α-amylase dose, time and their reciprocal interaction on glucose concentration. (b) effect of temperature, time and their reciprocal interaction on glucose concentration.
Optimization of the Saccharification Step of Sweet Potato Peel Starch Hydrolysis
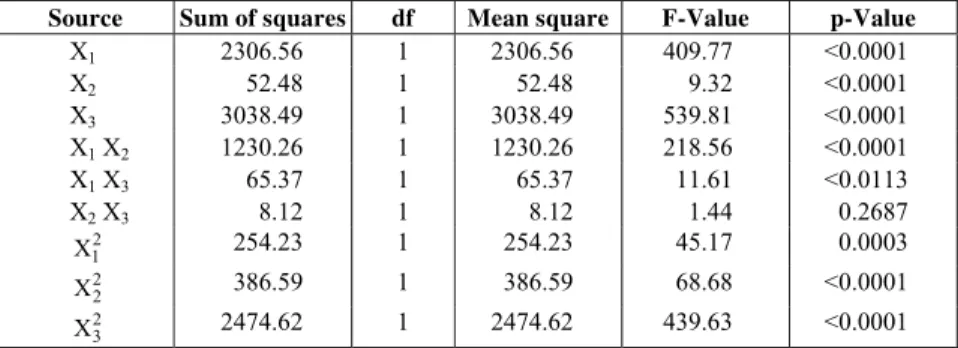
A saccharification step was required because a significant amount of starch was left unhydrolyzed at the liquefaction stage. Results of the optimization of the saccharification step are displayed in Table 4, which contains the coded factors together with observed values, predicted values as well as the residual values. Table 8 gives the results of the test of significance for every regression coefficient. It was observed that the p-values of the model terms were remarkablely significant except for the cross-product of X2X3, which was not significant at 95%
confidence level. Results of the analysis of variance of the regression equation model are shown in Table 9.
The model Fisher F-test of 193.04 with a low
probability value [(pmodel > F) = 0.0001] indicated a
high significance for the regression model (Kunamneni and Singh, 2005). It exhibited a low standard
deviation and very high R2 values. The R2 was
99.90%, the adjusted R2 was found to be 99.61% and all p-value coefficients were significant except that of X2X3 (Table 8). This suggested that the model was
suitable for the representation of the actual relation-ship between the selected factors (Vázquez et al., 2009). These values showed that this regression was statistically significant; only 0.1% of the total
variation was not explained by this regression model.
In addition, the value of the R2 obtained in this
saccharification step implied a high consistency between the observed values and the predicted values. The lack-of-fit term of 0.103 was not significant relative to the pure error (Vázquez et al., 2009). In this case, a non-significant lack of fit is good (Vázquez et al., 2009). Hence, it could be used for theoretical prediction of the saccharification of liquefied sweet potato peel starch. The final regression equation in terms of coded factors for the Box-Behnken response surface quadratic model for the saccharification step is expressed in Eq. (4).
1 2 3
1 2 1 3 2 3
2 2 2
1 2 3
Y 133.09 16.98X 2.56X – 19.49X
17.54X X – 4.04X X – 1.42X X
7.77X 9.58X –24.24X
= + +
+
− +
(4)
where Y = reducing sugar produced (expressed as glucose) in g/L.
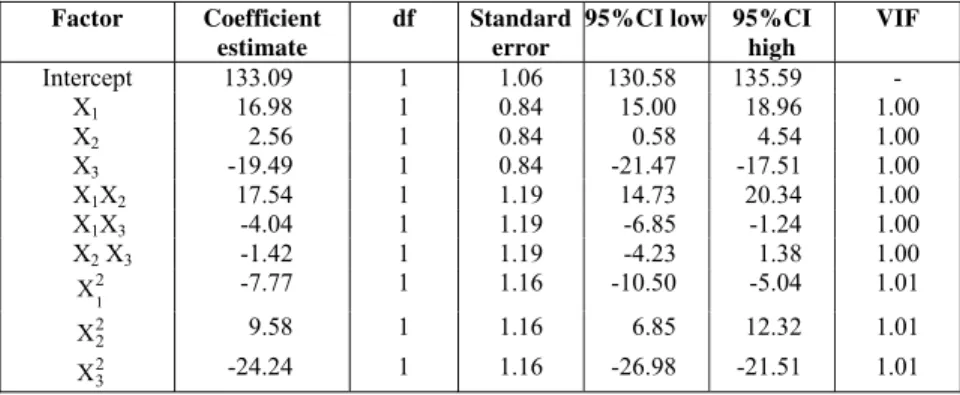
The low values of the standard error of the intercept and all the model terms revealed that the regression model fits the data well and the prediction was good (Table 10). The variance inflation factor (VIF) obtained in this work revealed that the center points are orthogonal to all other factors in the model (Table 10).
Table 8: Test of significance for every regression coefficient for the saccharification step.
Source Sum of squares df Mean square F-Value p-Value
X1 2306.56 1 2306.56 409.77 <0.0001
X2 52.48 1 52.48 9.32 <0.0001
X3 3038.49 1 3038.49 539.81 <0.0001
X1 X2 1230.26 1 1230.26 218.56 <0.0001
X1 X3 65.37 1 65.37 11.61 <0.0113
X2 X3 8.12 1 8.12 1.44 0.2687
2 1
X 254.23 1 254.23 45.17 0.0003
2 2
X 386.59 1 386.59 68.68 <0.0001
2 3
X 2474.62 1 2474.62 439.63 <0.0001
Table 9: Analysis of variance (ANOVA) of regression equation for the saccharification step.
Source Sum of squares df Mean square
F-Value p-Value
Model 9779.35 9 1086.59 193.04 <0.0001
Residual 39.40 7 5.63
Lack of Fit 29.74 3 9.91 4.11 0.103
Pure Error 9.66 4 2.41
Brazilian Journal of Chemical Engineering
Table 10: Regression coefficients and significance of the response surface quadratic for the saccharification step.
Factor Coefficient estimate
df Standard error
95%CI low 95%CI high
VIF
Intercept 133.09 1 1.06 130.58 135.59 -
X1 16.98 1 0.84 15.00 18.96 1.00
X2 2.56 1 0.84 0.58 4.54 1.00
X3 -19.49 1 0.84 -21.47 -17.51 1.00
X1X2 17.54 1 1.19 14.73 20.34 1.00
X1X3 -4.04 1 1.19 -6.85 -1.24 1.00
X2 X3 -1.42 1 1.19 -4.23 1.38 1.00
1
2
X -7.77 1 1.16 -10.50 -5.04 1.01
2 2
X 9.58 1 1.16 6.85 12.32 1.01
2 3
X -24.24 1 1.16 -26.98 -21.51 1.01
The graphical representations of the regression equation for the optimization of the saccharification step are displayed as three dimensional (3-D) surfaces in Figure 2(a)-(c). Figure 2(a) depicts the response surface plot representing the effect of time, glucoamylase dose and their reciprocal interaction on
glucose concentration while keeping temperature constant. It was observed that, as both the time and glucoamylase dose increase, the glucose concentra-tion also increases, suggesting a linear relaconcentra-tionship between the two variables. High glucoamylase dose and low saccharification time or vice versa did not
0.50 0.60 0.70 0.80 0.90 1.00 10.00 20.00 30.00 40.00 50.00 60.00 100 120 140 160 180 G luc o s e c onc ent rat ion ( g/ L ) Time (min) Glucoamylase dose %(v/v)
40.00 45.00 50.00 55.00 60.00 10.00 20.00 30.00 40.00 50.00 60.00 60 80 100 120 140 160 G luc o s e c o nc ent rat io n (g /L) Time (min) Temperature (deg C)
(a) (b) 40.00 45.00 50.00 55.00 60.00 0.50 0.60 0.70 0.80 0.90 1.00 80 90 100 110 120 130 140 150 G luc os e c onc ent rat ion ( g/ L )
Glucoamylase dose %(v/v) Temperature (deg C)
(c)
Figure 2(a)-(c): Surface plots for saccharification of sweet potato peel.
(a) effect of glucoamylase dose, time and their reciprocal interaction on glucose concentration. (b) effect of temperature, time and their reciprocal interaction on glucose concentration.
favour glucose concentration. The response surface plot representing the effect of temperature, time and their reciprocal interaction on glucose concentration while keeping glucoamylase dose constant are shown in Figure 2(b). Figure 2(c) displays the response surface plot representing the effect of temperature, glucoamylase dose and their reciprocal interaction on glucose concentration when hydrolysis time was held constant. The curvatures of the three dimensional surfaces in Figure 2(b) and (c) indicated mutual interactions between temperature and saccharifica-tion time and between temperature and glucoamylase dose (Yuan et al., 2008).
The optimal values of the independent variables selected for the saccharification step were also obtained by solving the regression equation (Eq. (4)) using the Design-Expert software. The optimal con-dition for this step was established as X1 = 60 min,
X2 = 1% (v/v) and X3 = 45 °C. The predicted glucose
concentration under the above set of conditions was Y = 178.39 g/L. To verify the prediction of the model, the optimal condition was applied to three inde-pendent replicates and the average glucose concen-tration obtained was 176.89 g/L (dextrose equivalent of 70.4), which is well within the predicted value of the model equation. The results of this work have shown that response surface methodology could be used to optimize the two-step enzymatic hydrolysis of sweet potato peel starch. Kim and Hamdy (1985) achieved a dextrose equivalent of 84.2 using acid hydrolysis of sweet potato starch. The results obtained in this study for sweet potato peel hydroly-sis are therefore promising.
CONCLUSIONS
Response surface methodology was successfully applied to the two-step enzymatic hydrolysis of sweet potato peel. The maximum glucose concentra-tion obtained for the liquefacconcentra-tion step was 126.66 g/L
at time 60 min, α-amylase dose 1% (v/v) and
tem-perature 56.4 °C, while the glucose concentration increased to 178.39 g/L at time 60 min, glucoamy-lase dose 1% (v/v) and temperature 45 °C. The opti-mized liquefaction and saccharification conditions were validated with actual glucose concentrations of 126.03 and 176.89 g/L, respectively. Hence, the glucose syrup obtained in this work may serve as the sole carbon source for feeding many microorganisms and subsequently converted to useful products like citric acid, gluconic acid, oxalic acid and ethanol, among others.
ACKNOWLEDGEMENTS
E. Betiku is thankful to the World University Service, Germany, and the DAAD for equipment donation and provision of relevant literature, respectively.
REFERENCES
Azhar, A. and Hamdy, M. K., Alcohol fermentation of sweet potato. I. Acid hydrolysis and factors involved. Biotechnology and Bioengineering, 23, 879-886 (1981).
Betiku, E. and Ajala, O., Enzymatic hydrolysis of
breadfruit starch: Case study with utilization for gluconic acid production. Ife Journal of Tech-nology, 19, (1), 9-14 (2010).
Blanco, M., Coello, J., Iturriaga, H., Maspoch, S. and González Bañó, R., On-line monitoring of starch enzymatic hydrolysis by near infrared spectros-copy.Analyst, 125, 749-752 (2000).
Box, G. E. P. and Wilson, K. B., On the experi-mental attainment of optimum conditions (with discussion). Journal of the Royal Statistical Society Series B, 13, (1), 1-45 (1951).
Chaplin, M. and Bucke, C., Enzyme Technology. Cambridge University Press (1990).
Gerhartsz, W., Enzymes in starch processing. In:
Gerhartz, W. (Ed.), Enzymes in Industry Production and Applications, VCH, Weinheim, Germany, pp. 92-98 (1990).
Guan, X. and Yao, H., Optimization of viscozyme L-assisted extraction of oat bran protein using response surface methodology. Food Chemistry, 106, 345-351 (2008).
Kim, K. and Hamdy, M. K., Acid hydrolysis of sweet potato for ethanol production. Bio-technology and Bioengineering, 27, 316-320 (1985).
Kunamneni, A. and Singh, S., Response surface optimization of enzymatic hydrolysis of maize starch for higher glucose production. Biochemical Engineering Journal, 27, 179-190 (2005).
Miller, G. L., Use of dinitrosalicylic acid reagent for determination of reducing sugar. Analytical Chemistry, 31, 426-428 (1959).
Brazilian Journal of Chemical Engineering
Shariffa, Y. N., Karim, A. A., Fazilah, A. and Zaidul, I. S. M., Enzymatic hydrolysis of granular native and mildly heat-treated tapioca and sweet potato starches at sub-gelatinization temperature. Food Hydrocolloids, 23, (2), 434-440 (2009).
Vázquez, M., Delgado, R. and Castro, A. J., Modelling of the enzymatic hydrolysis of potato (Solanum tuberosum) using response surface methodology. Starch, 61, (10), 601-609 (2009).
Valetudie, J-C., Colonna, P., Bouchet, B. and Gallant, D. J., Hydrolysis of tropical tuber starches by bacterial and pancreatic α-amylases. Starch, 45, (8), 270-276 (1993).