Genetic Algorithm applied to
Traffic Control Problems
Jamil Kalil Naufal Jr. e João Batista Camargo Jr.
GAS - Grupo de Análise de Segurança
Departamento de Engenharia de Computação e Sistemas Digitais Escola Politécnica da Universidade de São Paulo Av. Prof. Luciano Gualberto, Travessa 3 - 158, sala C1-46 Cidade Universitária - CEP: 05508-900 - São Paulo / SP / Brasil
Phone: + 55 11 - 3091-5401
jamil.naufal@poli.usp.br; joao.camargo@poli.usp.br
(SCHWEFEL; HAMMEL; BÄCK, 1997) (GORDON;
WHTLEY, 1996). Among all the evolution of
computational techniques, genetic algorithms can be considered the most generic of them, where the target problem is resolved through evolution and selection according to the Ap test options available (FREGNI, 1997). The
solutions are represented by fix-length strings (sequence of characters or binary notation system) and are evaluated through the use of genetic operators, named crossover and mutation (BANZHAF; REEVES, 1999).
In genetic algorithms, the concepts of indi-vidual, organism and chromosome are equi-valent and correspond to possible solutions for a specific problem. Therefore, a population in genetic algorithms is composed of a chromo-some set, which is represented by a sequence of binary strings (bits). Each bit set as well as its position (locus) in the chromosome sequen-ce defines a characteristic of the organism identified as gene. The set of genes in a living thing will define its genotype (chromosome load). The values each gene can have is called Abstract: There are a great number of high complexity of real systems where the application of
advanced computational techniques is necessary in order to obtain good results within the available period of time. The complexity of such systems refers not only to the difficulty to identify all its constituent parts but also due to excessive computational efforts needed to reach a good response for them. This work presents a proposal for implementing the Artificial Intelligence technique called Genetic Algorithm, aiming to resolve a high complexity of real system, which is associated with the unbalance between the capacity and demand in the air transportation system.
Keywords: genetic algorithms, artificial intelligence, high complexity problems, unbalance between
capacity and demand, air transportation system.
1 INTRODUCTION
This study presents an application of the artificial intelligence technique, called genetic algorithm, in the resolution of a problem con-cerning the actual optimization of a high com-plex system focusing the aeronautical infra-structure demand. Section 2 shows a general view of Genetic Algorithms, a field of Artifici-al Intelligence. Section 3 explains the problem to be resolved. Section 4 presents details of the genetic algorithm and its appropriate par-ticularities for modeling and resolving pro-blems. Section 5 details the simulation. Finally, section 6 presents the main conclusions and comments about the results obtained when applied the queen-bee genetic algorithm for the resolution of the presented problem.
2 GENETIC ALGORITHMS
The concept of Genetic Algorithms was in-troduced (HOLLAND, 1961) and proposed as a
general model for the great majority of appli-cations related to optimization techniques
allele. The fitness function leading the evolu-tion process is the exteriorizaevolu-tion of the geno-type, also called the phenotype.
The roulette wheel selection method, also called proportional selection (fitness propor-tional), is the oldest selection method in use
and was proposed by John Holland (FREGNI,
1997). In this method, the reproduction selec-tion probability is proporselec-tional to the fitness value of each chromosome.
The concept is to imagine a roulette wheel where the size of each slice or sector is pro-portional to the fitness of each population chromosome. Therefore, each chromosome is mapped in a roulette slice. The larger the slice a chromosome occupies, the higher the proba-bility of this chromosome to be selected. Fi-gure 1 shows the roulette selection method.
In Figure 1, Psi is the selection probability of
chromosome i associated to the sector si of the
roulette. The selection of each reproductive chromosome corresponds to the generation of a random variable, va, between 0 and 1. The se-lected chromosome i will be the one presenting ni-1< va < ni where ni is the selection “accumulated
probability” to the chromosome i as a result of:
where n corresponds to the total chromosome number of the population.
The main phases of the genetic algorithms evolution process, from its initial population up to its final population, are following presen-ted as well as its relation with the crossover
Figure 1: Roulette Selection Method
and mutation operators. The final population is reached when there is evolution stagnation, the stop criterion for genetic algorithms.
a) Generation of the Initial Population
The initial population of chromosomes is randomly generated. This population is kept with constant size during all the evolution pro-cess of the genetic algorithm. Additionally, each chromosome fitness function is evaluated.
b) Chromosomes Selection Process
The process of roulette wheel selection cho-oses and makes a copy of the chromosomes that may or may not participate of the repro-ductive process, according to another given factor called reproduction ratio (tr).
Toward that, a random reproduction varia-ble (vr) is used. If the reproduction ratio is
equal or higher than the random reproduction variable, the copied chromosome is selected for the reproduction process. In this case, this chromosome copy is transferred for a queue structure, called parents queue. Otherwise, the copied chromosome is discarded.
This is a FIFO-kind queue (First in, First out). It is an important characteristic since all chromosomes within this structure are already in the right sequence to form pairs for applying the crossover operator.
When two sequentially selected chromoso-mes have the same phenotype (same fitness value) one of them is discarded. This must occur since the reproduction between identical chromosomes (incest) does not bring any be-nefits for the next generations. Avoiding incest does not represent any loss for the evolution process or for the population genetic diversity (CRAIGHURST; MARTIN, 1995).
c) Reproduction Process
This process is applied to the parent chro-mosomes according to the following steps:
c.1) Crossover
The chromosomes are separated in pairs according to the same parent sequence they were in the queue. The crossover operator is ni = Ps
Σ
k (equation 1) and Psi =1 (equation 2)i
k=1
Σ
n i=1
applied to these pairs. The application point (locus) of the crossover operator in these pairs is randomly determined and is the same in both paired chromosomes (GAMVROS, 2004). c.2) Mutation
Mutation operator can occur after the crosso-ver of the parent chromosomes. To define whether applying or not the mutation operator, a given factor called mutation ratio (tm) is used.
Added to that, a random mutation variable (vm)
is used. If the mutation ratio is equal or higher than the mutation random variable, the mutation operator will be applied to the offspring chro-mosome generated by the crossover. The muta-tion will be applied in a randomly selected site. Otherwise, the mutation operator would not be applied to the offspring chromosome that will be directly transferred to a population called intermediate. This intermediate population is the initial population for the next generation, resuming the evolution process.
d) Intermediate Population
The intermediate population is the next ge-neration population in the evolution process. This population is composed of three kinds of chromosomes:
d.1) Survival Chromosomes
Out of the best chromosomes, α % is prior selected and goes direct to the next generation without being submitted to the reproduction process. These chromosomes, together with the chromosomes generated by the reproduc-tion process, will compose the populareproduc-tion of the next generation. The survival chromoso-mes are important to guarantee the evolution of the population from generation to gene-ration. It assures to the next generation the fitness of the best chromosome to be at least equal to that of the last generation. This way, an involution process is avoided, that is, fitness oscillation of the best chromosomes will not be seen in the next generations.
d.2) Offspring Chromosomes by Crossover
These are the chromosomes generated only by the crossover operator.
d.3) Offspring Chromosomes by Crossover and Mutation
These are the chromosomes generated by the crossover and mutation operators. Obser-ve that the roulette wheel selection must be conducted in a number of times, enough to select the equivalent to (1 - α %) parent chromo-somes in every generation. The population size is constant from generation to generation in what concerns the genetic algorithms.
An increasing order rank of all chromoso-mes of the intermediate population is obtained considering the fitness value of each chro-mosome. This constitutes the population for the next generation, when evolution process is resumed.
e) Process Repetition
The genetic algorithm evolution occurs th-rough repeating items from b to d, until the stop criterion is reached. There are many kinds of stop criteria to be adopted (FREGNI, 1997).
The stability criterion was adopted in this stu-dy, considering there is n of the best non-mo-dified organisms during m generation, where n and m were given.
When using this kind of stop criterion, the optimization process may reach a good, when not an excellent level of optimization using less computer operations if compared to other cri-teria. In what concerns the stop criterion throu-gh the number of generations, for instance, the genetic algorithms evolve up to m genera-tions, where m is given. It is not possible to assure that the evolution process will find the best solution up to m generations. On the other hand, depending on the value of m, the convergence of the best solution can be reached much earlier than at m generations. Therefore, the time between reaching the best solution and m generations can be a waste. Figure 2 pre-sents the evolution for genetic algorithm.
3 PROBLEM TO BE RESOLVED
The forecast demand concerning airline companies is reached through flight schedu-les, supplied by the airline companies. Based
Figure 2: Evolution for Genetic Algorithm
on this forecast demand, a situation analysis diagram is formed for each sector and airport of the airspace infrastructure. Figure 3 presents a diagram of the situation analysis for a sector of São Paulo's terminal control area, in Brazil. The data for this diagram were supplied by
the Brazilian Air Route Traffic Control - CGNA ('Centro de Gerenciamento de Navegação Aérea'), located in São Jose dos Campos - SP, through its management system called SAS - AuATFM - FMP (Air Traffic Flow Management - Flow Management Point).
In its vertical axis, the diagram presents a forecast occupation of the airspace sector (air-space area in which the routes of aircrafts pass) or of the airports in each moment. Additionally, congestion, saturation and acceptable saturation lines are also represented. A sector is considered congested when its occupation presents from 80% to 100% compared to its declared nominal capacity. It is considered saturated when the de-mand exceeds its declared nominal capacity.
The declared nominal capacity of a sector can be defined, in generic way, as the number of aircrafts simultaneously managed by an air traffic controller, guaranteeing pre-established safety levels of air transportation systems.
The sector of Figure 3 is considered one of the most critical sectors concerning the amount of airspace traffic in São Paulo, when focusing terminal control areas (confluence areas around airports).
In the diagram, Figure 3, there are 3 defined horizontal lines representing traffic conges-tion levels (80% of the declared nominal capa-city of the sector), saturation levels (100% of
Non-optimized demand sector XP01
Figure 3: Diagram showing the situation analysis of non-optimized traffic demand
the declared nominal capacity of the sector) and acceptable saturation levels (120% of the declared nominal capacity of the sector). Abo-ve this acceptable saturation leAbo-vel, traffic is considered supersaturated, meaning that safe-ty levels for air transportation system can be no longer guaranteed.
Notice that the non-optimized demand chart shows the supersaturated area being exceeded several times. The nominal maxi-mum capacity of this sector is considered 8 aircrafts. We can observe, in certain moments, up to 14 aircrafts in this sector, simultaneously. The horizontal axis of the diagram brings the time period in which the situation analysis of a sector is conducted. Additional informa-tion as, for instance, the kind of aircraft, time of entering in the sector, identification of the busy sector, among others, are presented to offer more comprehensive details, allowing a deeper analysis of the situation concerning the airspace infrastructure.
It is quite clear that in several points of the diagram, the demand exceeds congestion and saturation lines. In actual terms, when
conges-tion line is exceeded, even if authorized, occu-pation may be used with restrictions, trying to keep up with the safety level requirements. In such events, the air traffic controller might have to take actions in order to keep up with acceptable safety levels. However, saturated sectors should always be avoided otherwise sa-fety levels are no longer guaranteed. Before becoming saturated, actions should be taken to balance traffic, reducing its demands to the declared nominal capacity of the sector.
The diagram of the situation analysis is the first approach of a situation that could happen in a given period of time previously chosen. In practical terms, this future situation could be altered, depending on the evaluation of this situation analysis diagram conducted by the air traffic managing sectors. In this evaluation, the air traffic-managing sector knows ahead of time the places and schedules of probable congestion, acceptable saturations and super-saturations (demand higher than 120% of the declared nominal capacity of the sector). The-refore, future problems can be foreseen and actions can be taken while scheduling flights. Today, the worse problem is that such correc-ting actions are taken considering only a spe-cific area, without considering its effect on other areas, that is, on the air traffic infra-structure as a whole.
Actually, these specific area actions aim to settle air traffic projected to a limited space, corresponding, at the most, to some airports and sectors presenting excessive traffic con-gestion (TERMINAL AREA CONGESTION, 2005).
Then, this specific area intervention approach is not ideal, solving only conges-tion problem at that specific point, and in some cases, could even cause worse pro-blems for the general context of the air traf-fic system.
4 MODEL OF GENERIC OPTIMIZATION
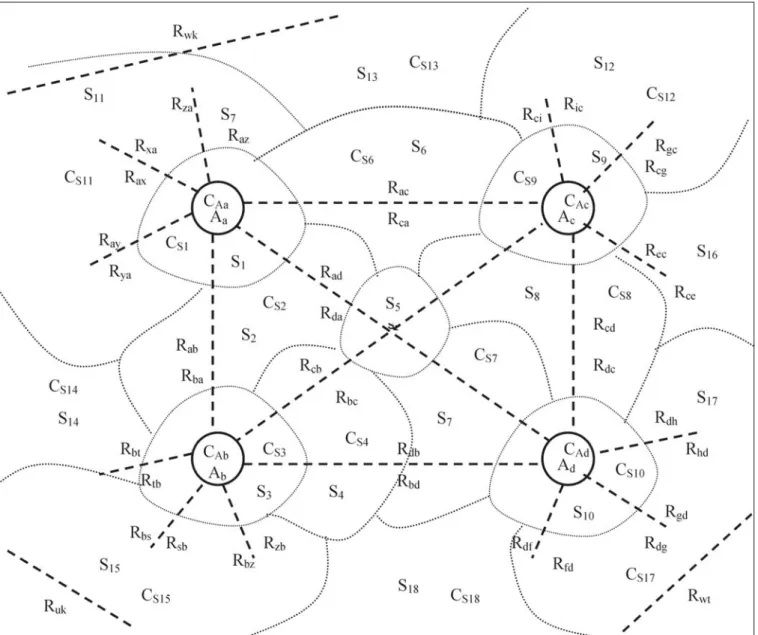
A model of generic air infrastructure is used as premise for applying the optimization me-thod through genetic algorithms, as shown in Figure 4.
The sector is a portion of the airspace, con-trolled by an air traffic controller. The objec-tive of the air traffic controller is to guarantee that, during the period of time that aircrafts are in his controlled sector, flights will be safe. Therefore, the aircrafts should be crossing that controlled sector with the lowest collision risk possible and safety-managing procedures should be precisely informed to other air traffic control sectors that may be involved.
The model of air traffic infrastructure uses a concept of declared nominal capacity refer-ring to the maximum number of aircrafts each sector or airport can hold, keeping up with acceptable safety levels. It is here assumed that the declared nominal capacity presents a fix value, determined and given in advance.
Aeronautical Scenario
Aeronautical scenario refers to a sequence of routes of the air traffic infrastructure occu-pied by aircrafts (flights) and evaluated during a period of time. This way, the aeronautical scenario points out the sequence of aircrafts traffic within the sectors and airports compo-sing several routes in use, at a certain period of time. An example of aeronautical scenario is presented below formed with a sequence of aircrafts and their respective traffic routes,
flight/route of AE1 flight/route of AE2 flight/route of AE3
flight/route of AE4 flight/route of AEt
Considering AE1 to AEt the operational
air-crafts in the aeronautical scenario during the period of time under evaluation.
4.2 Chromosome Description
The chromosome represents the set of all aircraft AEi (demand) contained in all the
chromo-Figure 4: Model of air traffic infrastructure
Considering: An: airport n; Rxy: route connecting airports x and y; St: sector t, and Ci: declared nominal capacity of the sector or
airport i.
4.3 Objective Function
The optimization process objective is to find the best demand distribution, which mini-mizes the Global Management Workload of the aeronautical scene, during a period of time in analysis. Thus, the Objective Function (OF), or fitness, is defined in relation to the Global Management Workload of the aeronautical sce-ne, privileging the safety requirements. some is a possible solution for the problem.
Figure 5 presents the chromosome used. Insi-de of the chromosome each airport An, or
sec-tor Sn, corresponds to a set of bits referring
the occupation time of each aircraft AEi inside
of the sector Sn or airport An. The
correspon-ding value of this set of bits represents the real time that each aircraft AEi will lead to cross
the sector Sn or will correspond to the delay in
the take-off in the airport An. The sets of bits
0000 and 1111 correspond respectively the mi-nimum (tmin) and maximum (tmax) esteem
ti-mes that aircraft AEi spend to cross the sector
Sn or to occupy the airport An.
OF maximize
Figure 5: Chromosome for the demand optimization model
The Global Management Workload (WL) of the aeronautical scene is given by:
WL aeronautical scene WL Sector n
The Management Workload of the sectors is given by:
being t1 and t2 the time intervals of simulation
considered in the demand analysis. The Instan-taneous Management Workload is given by:
WL instantaneous of the sector n
Being:
ESn = burst of the sector Sn, that is, demand
value (aircraft number) above 80% of the de-clared nominal capacity of sector n.
TDEn = duration time of the ESn.
The bases B1 and B2 must respectively be
esteem for ESn and TDEn, breaking of the
WL Sector n
WL instantaneous of the sector n
principle that, when ESn will be equal to 120%
of the declared nominal capacity of the sector, the TDEn duration will have to be equal to 12
minutes. (ICAO 9426, 2002).
5 SIMULATION OF AIRSPACE TRAFFIC INFRASTRUCTURE
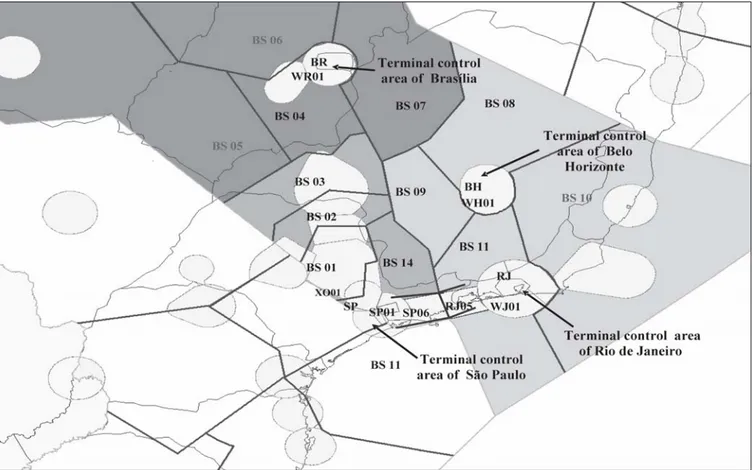
The airspace infrastructure simulated in the case study is shown in figure 6, reached in meetings and studies carried out with the Bra-zilian Air Route Traffic Control - CGNA (‘Cen-tro de Gerenciamento de Navegação Aérea’).
The airspace traffic infrastructure shown here presents the following units:
• Terminal Control Areas: sectors WH01, WR01, WJO1, SP01 (XP01 to XP05) and XQ01 corresponding respectively to Belo Horizon-te, Brasília, Rio de Janeiro and São Paulo. • Upper Airspace Traffic Area: sectors BS01,
BS02, BS03, BS04, BS07, BS08, BS09, BS11 and BS14. Sectors RJ05 and SP06 are also in the upper airspace traffic area and are used for non-stop flights between Rio de Janeiro and São Paulo.
5.1 Computational Environment for Simulation
The Laboratory for Advanced Scientific Computer Studies - LCCA (‘Laboratório de
Com-putação Científica Avançada’) of USP - University of São Paulo is a virtual lab counting with HPC - High Performance Computing available to all researchers of the University of São Paulo. Cluster ‘Alcateia’ is the computational environ-ment used in this study, composed of a main server, named ‘Alcateia’, and a stand-by cluster (redundant) for increasing the environmental availability. One of the servers of ‘Alcateia’ computational environment used in this study has the following configuration:
- Number of CPUs: 4
- Speed of the CPUs: Intel XEON 2.4 GHz - RAM: 2.5 GB
- Disk Memory: 72 GB
- SCSI (Small Computer System Interface) Disks Program Environment:
- Operational System: Linux - Program Language: C ANSI - Compiler: cc
5.2 Session and Set of Tests
The genetic algorithms can be classified as stochastic methods, in which the results of
Figure 6: Airspace traffic infrastructure under analysis
each simulation can be different. Due to these difficulties, concepts of session and set (set of tests) to define the cases of tests to be conduc-ted in the case study were adopconduc-ted:
• Set: a set of defined values
(configu-red) for the parameters of micro-calibration of a certain genetic algorithm. The set is defined by the parameters: ratios of survi-vors, reproduction, strong muta-tion, normal mutamuta-tion, strong mutation points, strong mutation probability, and population size. • Session: fix number of simulations with
the objective of resolving the pro-blem under evaluation.
Statistical methods are used considering the mean value, the standard deviation and inter-val inter-value to differentiate the sets and determi-ne the best among them.
For the queen-bee evolution for genetic algo-rithm, 32 sets were defined as shown in Table 1
Table 1: Sets for the genetic algorithm considering queen-bee evolution
Parameter Variation
Population size 250, 500 and 1000
Ratio of Survivors 2%
Points of Strong mutation 5 and 10 Ratio of Reproduction 70% and 90% Ratio of Normal Mutation 10% and 40% Probability of Normal Mutation 60% and 80% Probability of Strong Mutation 80% and 100%
The sets here presented were selected for po-pulation sizes of 250, 500 and 1000 chromo-somes.
6 CONCLUSION
The Figure 7 shows the situation diagram of the best optimization found. It can be now observed that the demand does not exceed more the saturation level, as occurred pre-viously in Figure 3, thus increasing conside-rably the aeronautical safety levels.
Optimized demand sector XP01
Figure 7: Diagram for situation analysis of the best optimization founded
It was observed that, in general, the proces-sing time approximately increases in li-near form with the population size. This fact can restrict it in some situations, mainly when the time for reaching a solution is vital. We must emphasize that the convergence time was in average, 6, 12 and 24 h for the populations of 250, 500 and 1000 chromosomes respectively.
It could be observed that the mutation operator presents high influence in the analy-zed problem, due to the high value used in the selected set (probabilities of Normal and Strong Mutation respectively equal to 60% and 80%). An explanation for the influence of this operator is the long chromosomal sequence composed of 35085 bits (5 bits for each time interval). This fact explains the use of the Evo-lution for Genetic Algorithms in evaluating this problem.
Genetic algorithms show a great potential for solving this and other kind of problems (DELAHAYE.
2005) concerning the airspace traffic systems needing a high potential of optimization.
7 REFERENCES
BANZHAF, W.; REEVES, C. Foundations of genetic
algorithms 5. Morgan Kaufmann Publishers, 1999. BODENHOFER, U. Genetic algorithms: Theory and
applications. Linz-Hagenberg: Lecture Notes, Third Edition, Winter 2004, Fuzzy Logic Labo-ratorium Linz-Hagenberg, 2004.
CARRASCO R.; CIPRIANO A.; CARELLI R., Nonlinear
state estimation in mobile and robots using a fuzzy observer, Departamento de Ingeniería Eléctrica Pontificia Universidad Católica de Chile, Chi-le, Instituto de Automática Universidad Nacio-nal de San Juan, Argentina, 2005.
CRAIGHURST S.; MARTIN, W. Enhancing genetic
al-gorithm Performance Through Crossover Prohibi-tions Based on Ancestry. In: CONFERENCE ON GENETIC Algorithms, 6. Proceedings. Morgan Kaufmann, San Mateo, 1995.
DELAHAYE D., OUSSEDIK S., STEPHANE P, Airspace
congestion smoothing by multi-objective genetic algorithm, Symposium on Applied Computing archive, Proceedings of the 2005 ACM sympo-sium on Applied computing table of contents, Santa Fe, New Mexico, 2005.
IDG NEWS SERVICE STORY. Compaq builds
super-computers for genomics research. Available on www.idg.net/idgns/2001/01/19/CompaqBuilds SupercomputerForGenomicsRese.shtml, 2001. Acess in 20/07/2004.
FREGNI, E. Architecture in the hybrid solution of
the problem of escalation of manufacturing 213 pages. Thesis (Doctorate), Department of Computing and Digital System Polytechnic College, University of São Paulo, 1997.
GAMVROS I.; GOLDEN B., Tutorial: Heuristic Search
for Network Design, University of Maryland, IFORMS Denver October 24, 2004
GORDON, V.S.; WHTLEY, D. Serial and parallel
genetic algorithms as function optimizers. Fort Collins: Colorado, Colorado State University, Department of Computer Science, 1996. HOLLAND, J. H. “Outline for a logical theory of
adaptive systems”. Massachusetts: Association Computer Machine, volume 3, pages 297-314, November 1961.
JUNG, S. H. Queen-bee evolution for genetic
algo-rithms. Electronics Letters, 20th March 2003, vol. 39, No.6, 2003.
KNOEZER, D. Perspectives for the future, looking
towards the challenges of the 21st century. DG Research - Aeronautics, Dayton, European Commission Research, July 2003.
QIN L. D.; Q. JIANF Y.; ZOU Z. Y.; CAO Y. J., A
queen-bee evolution based on genetic algorithm for economic power dispatch, Zhejiang University, Hangzhou 310027, China, 2005.
SCHWEFEL, H. P.; HAMMEL U.; BACK T. Evolutionary
computation: comments on the history and cur-rent state. IEEE Transactions on Evolutionary Computation, Vol. 1, N. 1, April 1997.
TERMINAL AREA CONGESTION, Term-2: Terminal
Airspace Redesign, National Airspace System, Operational Evolution Plan, version7.1, http:/ /www.faa.gov/programs/oep/v7/smart%20 sheets/term2%20terminal%20airspace%20 redesign.htm, September 26, 2005
SCHOFIELD, J. Airbus global market forecast.
Washing-ton DC: Aviation Forecast Conference, Airbus Industries of North America, March 7-8, 2000 TOMASSINI, M., Evolutionary algorithms.
Lau-sanne: Logic Systems Laboratory, Swiss federal Institute of Technology, Switzerland, 1996.