PROGRAMA DE PÓS GRADUAÇÃO EM ZOOLOGIA
BIOGEOGRAFIA E SISTEMÁTICA DE TRÊS ESPÉCIES DE
PEQUENOS MAMÍFEROS (RODENTIA E DIDELPHIMORPHIA)
DO CERRADO E CAATINGA
LEONARDO FERREIRA MACHADO
BIOGEOGRAFIA E SISTEMÁTICA DE TRÊS ESPÉCIES DE
PEQUENOS MAMÍFEROS (RODENTIA E DIDELPHIMORPHIA)
DO CERRADO E CAATINGA
LEONARDOFERREIRAMACHADO
TESE APRESENTADA AO PROGRAMA DE
PÓS-GRADUAÇÃO EM ZOOLOGIA, DO
INSTITUTO DE CIÊNCIAS BIOLÓGICAS DA
UNIVERSIDADEDEBRASÍLIA,COMOPARTE
DOS REQUISITOS PARA OBTENÇÃO DO
TÍTULODEDOUTOREMZOOLOGIA.
ORIENTADOR: PROF. DR. JADER MARINHO-FILHO
Departamento de Zoologia Programa de Pós-Graduação em Zoologia
Tese de Doutorado Leonardo Ferreira Machado
Título:
Biogeografia e sistemática de três espécies de pequenos mamíferos
(Rodentia e Didelphimorphia) do Cerrado e Caatinga
Banca Examinadora:
Prof. Dr. Jader Marinho-Filho Presidente / Orientador
ZOO/UnB
Prof. Dr. Alexandre Reis Percequilo Membro Titular
ESALQ/USP
Prof. Dr. Antônio Aguiar Membro Titular
ZOO/UnB
Profa. Dra. Lilian Gimenes Giugliano Membro Titular
GEM/UnB
Prof. Dr. Eliécer Gutiérrez Membro Titular
1 Papavero, N. & Teixeira, D. M. (2001). Os viajantes e a biogeografia: Hist́ria, Cîncias, Sáde-
Manguinhos, vol. VIII (suplemento), 1015-1037.
“...o verdadeiro mundo natural, feito de sil̂ncio, caos e noite antiga, prossegue t̃o hostil e ińspito quanto na aurora dos tempos, maldĩ̧o a ser combatida com todas as foŗas e todos os meios, por mais que os discursos vigentes afirmem o contŕrio. Apenas sua derrota permitiŕ a plenitude do mito, pois ́ em torno desse adverśrio vencido e inerme que se consolida a vis̃o id́lica da paisagem natural como um aut̂ntico jardim das deĺcias, fantasia constrúda sobre tristes remanescentes domesticados que variam entre a casa de campo, o bosque suburbano e o parque nacional”.
AGRADECIMENTOS
Agradeço à minha família pelo apoio e ensinamentos ao longo da vida.
Agradeço ao meu orientador Dr. Jader Marinho-Filho e ao meu coorientador Dr. Fernando Pacheco Rodrigues pela orientação, oportunidade de trabalhar em conjunto e pela confiança depositada em mim.
Aos colegas e amigos pela colaboração no primeiro capítulo da tese, Ana Carolina Loss, Emerson Monteiro Vieira e Anderson Paz.
Aos colegas e amigos do Laboratório e Coleção de Mamíferos da UnB e do Laboratótio de Genética e Biodiversidade agradeço pelo auxílio em laboratório e conversas sobre biogeografia, evolução e ecologia dos animais encontrados no Cerrado e biomas vizinhos.
Agradeço aos colegas e amigos que auxiliaram nas coletas de campo: Renato Rosa, Thales Magalhães, Tiago, Nárjara Veras, Lilian e Arthur.
Agradeço à Dra. Alexandra Bezerra, Dra. Ana Paula Carmignotto e Dra. Leonora Costa pela doação de tecidos de espécimes estudadas na presente tese.
Aos amigos e colegas Dr. Fabrícius Domingos e Dr. Yuri Luiz Reis Leite pelas valiosas sugestões e conselhos sobre análises e comentários sobre o trabalho.
Ao Programa de Pós Graduação em Zoologia da Universidade de Brasília pelo apoio. À Coordenã̧o de Aperfei̧oamento de Pessoal de Ńvel Superior pela bolsa de doutorado e ao Instituto Chico Mendes de Conservã̧o da Biodiversidade – ICMBio, pela autorização de captura e coleta de espécimes.
Por fim, agradeço a todas as pessoas que de alguma forma contribuíram para que eu atingisse mais um objetivo na minha vida.
6 SUMÁRIO AGRADECIMENTOS ... 5 RESUMO ... 7 ABSTRACT ... 8 LISTA DE FIGURAS ... 9 LISTA DE TABELAS ... 11 INTRODUÇÃO GERAL ... 12 Referências bibliográficas ... 15
Capítulo 1: A new species of tree rat (Phyllomys, Echimyidae) from Brazilian Cerrado supports Miocene connection between Amazon and Atlantic forests ... 17
RESUMO ... 18
ABSTRACT ... 19
Introduction ... 20
Material and methods ... 22
Results ... 26 Discussion ... 42 References ... 47 Appendix 1.1 ... 54 Appendix 2.1 ... 58 Appendix 3.1 ... 59 Appendix 4.1 ... 60 Appendix 5.1 ... 61
Capítulo 2: Filogeografia e delimitação de espécies em Gracilinanus agilis (Didelphimorphia, Didelphidae) nos biomas Cerrado e Caatinga ... 72
Introdução ... 73 Materiais e Métodos ... 75 Resultados ... 80 Discussão ... 86 Referências bibliográficas ... 90 Anexo 1.2 ... 96 Anexo 2.2 ... 97 Anexo 3.2. ... 101 Anexo 4.2 ... 104
Capítulo 3: Expansão demográfica de Calomys tener (Rodentia, Cricetidae) durante o Quaternário tardio no Cerrado: respostas ao efeito do fogo e ocupação humana pré-histórica ... 105 Introdução ... 106 Materiais e métodos ... 107 Resultados ... 114 Discussão ... 120 Referências bibliográficas ... 122 Anexo 1.3. ... 127 Anexo 2.3. ... 129 CONSIDERAÇÕES FINAIS... 130
RESUMO
Os domínios morfoclimáticos da Caatinga e do Cerrado possuem características únicas tanto em termos climáticos, quanto físicos e biológicos. Apresentam ambientes e fitofisionomias particulares que sofreram alterações históricas em seus limites de distribuição geográfica em consequência de mudanças climáticas, eventos geológicos e até mesmo devido a ocupação humana e efeitos de queimadas. Apesar deste passado dinâmico, a história evolutiva e a diversificação dos organismos com distribuição nestes ambientes são pouco exploradas em estudos modernos que utilizam sequências de DNA e métodos biogeográficos, filogeográficos e de demografia histórica. Esta condição é ainda mais evidente em relação aos roedores e marsupiais de pequeno porte, que apesar de serem os grupos de mamíferos com maior diversidade de espécies da América do Sul, são pouco representados em investigações sobre suas diversificações e relações históricas com o Cerrado e a Caatinga. É neste contexto que a presente tese procura contribuir. Foram utilizadas sequências de DNA e métodos filogenéticos e filogeográficos para investigar a relação entre a diversificação de espécies de pequenos mamíferos com a evolução de seus habitats inseridos em fitofisionomias do Cerrado e Caatinga. O primeiro capítulo explora hipóteses filogenéticas e biogeográficas no gênero Phyllomys e contém a descrição de uma nova espécie com distribuição em matas de galerias do Cerrado e áreas de transição com a Floresta Atlântica. Além disso, com base em análise de distribuição ancestral de Phyllomys e outros gêneros distribuídos na Amazônia,é proposta uma hipótese de que habitats apropriados para a ocorrência de ratos de espinho arborícolas se estendiam na atual região sul e central do Cerrado promovendo uma conexão entre Amazônia e Floresta Atlântica durante o Mioceno. O segundo capítulo investiga as relações filogeográficas entre populações de Gracilianus agilis da Caatinga e Cerrado. Propõe que as alterações demográficas sofridas por esta espécie tem relação com a evolução das Matas Secas da região e que G. agilis pode abrigar mais de uma espécie. Por último, o terceiro capítulo avalia se houve alterações demográficas ao longo do tempo em populações de Calomys tener e propõe que eventos de fogo e a ocupação humana na região do Cerrado são fatores que alteram a paisagem natural, criando habitats que possibilitaram o crescimento populacional desta espécie.
8
ABSTRACT
The morphoclimatic domains of Cerrado and Caatinga are unique in terms of biotic, climatic, and geological features. The phytophysiognomies of Cerrado and Caatinga suffered multiple changes in theirs geographic distribution during the last millions years as a consequence of climatic and geologic modifications, fire in natural environments, and pre-historic human settlements. However, the diversification and historical evolution of organisms distributed in these regions are poorly studied. This is much more clearly if one tries to find Cerrado and Caatinga biogeographical studies based in small mammals (rodents and marsupials) as models, and using modern phylogenetic and phylogeographic methods. In this thesis, I used DNA sequences and phylogenetic and phylogeographic methods to investigate small mammals evolution and theirs relationship with the Cerrado and Caatinga phytofisiognomies. The first chapter propose phylogenetic and biogeographic hypothesis for the genus Phyllomys. It contains a description of a new species of Phyllomys and a hypothesis of past link between Amazon and Atlantic forest of South America through where the central/southern Cerrado biome is today. The second chapter investigates phylogeographical relationships of Gracilinanus agilis populations distributed in the Cerrado and Caatinga. I propose that historical expansions and retractions of dry forests of Cerrado and Caatinga are drivers for the diversification of this species, and that populations under G. agilis may represent more than one species. The third chapter focus on historical demographic changes in populations of Calomys tener. The results indicates that burning in natural areas, as well as the pre-historic human settlements may have favored the population expansion of Calomys tener during the late Quaternary.
LISTA DE FIGURAS
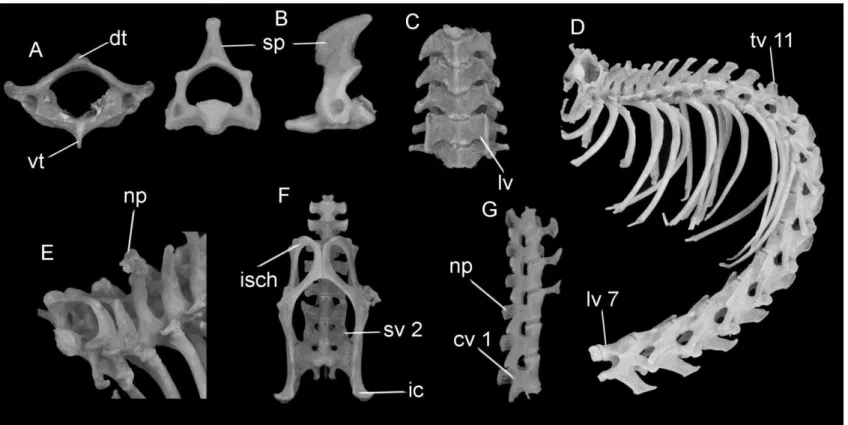
Figure 1.1: Bayesian inference phylogram 1 based on concatenated (vWF, GHR, RAG1, COI, and Cytb) molecular data set. Numbers near nodes represent Bayesian posterior probabilities. ... 28 Figure 2.1: Live holotype of Phyllomys centralis sp. n. (UNB 3820) after been captured in a live trap installed in a canopy of gallery forest located in the southern portion of APA Gama Cabeça-de-Veado - Federal District, central Brazil. Foto: André Mendonça. ... 30 Figure 3.1: Dorsal and ventral views of skins of specimens of Phyllomys centralis sp. n. The holotype (UNB 3820 - above), and two paratypes (MCN-M 2709 - center; MCN-M 2027 - below). Scale bar = 11cm ... 32 Figure 4.1: Dorsal, ventral, and lateral views of skull and lateral view of mandible of holotype of Phyllomys centralis sp. n. - UNB 3820. (scale bar = 1cm). ... 34 Figure 5.1: Right mandibular (left) and maxillary toothrows of Phyllomys centralis sp. n. (paratype MCN-M2709). ... 34 Figure 6.1: Post cranium axial skeleton of Phyllomys centralis sp. n. A – atlas: dorsal tubercle (dt) and ventral tubercle (vt); B – axis: spinous process (sp); C – cervical vertebrae: lamina ventralis (lv) of the sixth cervical vertebra; E – neural process (np) of second thoraxic vertebra; D – the eleventh thoracic vertebra (tv11), and the seventh lumbar vertebra (lv7); F – second sacral vertebra (sv2), ischium (isch), and iliac crest (ic); G – first caudal vertebra (cv1), neural process (np). ... 35 Figure 7.1: Sternum region and appendicular skeleton of Phyllomys centralis sp. n. A – sternum region: sternebrae (ste), manubrium (man), and xiphisternum (xiphi); B – scapula: infraspinous fossa (if), supraspinal fossa (sf); C – humerus: deltoid tuberosity (dt); D – radio and ulna: olecranon process (op), and trochlear notch (tn); E – femur: greater trochanter (gt), head of femur (hf), and lesser trochanter (lt); F – tibia and fibula; G – manus; H – pes. ... 36 Figure 8.1: Molecular dating chronogram of Phyllomys inferred from concatenated genes (vWF, GHR, RAG1, and Cytb). Horizontal bars represent 95% credibility intervals for time estimates. ... 40 Figure 9.1: Map of South America showing the limits of the Cerrado, Amazon, and Atlantic Forest biomes. The Atlantic Forest is depicted in sub-regions (see Material and methods for detail). The red polygon refer to the geographic distribution of Phyllomys blainvilii, which is distributed in the relict of Atlantic Forest (Brejos). White star and circles represent collection localities of specimens of Phyllomys centralis sp. n. used in molecular analyses. White star represent the type locality (Brasília, Federal District – Brazil) of Phyllomys centralis sp. n. The chronogram is the result of molecular dating analysis inferred from concatenated genes (vWF, GHR, RAG1, and Cytb). Colored circles near terminal names refers to geographical distribution of each taxon accordingly to associated biomes. Pie chart shows approximate probabilities of ancestral area distribution (only areas with probabilities higher than 30% are shown). Geological time limits are based in Gibbard et al. (2010). ... 41 Figura 1.2: A) Grupos genéticos indicados pela análise no programa BAPS; B) Filograma resultante da análise filogenética com base em sequências do cyt-b realizada no programa MrBayes. Nós com círculo preto apresentam
10
probabilidade posterior > 0,95; C) Mapa mostrando Cerrado em bege, Caatinga em marrom e rio São Francisco em cinza. Cores das barras em figura A e dos terminais da filogenia em B indicam correspondência com as localidades de mesma coloração da figura C. ... 82 Figura 2.2: A) Filogenias de genes nucleares, da esquerda para direita: OGT, P4HB e PPIC. Nós com círculo em preto significam probabilidade superior > 0,95; B) Filogenia de espécies (cytb e PPIC): terminais A, B e C são populações derivadas das localidades correspondentes na figura C. C) mapa indicando localidades de origem das sequências analisadas nas árvores de gene e de espécie. Caatinga em marrom e Cerrado em bege. ... 83 Figura 3.2: Tamanho efetivo populacional através do tempo das populações A (esquerda), B (centro), C (direita) de G. agilis com base em Bayesian Skyline Plots. Área em azul representa intervalo de 95% de HPD. ... 85 Figura 1.3: Mapa destacando a região do Cerrado e pontos de coleta de espécimes de Calomys tener utilizados nas análises. ... 109 Figura 2.3: Modelos demográficos históricos de populações de C. tener testados no programa DIYABC. 1) população grande sem alteração demográfica ao longo do tempo; 2) população pequena sem alteração demográfica; 3) expansão demográfica no começo do Holoceno coincidindo com ocupação humana e registro de fogo no Cerrado – clima seco; 4) expansão demográfica há 32.000 anos atrás devido a existência de um Cerrado antigo frequentemente atingido por fogo – clima seco; 5) expansão demográfica a partir do último máximo interglacial, modelo alternativo – clima quente e úmido. Ne = tamanho da população efetiva. Tempo fora de escala. ... 113 Figura 3.3: Redes de haplótipos com base nos marcadores ADH (A), Bfib (B) e cyt-b (C). Cada círculo representa um haplótipo. Quanto maior o tamanho do círculo maior o número de amostras apresentando o mesmo haplótipo. Cores representam localidades de coleta de acordo com a legenda a direita. Traços nos braços que ligam haplótipos representam números de mutações ... 115 Figura 4.3: Filogenias resultantes da análise bayesianas com base em sequências do cyt-b (A), ADH (B) e Bfib (C). Retângulos indicam exemplares de Calomys tener (grupo interno). Probabilidade posterior (pp) para o monofiletismo de C. tener: pp=1 para cyt-b e ADH e pp=0.67 Bfib. ... 116 Figura 5.3: Tamanho efetivo populacional através do tempo estimado com sequências do cyt-b de C. tener com base em Bayesian Skyline Plots. Área em azul representa intervalo de 95% de HPD. ... 117 Figura 6.3: Árvore de espécies utilizando sequências de todos os marcadores (cyt-b, ADH e Bfib) e datação molecular. Número próximo ao nó significa probabilidade posterior. Probabilidade abaixo de 0,9 não apresentada. ... 118 Figura 7.3: Plots do algoritmo de regressão logística para cada cenário demográfico estimado no programa DIYABC. Modelos 3 e 4 com maiores valores de probabilidade posterior. ... 119
LISTA DE TABELAS
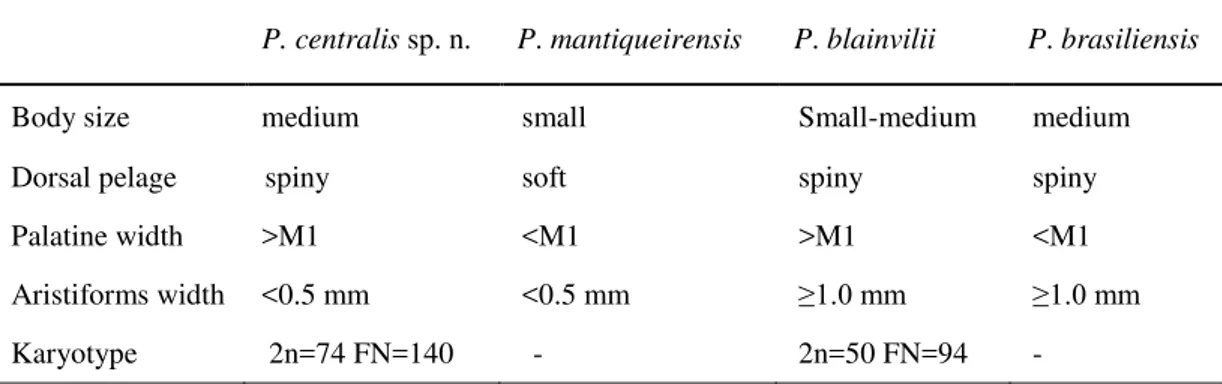
Table 1.1: Cranial measurements of Phyllomys centralis sp. n. (UNB 3820, MCN-M2709, and MCN-M2153), Phyllomys blainvilii, and Phyllomys brasiliensis. Measurements taken from Phyllomys blainvilii, and Phyllomys brasiliensis were taken from Leite (2003). ... 37 Table 2.1: Table showing selected characters used to delimit P. centralis sp. n. in
relation to the sister species (P. mantiqueirensis) and species with similar geographic distribution: P. blainvilii and P.
brasiliensis...39 Tabela 1.2: Resultados obtidos nos testes de desvios do modelo neutro de evolução para as diferentes populações encontradas. Indicadores estatísticos utilizados: D Tajima, Fs Fu e R2 Ramos-Onsins and Rozas. ... 84
Tabela 1.3: Valores das estatísticas D de Tagima, Fs de Fu e R2 de Ramos-Onsins e
Rozas, que testam desvios do modelo neutro de evolução. Asterisco indica probabilidade < 0,05 ... 118
12
INTRODUÇÃO GERAL
O corredor de formações abertas da América do Sul forma uma diagonal de ambiente secos composta pela Caatinga no nordeste do Brasil, Cerrado no Brasil central e Chaco, que ocupa porções da Argentina, Paraguai e Bolívia (Werneck, 2011). Em especial, o Cerrado e a Caatinga possuem características climáticas, geológicas e biológicas únicas (Ab’Sáber, 2000) e isolam as duas maiores regiões de florestas úmidas da América do Sul, Amazônia e Floresta Atlântica. A Caatinga é formada em grande parte por florestas decíduas (matas secas) e considerada como maior remanescente de uma vegetação estabelecida de maneira relictual na América do Sul, América Central e sul da América do Norte (Prado & Gibbs, 1993). O Cerrado, por sua vez, é caracterizado por um gradiente horizontal de fitofisionomias e basicamente composto por savanas, campos, matas secas e florestas de galerias (Ratter et al. 1997; Ribeiro & Walter 2008). Em especial, as florestas de galerias do Cerrado compartilham componentes vegetais com a Amazônia no norte/nordeste e com Floresta Atlântica no sul/sudeste (Oliveira-Filho & Ratter 1995) formando corredores de vegetação mais úmida ocupados por organismos autóctones e derivados dos biomas vizinhos. Além disso, são propostas conexões históricas entre florestas da Amazônia e Floresta Atlântica em regiões em que hoje em dia o Cerrado e a Caatinga estão estabelecidos (Oliveira-Filho & Ratter 1995). Eventos de contato e isolamento entre estas florestas estariam relacionados com o histórico de retrações e expansões ao longo do tempo das fitofisionomias do Cerrado e da Caatinga que ocorreram em função de mudanças climáticas e geológicas (Andrade-Lima, 1982; Auler et al. 2004; Bigarella et al. 1975; Rizzini, 1963; Werneck et al. 2011). Esta dinâmica histórica estabelece um complexo cenário evolutivo para a biota destas regiões pouco explorado em estudos biogeográficos (Werneck, 2011).
Informações provenientes de sequências de DNA representam dados robustos para estudos biogeográficos. A filogeografia é uma disciplina que faz uso deste conjunto de dados e permite inferir processos evolutivos intraespecíficos e analisar a estruturação geográfica com base em genealogias (Avise et al. 1987). Uma derivação desta disciplina, a demografia histórica, permite testar cenários de contato entre populações, expansão e retração demográfica ao longo do tempo fornecendo indícios da ocorrência de seleção natural, deriva e gargalos genéticos numa perspectiva geográfica (Avise, 2009; Hickerson et al. 2010). Além disso, sequências de DNA viabilizam estudos de biogeografia histórica (Yu et al. 2010; Yu et al. 2015) e datação
molecular (Drummond et al. 2006), permitindo compreender quais seriam as áreas de distribuição dos ancestrais de táxons viventes e em que épocas ocorreram os eventos de diversificação, dispersão e extinção que foram determinantes para a configuração do cenário biogeográfico atual. A aplicação de tais métodos com base em sequências de DNA pode contribuir decisivamente para o entendimento da história biogeográfica das formações abertas da diagonal seca, bem como permitir o teste de hipóteses propostas em estudos pioneiros na região (e.g. Werneck et al. 2011).
Pequenos mamíferos das ordens Didelphimorphia e Rodentia representam os grupos com maior diversidade de espécies da América do Sul (Gardner & Creighton, 2007; Lessa et al. 2014, Patton et al. 2015) e com grande número de gêneros e espécies endêmicas da Caatinga e Cerrado (Carmignotto et al. 2012). Pequenos roedores e marsupiais tem servido de modelos de estudo para investigações biogeográficas em escalas regional (Giarla et al. 2014), continental (Leite et al. 2014) e global (Schenk et al. 2013). Contudo, hipóteses filogeográficas e de demografia histórica no Cerrado e Caatinga utilizando estes grupos como modelos são escassas, podendo ser enumeradas algumas poucas pesquisas com Calomys (Almeida et al. 2007; Nascimento et al. 2011), Trichomys (Nascimento et al. 2013) e Gracilinanus agilis (Faria et al. 2013). Neste contexto, estudos que relacionem a dinâmica evolutiva do Cerrado e Caatinga com evidências de estruturação genética e diversificação de pequenos mamíferos é uma demanda evidente e um campo pouco investigado nas formações vegetais da diagonal de ambientes secos.
O objetivo da presente tese foi investigar a diversificação de pequenos mamíferos no Cerrado, Caatinga e florestas de galeria do Cerrado e suas conexões com Amazônia e Floresta Atlântica. Para isso utilizou-se dados de sequências de DNA e métodos filogeográficos, demografia histórica, datação molecular e biogeografia histórica tendo como grupos de estudo as espécies Calomys tener (Rodentia, Cricetidae), Gracilinanus agilis (Didelphimorphia, Didelphidae) e o gênero Phyllomys (Rodentia, Echimyidae). A obtenção de amostras foi conduzida através de coletas em campo em diversas localidades inseridas no Cerrado e adjacências deste bioma, precisamente nas seguintes localidades: Parque Nacional (PARNA) de Emas – GO; PARNA da Chapada dos Guimarães – MT; PARNA Serra da Canastra – MG; PARNA Grande Sertão Veredas – BA, MG; PARNA do Araguaia – TO; PARNA Chapada das Mesas – MA; Parque Estadual Serra de Ricardo Franco – MT; e região do rio das Mortes, nas proximidades do município de Nova Xavantina –
14
MT. Adicionalmente, por meio de doações de colegas e coleções científicas, foram obtidas amostras de tecidos de animais de diversas outras localidades compreendendo um conjunto de dados totalmente original e representativo em relação ao conhecimento da distribuição geográfica dos organismos estudados.
A tese está estruturada em três capítulos. O primeiro trata da biogeografia histórica do gênero Phyllomys e descreve uma espécie nova para a região do Cerrado e áreas de transição com a Floresta Atlântica. O segundo capítulo investiga as relações entre estruturação geográfica de populações de G. agilis do Cerrado e Caatinga e a dinâmica histórica de expansões e retrações das Matas Secas, principal habitat desta espécie. Por último, o terceiro capítulo avalia se houve alterações demográficas ao longo do tempo em populações de C. tener no Cerrado, e se tais alterações tem relação com a incidência de fogo em seu habitat.
Referências bibliográficas
Ab’Sáber, A. N. (2000). The natural organization of Brazilian inter-and subtropical landscapes. Revista Do Instituto Geológico, 21, 57–70.
Andrade-Lima, D. de. (1982). Present-day forest refuges in northeastern Brazil. In G. T. Prance (Ed.), Biological diversification in the Tropics (pp. 245–251). New Yourk: Columbia University Press.
Auler, A. S., Wang, X., Edwards, R. L., Cheng, H., Cristalli, P. S., Smart, P. L., & Richards, D. A. (2004). Quarternary ecological and geomorphic changes associated with rainfall events in presently semi-arid northeastern Brazil. Journal of Quaternary Science, 19, 693–701.
Avise, J. C. (2009). Phylogeography: retrospect and prospect. Journal of Biogeography, 36, 3–15.
Avise, J. C., Arnold, J., Ball, R. M., Bermingham, E., Lamb, T., Neigel, J. E., … Saunders, N. C. (1987). Intraspecific Phylogeography: The Mitochondrial DNA Bridge Between Population Genetics and Systematics. Annual Review of Ecology and Systematics, 18, 489–522.
Bigarella, J. J., Andrade-Lima, D. de, & Riehs, P. J. (1975). Considerações a respeito das mudanças paleoambientais na distribuição de algumas espécies vegetais e animais no Brasil. In J. J. Bigarella & R. D. Becker (Eds.), Simpósio internacional sobre o Quaternário (47th ed., pp. 411–464). Curitiba - Porto Alegre: Anais da Academia Brasileira de Ciências.
Carmignotto, A. P., Vivo, M. De, & Langguth, A. (2012). Mammals of the Cerrado and Caatinga: distribution patterns of the tropical open biomes of central South America. In B. D. Patterson & L. P. Costa (Eds.), Bones, clones and biomes. The history and geography of recent Neotropical mammals (pp. 307–350). Chicago, Illinois: University of Chicago Press.
Drummond, A. J., Ho, S. Y. W., Phillips, M. J., & Rambaut, A. (2006). Relaxed phylogenetics and dating with confidence. PLoS Biology, 4, 699–710.
Faria, M. B., Nascimento, F. F., Oliveira, J. A., & Bonvicino, C. R. (2013). Biogeographic determinants of genetic diversification in the mouse opossum Gracilinanus agilis (Didelphimorphia: Didelphidae ). Journal of Heredity, 104, 613–626.
Giarla, T. C., Voss, R. S., & Jansa, S. A. (2014). Molecular Phylogenetics and Evolution Hidden diversity in the Andes : Comparison of species delimitation methods in montane marsupials. Molecular Phylogenetics and Evolution, 70, 137–151.
Hickerson, M. J., Carstens, B. C., Cavender-Bares, J., Crandall, K. a, Graham, C. H., Johnson, J. B., … Yoder, a D. (2010). Phylogeography’s past, present, and future: 10 years after Avise, 2000. Molecular Phylogenetics and Evolution, 54, 291–301.
Leite, R. N., Kolokotronis, S., Almeida, F. C., Werneck, F. P., Rogers, D. S., & Weksler, M. (2014). In the wake of invasion: tracing the historical biogeography of the South American cricetid radiation. Plos One, 9, 1–12.
16
America: transitioning into the genomics era. Frontiers in Ecology and Evolution, 2, 1–7.
Nascimento, F. F., Lazar, A., Menezes, A. N., Durans, M., Moreira, J. C., Salazar-Bravo, J., … Bonvicino, C. R. (2013). The role of historical barriers in the diversification processes in open vegetation formations during the Miocene/Pliocene using an ancient rodent lineage as a model. Plos One, 8, 1–13. Oliveira-Filho, A. T., & Ratter, J. A. (1995). A study of the origin of central brazilian
forests by the analysis of plant species distribution patterns. Edinburg Journal of Botany.
Patton, J. L., Pardiñas, U. F. J. & D'Elía, G. (2015). Mammals of South America, Volume 2: Rodents. University of Chicago Press. Chigago (1384 pages)
Prado, D. E., & Gibbs, P. E. (1993). Patterns of species distribution in the Dry Seasonal Forest of South America. Annals of the Missouri Botanical Garden, 80, 902–927.
Ratter, J. A., Ribeiro, J. F., & S., B. (1997). The Brazilian Cerrado Vegetation and Threats to its Biodiversity. Annals of Botany, 80, 223–230.
Rizzini, C. T. (1963). Nota prévia sobre a divisão fitogeográfica do Brasil. Revista Brasileira de Geografia, 1, 3–64.
Schenk, J. J., Rowe, K. C., & Steppan, S. J. (2013). Ecological opportunity and incumbency in the diversification of repeated continental colonizations by Muroid rodents. Systematic Biology, 62, 837–640.
Werneck, F. P. (2011). The diversification of eastern South American open vegetation biomes: Historical biogeography and perspectives. Quaternary Science Reviews, 30, 1630–1648.
Werneck, F. P., Costa, G. C., Colli, G. R., Prado, D. E., & Sites Jr, J. W. (2011). Revisiting the historical distribution of Seasonally Dry Tropical Forests: new insights based on palaeodistribution modelling and palynological evidences. Global Ecology and Biogeography, 20, 272–288.
Yu, Y., Harris, A. J., Blair, C., & He, X. (2015). RASP (Reconstruct Ancestral State in Phylogenies): a tool for historical biogeography. Molecular Phylogenetics and Evolution, 87, 46–49.
Yu, Y., Harris, A. J., & He, X. (2010). Molecular Phylogenetics and Evolution S-DIVA (Statistical Dispersal-Vicariance Analysis): A tool for inferring biogeographic histories. Molecular Phylogenetics and Evolution, 56, 848–850.
Capítulo 1
A new species of tree rat (Phyllomys, Echimiydae) from Brazilian Cerrado supports Miocene connection between Amazon and Atlantic forests
18
RESUMO
As florestas de galeria localizadas no Cerrado do Brasil central possuem intensa presença de elementos vegetais da Amazônia e da Floresta Atlântica. Diversas hipóteses são propostas sobre conexões históricas entre Amazônia e Floresta Atlântica em locais onde hoje o Cerrado e a Caatinga estão estabelecidos, e que tais conexões seriam determinantes para a diversificação de organismos presentes nestas regiões. Neste estudo foram investigadas as relações filogenéticas do rato de espinho da Floresta Atlântica (Phyllomys, Echimyidae) e feita a descrição de uma nova espécie oriunda de florestas de galerias do Cerrado e áreas de transição entre Cerrado e Floresta Atlântica. Foram realizadas análises de datação molecular e distribuição geográfica dos ancestrais das espécies viventes de Phyllomys e grupos externos (Echimys e Makalata) distribuídos na Amazônia, com o objetivo de gerar hipóteses sobre possíveis rotas de dispersão e locais que poderiam abrigar conexão entre a Floresta Atlântica e a Amazônia. Durante o Mioceno, o ancestral comum mais recente de Phyllomys e Echimys provavelmente ocupava a região em que hoje está situada a porção central/sul do Cerrado, enquanto que a maioria dos eventos de diversificação em Phyllomys ocorreram durante o Plioceno e Pleistoceno. Os resultados indicam uma possível existência de conexão florestal durante o Mioceno entre Amazônia e Floresta Atlânica na região atual central/sul do Cerrado, favorecendo uma hipótese de conexão pretérita nesta região entre as duas formações florestais. A espécie nova de Phyllomys é a única do gênero com distribuição na região core do Cerrado, indicando que houve uma especiação in situ de uma linhagem derivada de divergência antiga na árvore de Phyllomys e implicando em expansões e contrações de florestas durante o período Terciário.
ABSTRACT
The gallery forests in the Brazilian Cerrado, a vast tropical savanna in South America and a biodiversity hotspot, are composed by biotic elements derived from the adjacent Amazon (AM) and the Atlantic Forest (AF) biomes. Past connections between AM and AF took place through the region where the dry Cerrado and Caatinga domains occur today. Here we describe and name a new species of Atlantic Forest tree rat, Phyllomys centralis sp. n., from the gallery forests of the Cerrado and transitional areas. We inferred molecular phylogenies, divergence dates, and ancestral ranges of Phyllomys species and their close relatives from the AM, Echimys and Makalata. The most recent common ancestor of Phyllomys and Echimys probably occupied the central/southern region of the Cerrado during the Miocene, while the diversification within Phyllomys species in the AF occurred during the Plio-Pleistocene. These results favor the hypothesis of a past link between AM and AF where the central/southern Cerrado biome is today. The new species found in the gallery forests of Cerrado indicate in situ speciation of a lineage derived from an ancient divergence and implying that forest expansion and contractions occurred during the Tertiary.
20
Introduction
The Amazon (AM) and Atlantic Forest (AF) in South America are separated by a “diagonal of open formations” (Ab’Sáber 1977), a corridor of drylands composed by the Argentinean and Paraguayan Chaco, the Caatinga in north-eastern Brazil, and the Cerrado. The Cerrado domain lies over 2,000,000 km2 in central Brazil with, basically, three main vegetation types: savannas, dry forests (both deciduous and semi-deciduous forests), and gallery forests (Ratter et al. 1997; Ribeiro & Walter 2008). In particular, floristic elements from forested formations of the Cerrado are shared with the AM in the north/west and with AF at east/southern portion of the Cerrado (Oliveira-Filho & Ratter 1995).
There is evidence indicating biotic similarities between AF and central Brazilian forests that extend over the Cerrado, leading to the hypothesis of a past forest link between AM and AF (Rizzini 1963; Oliveira-Filho & Ratter 1995). Recent studies reinforced this idea by showing phylogeographic affinities between forest trees from AF and gallery forests of Cerrado (Ramos et al. 2009), bird lineages shared by AF and Cerrado gallery forests (Silva 1997), and sister group relationships among lineages of mammals (Costa 2003) and amphibians (Fouquet et al. 2012) distributed in AM and AF. Time and place where the connections between AM, AF, and Cerrado forests occured are variable, indicating a number of events of expansions and retractions of forested and non-forested environments during the Tertiary and Quaternary (e.g. Oliveira-Filho & Ratter 1995; Auler et al. 2004). Basically, there are three main hypothetic routes that likely played a role in the dynamics of contacts between AF and AM: the northeastern route (Bigarella et al. 1975; Andrade-Lima 1982; Auler et al. 2004; Wang et al. 2004) where the semi-arid Caatinga is nowadays the dominant ecosystem; the central route which could have run through central Brazil, either as a continuous forest corridor or as a series of forest patches (Por 1992; Oliveira-Filho & Ratter 1995; Costa 2003); and the southern route (Por 1992; Costa 2003; Batalha-Filho et al. 2013), where organisms from AF could have reached Amazonian formations through the Paraná hydrographic basin (Por 1992).
A clear case of sister lineages with disjunct distributions in the AM and AF occurs within the tree-dwelling sister genera Echimys and Phyllomys, members of the family Echimyidae of spiny rats. Species of Echimys are mainly distributed in AM forest and Phyllomys species are found in the AF (Leite & Patton 2002; Galewski et al. 2005; Upham et al. 2013) domain. After diverging from the common ancestor
shared with Echimys, the lineage leading to Phyllomys experimented an impressive diversification and, currently, species of Phyllomys are found in almost the entire range of the AF (Leite 2003), although there are no hypotheses regarding probable routes or geographic directions to the diversification of this genus. Systematics and taxonomy of Phyllomys is still very confuse, and only in the beginning of the 21th century species names attributed to morphotypes became more clearly recognized (Emmons et al. 2002). Thirteen nominal species of Phyllomys are recognized: P. mantiqueirensis, P. medius, P. nigrispinus, P. pattoni, P. thomasi, P. unicolor, P. blainvilii, P. brasiliensis, P. dasythrix, P. kerri, P. lamarum, P. lundi, and P. sulinus (Leite 2003; Leite et al. 2008). The great morphological similarities shared by them is seemingly resulted from a rapid event of diversification of the genus (Leite, 2003), and the recognition of some of these species is somewhat possibly based on karyotype information and molecular phylogenetics. More recently, phylogenetic analyses of nuclear and mitochondrial DNA detected other four monophyletic lineages of Phyllomys, representing species awaiting for formal description (Loss & Leite 2011; Araújo et al. 2014).
Recent small mammal collections in central Brazil revealed an unexpected record of an exemplar of Phyllomys in a gallery forest in the core area of the Cerrado biome. Evidences based in morphological and molecular genetics indicate this specimen as conspecific to Phyllomys specimens founded in transitional areas between Cerrado and AF, and identified as the fourth undiscribed Phyllomys species by Araújo et al. (2013). We named and describe this new species in this present paper, and perform ancestral reographical range analyses of Phyllomys and related taxa from AM in order to explore hypotheses on the dynamic contact of forests within the Cerrado, AF, and AM. To verify the best-fit hypothesis among the three available alternative hypotheses regarding the routes and connections between the Cerrado forests, AM, and AF, we predict that if the ancestral range of the most recent common ancestor of Phyllomys and Echimys is estimated to be located at northeastern AF, then the northeastern contact route is likely to have played a role in the diversification of these genera. Otherwise, if the ancestral range of the most recent common ancestor of Phyllomys and Echimys is estimated to have occured in the central or southern AF, then the two alternative contact routes (central and southern) are more likely to have played a role in the diversification of these genera.
22
Material and methods
Taxonomic sampling and morphological description
To investigate the phylogenetic relationship of the Phyllomys specimens, we used DNA sequences from the specimen collected in the Cerrado biome along with other 25 specimens as terminal taxa distributed in 13 recognized Phyllomys species (sensu Loss & Leite 2011; Araújo et al. 2014): P. blainvilii, P. brasiliensis, P. dasythrix, P. lamarum, P. lundi, P. mantiqueirensis, P. nigrispinus, P. pattoni, P. sulinus, Phyllomys sp. 1, Phyllomys sp. 2, Phyllomys sp. 3, and Phyllomys sp. 4. The Echimyidae species, Echimys chrysurus and Makalata didelphoides were used as outgroups, given the closest relationship o these species and Phyllomys, tipically retrived as sister clades in previous studies (Loss & Leite 2011; Upham et al. 2013; Upham & Patterson 2015). Other four valid species of Phyllomys were not included in the present study (as any other molecular phylogenetic study) given the inexistence of DNA samples: P. medius, P. kerri, P. thomasi, and P.unicolor. However, the combination of morphological information and known geographic distribution of these four species suggest non-synonymies regarding to all other species of Phyllomys considered in our analyses (Leite, pers. comm.).
For the molecular clock analyses we included other clades of the Infraorder Hystricognathi, in order to accept multiple calibration points and composed by the Echimyidae Dactylomys boliviensis, Mesomys hispidus, Isothrix bistriata, Thrichomys apereoides, Proechimys cuvieri, Myocastor coypus, Callistomys pictus, Trinomys iheringi, Euryzygomatomys spinosus, Clyomys laticeps; the Octodontidae Octodondomys gliroides; the Ctenomyidae Ctenomys coyhaiquensis; the Abrocomidae; Abrocoma bennettii; and the Chinchillidae Chinchilla lanigera. For a complete list of specimens analyzed and museum catalog number see appendix 1.1.
For the morphological description of the new species we use the terminology of Argot (2004) and Carrizo & Díaz (2013) for post-cranial anatomy; for external and cranial morphology we follow Emmons et al. (2002) and Leite (2003); the dental nomenclature according to Iack-Ximenes et al. (2005). Morphological comparisons were made between Phyllomys sp. n. (specimens UNB3820, M2709, MCN-M2153), P. brasiliensis (specimens MCN-M1733, MCN-M1734), literature information for P. blainvilii (Leite, 2003) given the close geographic range of these species, and literature information (Leite, 2003) of the sister species P. mantiqueirensis.
Twenty-three cranial measurements were taken with a digital caliper to the nearest 0.01 mm. These are the same used by Leite (2003): greatest skull length (GSL), nasal length (NL), rostral length (RL), orbital length (OL), rostral breadth (RB), interorbital constriction (IOC), mastoid breadth (MB), zygomatic breadth (ZB), condyloincisive length (CIL), basilar length (BaL), diastema length (D), maxillary toothrow length (MTRL), total palatal length (PLa), posterior palatal length (PLb), incisive foramina length (IFL), bullar length (BuL), postpalatal length (PPL), mesopterygoid fossa width (MPF), maxillary breadth (MaxB), occipital condyle width (OccW), rostral depth (RD), cranial depth (CD), and cranial depth at M1 (CDM1). External measurements were obtained from skin tags or field notes: total length (TOL), tail length (TAL), hind-foot length (HF), and ear length (E).
Molecular data, phylogenetic reconstructions and dating
DNA extractions from tissue samples preserved in ethanol were made following Bruford et al. (1992). Five DNA fragments were used for the molecular phylogenetic reconstructions: the two mitochondrial genes cytochrome-b (cytb) and cytochrome-c oxidase I (COI); and three nuclear genes, the exon 28 of the nuclear von Willebrand factor (vWF), the exon 10 of the growth hormone receptor (GHR), and the recombination activating gene 1 (RAG1). Primers used in the amplification process were the MVZ05 and MVZ16 (Smith & Patton 1993) for the cytb; LCO and HCO (with a tail M13: LepF1_t1, VF1d_t1, LepR1_t1 e VR1d_t1) (Ivanova et al. 2007) for COI; V10 and W13 (Galewski et al. 2005), V2 and W1 (Huchon et al. 1999) for vWF; GHREND and GHR50F (Adkins et al. 2001), GHR10F, GHR11F e GHR14R (Upham et al. 2013) for GHR; RAG1F1705 and RAG1R2864 (Teeling et al. 2000), FMNH2b and FMNH3a (Patterson & Velazco 2008) for RAG1.
Concentration and volume of reagents used for each polymerase chain reaction (PCR) were variable for each species and can be obtained under request to the authors. Thermocycling conditions for the amplification process of each marker can be found at appendix 2.1.
PCR products were purified using ExoSAP enzymes (GE Healthcare Life Sciences). The cycle-sequencing reactions were performed using BigDye Terminator 3.1 (Applied Biosystems, Inc.) and same primers used for PCR. Samples were sequenced in both directions using the automated DNA sequencer ABI 3500 (Applied Biosystems Inc.) following manufacturer’s protocol for sequencing reaction.
24
Sequences were aligned in Geneious 6.1 (Biomatters, Auckland, New Zealand). Appropriate models of evolution for each gene partition were determined in jModelTest 2.1.7 (Darriba et al. 2012), allowing for three substitutions schemes and gamma parameter estimate using Bayesian Information Criterion (see appendix 3.1 for selected evolutionary model for each partition). All obtained sequences were deposited in GenBank. Accession numbers of the sequences obtained here and additional sequences downloaded from GenBank are available in appendix 1.1.
We used Bayesian Inference (BI) implemented in MrBayes v.3.0b4 (Huelsenbeck & Ronquist 2001) to reconstruct phylogenetic relationships within Phyllomys species. This analysis was performed using a concatenated data set of all molecular markers (cytb, COI, vWF, GHR, RAG1) from 26 Phyllomys specimens and two outrgroups (Makalata didelphoides and Echimys chrysurus) totaling 3,996 base pairs (bp) for each terminal taxa. The dataset was partitioned by gene allowing each partition to evolve under an independent model. We used two chains of Markov chain Monte Carlo (MCMC) in MrBayes running for 100 millions generations, sampling one tree every 500 generations, and resulting in 200.000 trees. We discarded the first 25% samples as burn-in and estimated a 50% majority-rule consensus from the remaining trees.
In order to calibrate the molecular clock, we included sequences from other Caviomorpha taxa (appendix 1.1). Since there are no COI sequences available for most of the outgroups used in this analysis we excluded this marker for the divergence time estimative, resulting in a data matrix with 44 terminal taxa and 3,330 bp (cytb, vWF, GHR, RAG1) for each taxa.
We estimated the time to most recent common ancestor (with SD and 95% credibility interval) among Phyllomys lineages using relaxed clock with Log normal distribution and Yule prior as implemented in BEAST 2.3.2 (Drummond et al. 2012) with unlinked evolutionary models and clock rates between partitions. We used a constraint topology by forcing the monophyly of groups according to our previous analysis with all molecular markers for Phyllomys species and following Upham and Patterson (2015), Upham et al. (2013) and Loss et al. (2014) for other Caviomorpha phylogenetic relationships. The software TRACER v1.3 (Rambaut & Drummond 2007) was used for check convergence in the log likelihood of retrieved trees.
Relaxed clock analysis performed in the BEAST software was used to date the phylogenetic tree. We used three fossils to calibrate the molecular clock following
Upham et al. (2013) and Upham and Patterson (2015). All calibration points were set as minimum dates (offset) with lognormal priors, mean =0 and standard deviation (SD) = 1. First calibration point represents the most recent common ancestor (MRCA) of Chinchilloidea/Octodontoidea. The minimum age was constrained at 29.5 million years ago using the oldest stem octodontoid, Draconomys verai from the early Oligocene Sarmiento Formation at Gran Barranca, Argentina, pre-Deseadan SALMA – South American Land Mammal Age (Vucetich et al. 2010; Antonie et al. 2012). Second calibration point represents MRCA of Octodontidae/Ctenomyidae. The minimum age was constrained at 5.7 Ma using the stem ancestor of Ctenomys, Xenodontomys simpsoni from the late Miocene Los Salitres Formation at Laguna Chasicó, Argentina, late Huayquerian SALMA (Verzi 2008; Verzi et al. 2013). Third calibration point represents MRCA of the Thrichomys-Callistomys-Myocastor-Proechimys clade. The minimum age was constrained at 6.0 Ma using the stem ancestor of the Thrichomys lineage, Pampamys emmonsae from the late Miocene Cerro Azul Formation at Laguna Chillhué, Argentina, Chasicoan-Huayquerian SALMA (Verzi et al. 1995, 2013; Olivares & Verzi 2014).
The Markov chains ran for 107 generations sampling 1 tree every 103 generations, which resulted in 104 trees. Tracer v1.6 (Rambaut et al. 2014) was used to visualize BEAST output files and check for convergence. This analysis indicated effective sample size values all higher than 200.
Biogeographic analyses
We constructed a map (Appendix 4.1) showing occurrence localities of Phyllomys species based in a series of records obtained in museum collections. A complete list of specimens used to contruct the map and details are provided in Appendix 5.1).
The ancestral geographical distribution of Phyllomys species were inferred using the Bayesian approach - Bayesian Binary MCMC (BBM) Method For Ancestral State in the software RASP 3.1 (Reconstruct Ancestral State in Phylogenies; Yu et al. 2015). Using this approach we can track what region of AF played a role in the contact with AM and forest areas of Cerrado during the diversification of Phyllomys and related outgroups. For this analysis the tree chronogram resulting from the dating analyses of BEAST software was used as input. We pruned the tree terminals so each species were represented by one sole terminal, and outgroups were represented by
26
Makalata didelphoides and Echimys chrysurus. The analysis was conducted using four areas of occurrence kept as maximum, ten chains of 5 millions generations, sampling every 100 generations, and discarding 25% of samples.
We used biomes (biome in the definition of Whittaker 1968: a grouping of communities of similar physiognomy and related environmental conditions within a single continent or region) to delimit the geographic ranges of the living Phyllomys species as follows: AM (the outgroups Makalata didelphoides and Echimys chrysurus); the Cerrado biome (P. brasiliensis, the specimen collected in the core area of Cerrado – UNB 3820, and Phyllomys sp. 4 from areas in the transition of AF and Cerrado); south AF (P. nigrispinus, P. sulinus, and P. dasythrix); south-central AF (P. pattoni, P. lundi, P. mantiqueirensis, Phyllomys. sp. 1, and Phyllomys. sp. 3); north-central AF (P. pattoni and P. lamarum); northeast AF (Phyllomys sp. 2); and the relicts of AF enclaves in the dry biome Caatinga – called “Brejos” (P. blainvilii). The sense for this regionalization in the distribution of Phyllomys in the AF is based in clades of Phyllomys associated to particular regions of the Atlantic forest (Leite et al. 2003; Loss & Leite 2011) and also by independent source of evidence for such regionalization of AF biota (Carnaval et al. 2009; Silva et al. 2012). Given that Phyllomys brasiliensis and Phyllomys sp. n. are recorded in transitional areas between Cerrado and AF, we conduct an alternative analyses considering these taxa to occur in transitional areas of Cerrado and AF as well.
Results
Phylogenetic analysis
The phylogeny resulted from Mr.Bayes analysis (Fig. 1.1) confirmed the monophyly of Phyllomys with high support. The linage that leads to Phyllomys pattoni is derived from a basal dichotomy as the first divergence in Phyllomys tree. The specimens MCN-M 2027, MCN-M 2709 (referred as Phyllomys sp. 4 by Araújo et al. 2014) and UNB 3820 formed a well-supported clade sister to P. mantiqueirensis. These specimens display a unique combination of morphological characters, karyotype (Araújo et al. 2014), and distribution. Given these evidences we decided to name a new species as follows in the next sections. Specimens related to Phyllomys sp. 3 formed a well supported clade and is sister to a clade represented by remaining Phyllomys species. This clade is formed by two reciprocally monophyletic
clades that are represented by two unnamed species, Phyllomys sp. 1 and Phyllomys sp. 2, P. blainvilii, P. lamarum, P. brasiliensis, P. lundi, P. nigrispinus, P. sulinus, and P. dasythrix.
28
Figure 1.1: Bayesian inference phylogram 1 based on concatenated (vWF, GHR, RAG1, COI, and Cytb) molecular data set. Numbers near nodes
Description of the new species Genus Phyllomys Lund, 1839 Phyllomys centralis sp. n. (Fig. 2.1)
Holotype. UNB 3820, adult female; skin, skull, partial skeleton, and tissue in ethanol. Collected by Anderson Paz, 5 March 2012. Deposited in the Mammals collection, Universidade de Brasília (UnB) under the catalog number UNB 3820 cytb sequence, GenBank acc. no. KX852221; COI sequence, GenBank acc. no. KX852223; GHR sequence, GenBank acc. no. KX852229; RAG1 sequence, GenBank acc. no. KX852256; vWF sequence, GenBank acc. no. KX852279.
Type locality. BRAZIL, Distrito Federal, APA Gama Cabeça de Veado, 15°57'04.42"S, 47°57'48.85"W, 1100 m.
Paratypes. MCN-M 2027, young female collected by Kátia R. da Silva, 9 December 2010, BRAZIL, Minas Gerais, Santa Bárbara, 19°57'32"S, 43°24'54"W (skin, skull, partial skeleton, tissue in ethanol). MCN-M 2709, adult male, collected by Kátia R. da Silva, 26 January 2012, BRAZIL, Minas Gerais, Catas Altas, 20°4'27"S, 43°23'53"W (skin, skull, partial skeleton, tissue in ethanol). MCN-M 2153, adult, sex unknown, collected by Luciana Barçante, BRAZIL, Minas Gerais, Belo Horizonte, 19°49'S, 43°54'W (skin, skull, partial skeleton).
Etymology. The name centralis refers to the geographic distribution, which extend to the most central region of BRAZIL compared to the geographic distribution of other Phyllomys species.
Diagnosis. A medium sized species of Phyllomys with coarse dorsal pelage, reddish-brown speckled with black. Pelage color gradually changing to reddish-brown or beige toward the venter, with inguinal, gular and axillary white patches. Dorsal pelage on pes and manus light-brown to silver-white. Aristiforms on rump medium in length (ca. 24 mm) and thin (<0.5 mm), wider and paler at the base, thinning gradually toward the tip, which is either black or orange. Tail shorter than or equal to head and body length, covered with light-brown hairs to the tip, forming a bushy tuft. Upper toothrow parallel to slightly divergent posteriorly; palatine wider than M1. Supraorbital ridges well developed, interorbital region slightly divergent posteriorly.
30
Figure 2.1: Live holotype of Phyllomys centralis sp. n. (UNB 3820) after been captured in a live trap installed in a canopy of gallery forest
Zygomatic arch robust, maximum height approximately equal to or less than one third of jugal length. Postorbital process of zygoma well developed, formed exclusively by the jugal. Lateral process of supraocciptal short, extending to the midline of the external auditory meatus. Incisive foramen ovate, upper incisors orthodont. Karyotype (MCN-M2027): 2n = 76, FN = 140 (Araújo et al. 2013, referred to as “Phyllomys sp. 4”).
Description
External measurements. Female (UnB UNB 3820, holotype). Total body length 471.5 mm, tail 224 mm, hindfoot 43 mm, ear 18.5 mm, weight 340 g. Male (MCN-M 2709, paratype). Total body length 425 mm, tail 211 mm, hindfoot 39 mm, ear 16 mm, weight 250 g. There are no external measurements for the specimen MCN-M2153 and the young female MCN-M 2027.
External morphology (Fig. 3.1) Medium sized body (sensu Emmons et al. 2002) with coarse pelage but not heavily spined. Dorsal head color similar to dorsum, nose reddish. Round and small ears densely covered by hairs two times larger than ears. Mystacial vibrissae exceeding the ears, varying from dark brown (MCN-M 2153; 2709) to whitish (UNB 3820). Dorsal pelage ranging from reddish brown (specimen MCN-M 2153) to yellowish brown (specimens UNB 3820; MCN-M 2709), both speckled with black. No clear distinction between dorsal and lateral pelage. Ventral pelage varies from reddish-brown to greyish-beige with inguinal and axillary white patches. Aristiforms on rump short (less than 26 mm) and narrow (less than 0,5 mm), paler at the base, gradually darkening toward the distal end. Aristiform tip either black or orange, whiplike tip (filamentum apicalis) present or absent. Tail dark brown above and slightly lighter below, but not conspicuously bicolor; shorter than or equal to head and body length in adult specimens; covered with light brown hairs throughout its length, ending in a bushy tuft. Tail scales visible, especially toward the proximal portion of tail. Dorsal surface of manus and pes covered with light-brown to silver-white hairs, giving a lighter aspect when compared to the rest of the body. Ungual tufts whitish, reaching claw tips, vestigial pollex bearing a nail. Plantar surface of hindfoot covered by small scales, bearing long hypothenar and thenar pads, and four interdigital pads.
32
Figure 3.1: Dorsal and ventral views of skins of specimens of Phyllomys centralis sp.
n. The holotype (UNB 3820 - above), and two paratypes (MCN-M 2709 - center; MCN-M 2027 - below). Scale bar = 11cm
Cranium (Fig. 4.1). Skull robust and long. Nasal bones widen gradually toward anterior end in dorsal view. Interorbital region diverging posteriorly, with a very small postorbital process. Supraorbital ridges well developed. Zygomatic arch robust, maximum height approximately equal to or less than one third of the jugal length. Postorbital process of zygomatic prominent and formed only by jugal. Incisive foramen ovate present. Palatine width wider than tooth width at M1. Mesopterygoid fossa variable in size and shape, forming an angle of 45–60o, and reaching anterior lamina of M3 or posterior lamina of M2. Lateral process of supraocciptal short, extending to the midline of the external auditory meatus. Ventral root of the angular process laterally deflected or not. Ventral mandibular spine present or absent. Skull measurements presented in Table 1.1.
Dental morphology (Fig. 5.1). Upper incisors orthodont; upper toothrows parallel to slightly divergent posteriorly. Upper cheek teeth rectangular, consisting of 4 simple parallel lophs separated by 3 labial flexi: para-, meta-, and posteroflexus. Lower premolar pentalophodont and lower molars trilophodont. Meso-, postero-, and hypoflexid angled; murid present on m3 and also visible on worn m2, separating hypo- and posteroflexid.
Post-cranial skeleton (Figs. 6.1; 7.1): Vertebrae count: 7 cervical, 14 thoracic, 7 lumbar, 3 sacral, and 36 caudal. Dorsal tubercle present on atlas, but smaller than ventral tubercle. Spinous process of axis well developed and projected posteriorly. Lamina ventralis present on sixth cervical vertebra. Neural process of second thoraxic vertebra long and distally broad. Eleventh thoracic vertebra is the anticlinal. Anapophyses present on all but the seventh lumbar vertebra. Second sacral vertebra fused to third and first vertebrae, which is also fused to the ilium. Six proximal caudal vertebrae show well-developed neural and transverse processes, pre- and post-zygapophyses, and neural foramen. Sternum formed by a shovel-shaped manubrium, four wide sternebrae, and a rectangular xiphisternum. Scapula with infraspinous fossa wider than supraspinal, cranial border round and vertebral border pointed, spinous process long, acromion and metacromion well developed. Humerus slightly shorter than ulna, deltoid tuberosity well developed positioned on the proximal half. Size of olecranon process similar to trochlear notch. Iliac crest well developed and projected laterally, posterodorsal margin of ischium pointed, sciatic notch well developed.
34
Figure 4.1: Dorsal, ventral, and lateral views of skull and lateral view of mandible of
holotype of Phyllomys centralis sp. n. - UNB 3820. (scale bar = 1cm).
Figure 5.1: Right mandibular (left) and maxillary toothrows of Phyllomys centralis
Figure 6.1: Post cranium axial skeleton of Phyllomys centralis sp. n. A – atlas: dorsal tubercle (dt) and ventral tubercle (vt); B – axis: spinous
process (sp); C – cervical vertebrae: lamina ventralis (lv) of the sixth cervical vertebra; E – neural process (np) of second thoraxic vertebra; D – the eleventh thoracic vertebra (tv11), and the seventh lumbar vertebra (lv7); F – second sacral vertebra (sv2), ischium (isch), and iliac crest (ic); G – first caudal vertebra (cv1), neural process (np).
36
Figure 7.1: Sternum region and appendicular skeleton of Phyllomys centralis sp. n. A – sternum region: sternebrae (ste), manubrium (man), and
xiphisternum (xiphi); B – scapula: infraspinous fossa (if), supraspinal fossa (sf); C – humerus: deltoid tuberosity (dt); D – radio and ulna: olecranon process (op), and trochlear notch (tn); E – femur: greater trochanter (gt), head of femur (hf), and lesser trochanter (lt); F – tibia and fibula; G – manus; H – pes.
Table 1.1: Cranial measurements of Phyllomys centralis sp. n. (UNB 3820,
MCN-M2709, and MCN-M2153), Phyllomys blainvilii, and Phyllomys brasiliensis. Measurements taken from Phyllomys blainvilii, and Phyllomys brasiliensis are the same of Leite (2003).
P. centralis sp. n.
n = 3 P. mantiqueirensis (holotype) P. blainvilii n = 65 P. brasiliensis n = 2
GSL 51.85 (50.16 - 53.93) 48.1 (44.4 - 52.7) 48.0 (48.5 - 52.3) 50.4 NL 15.45 (14.33 - 16.16) 14.2 13.7 (11.9 - 16.6) 14.2 (13.8 - 14.6) RL 19.18 (18.4 - 20.4) 17.2 (15.0 - 18.9) 16.8 (17.5 - 19.8) 18.6 OL 14.23 (13.88 - 14.78) 14.0 13.7 (12.7 - 14.7) 13.8 (13.3 - 14.3) RB 7.9 (7.6 - 8.16) 7.9 (6.2 - 7.8) 6.9 (7.0 - 7.6) 7.3 IOC 12.47 (11.44 - 13.19) 10.2 10.1 (8.8 - 11.9) 11.8 (11.1 - 12.5) MB 20.03 (19.78 - 20.19) 18.9 (17.6 - 20.5) 18.8 (18.5 - 21.2) 19.8 ZB 25.21 (24.03 - 27.19) 23.1 23.0 (20.9 - 25.3) 24.0 (22.6 - 25.4) CIL 47.03 (45.21 - 48.41) 43.0 (40.2 - 47.3) 43.1 (42.0 - 47.6) 44.8 BaL 40.45 (38.81 - 41.63) 36.3 37.0 (33.4 - 40.4) 39.1 (36.0 - 42.1) D 12.16 (10.37 - 11.76) 10.0 (8.1 - 11.3) 9.6 (10.1 - 11.2) 10.7 MTRL 11.21 (10.81 - 11.69) 11.4 11.4 (10.4 - 12.7) 11.8 PLb 9.65 (9.22 - 10.0) 9.0 (7.0 - 9.6) 8.5 (9.5 - 10.2) 9.8 IFL 4.29 (3.86 – 4.8) 3.9 (3.0 - 4.6) 3.8 (4.7 - 4.8) 4.8 BuL 11.16 (10.5 – 11.96) 9.4 (9.1 - 11.8) 10.2 (10.1 - 10.9) 10.5 Pla 19.94 (18.53 – 21.32) 18.9 (15.6 - 20.4) 18.1 20.2 (21.4 - 22.8) PPL 23.14 (22.41 – 23.72) 18.7 (17.4 - 21.5) 19.6 (21.4 - 22.8) 22.1 MPF 5.60 (4.96 – 6.24) 3.1 (2.7 - 3.6) 3.2 4.0 (3.5 - 4.5) MaxB 8.73 (8.12 – 9.22) 8.3 (6.4 - 8.2) 7.5 (8.2 - 8.4) 8.3 OccW 8.97 (8.77 – 9.27) 8.6 (7.9 - 9.0) 8.3 8.5 (8.4 - 8.6) RD 10.09 (9.42 – 10.58) 9.9 (9.1 - 11.1) 10.3 (10.1 - 12.1) 11.1 CDM1 14.93 (14.27 – 15.39) 13.9 12.8 - 14.9) 13.7 ( 14.4 (13.7 - 15.2) CD 20.61 (19.63 – 22.23) 19.7 (16.5 - 19.9) 18.5 (15.0 - 20.0) 17.5
38
Greater trochanter higher than head of femur, lesser trochanter well developed and third trochanter absent. Tibia slightly longer than femur, sigmoid in anterior view. Proximal margin of fibula wide and falciform. Five digits on manus and pes, vestigial pollex.
Comparisons. Phyllomys centralis sp. n. is clearly diferent from P. mantiqueirensis by the larger cranial mesurements (Table 1.1) and body size (Table 2.1). The former has the doral pelage with a spiny aspect and broad palatine width, and P. mantiqueireis posses a soft dorsal pelage (Table 2.1) and narrow palatine width (Table 2.1). These two species posses a disjunct known geographical distribution. The geographic range of Phyllomys centralis sp. n. overlaps with P. brasiliensis and is adjacent to P. blainvilii. These three species are morphologically similars and overlaps in many cranial mensurements (Table 1.1). The overall dorsal pelage is darker in Phyllomys centralis sp. n. than in P. blainvilii, and the thighs and rump of Phyllomys centralis sp. n. are darker than those of P. brasiliensis. Aristiforms on rump of Phyllomys centralis sp. n. narrower (<0.5 mm) than both P. brasiliensis and P. blainvilii (≥1 mm), of the same length of the latter (ca. 24 mm), and shorter than the former (ca. 27 mm). Transition from dorsal to ventral sides of the body more gradual in Phyllomys centralis sp. n. than in P. brasiliensis and P. blainvilii. The ventral pelage is lighter in P. brasiliensis and P. blainvilii than in Phyllomys centralis sp. n., which varies from reddish-brown to greyish-beige. The palate is about the same width of M1 in P. brasiliensis, but wider than M1 in both Phyllomys centralis sp. n. and in P. blainvilii (Table 2.1). The orange band of dorsal aristiforms is also shorter in Phyllomys centralis sp. n. than the other two species. Posterior margin of protoconid on m3 slightly pointed in Phyllomys centralis sp. n. and rounded in P. brasiliensis. Usefull traits to delimit P. centralis sp n., P. mantiqueirensis, P. brasiliensis, and P. blainvilii are presented in Table 2.1.
Distribution and habitat. The holotype Phyllomys centralis sp. n. was trapped in a live trap placed in the canopy of a protected gallery forest fragment within Fazenda Água Limpa, research station of Universidade de Brasília at conservation unit APA Gama Cabeça-de-Veado (Distrito Federal, central Brazil). This gallery forest fragment comprises a typical gallery forest vegetation with arboreal individuals of 20
to 25 m high, distributed alongside a narrow affluent of Paraná hydrographic region, and canopy covering 70 to 95% of the landscape. It is located nearby a small dam and is surrounded by savannas-like vegetation of Cerrado core area and urban occupation. The collecting localities of three paratypes are located at western limit of AF. Vegetation from these localities are characterized by deciduous and semi-deciduous forests, savannas, and gallery forests.
Table 2.1: Table showing selected characters used to delimit P. centralis sp. n. in
relation to the sister species (P. mantiqueirensis), and species with closer geographic records: P. blainvilii and P. brasiliensis
P. centralis sp. n. P. mantiqueirensis P. blainvilii P. brasiliensis
Body size medium small Small-medium medium
Dorsal pelage spiny soft spiny spiny
Palatine width >M1 <M1 >M1 <M1
Aristiforms width <0.5 mm <0.5 mm ≥1.0 mm ≥1.0 mm
Karyotype 2n=74 FN=140 - 2n=50 FN=94 -
Molecular dating and Biogeographic analyses
Molecular dating analysis (Fig. 8.1) indicates the initial diversification of Phyllomys to occur during the Miocene, when it shares the MRCA with Echimys. The crown age of Phyllomys is the late Miocene, and most diversification events within the genus occurred during the Pliocene, when Phyllomys centralis sp. n. derived from a divergence event in middle Pliocene, a time when it split from the MRCA shared with P. mantiqueirensis. Additional species derived from divergences occurred during the Pliocene are the unnamed species Phyllomys sp. 2 and Phyllomys sp. 3. Most living species of Phyllomys resulted from divergences during Pleistocene, as the two major clades composed by species distributed at northeast and southern Brazil (see Loss & Leite 2011).
Ancestral geographic distribution analyses using different distribution areas (i.e. setting the geographic range of Phyllomys centralis sp. n. and P. brasiliensis to Cerrado and transition with AF, or Cerrado only) resulted in congruent results. This analysis (Fig. 9.1) indicate the south-central AF as the main area for the initial
40
diversification of Phyllomys. During Miocene an ancestral stock have changed its geographic distribution from (what is currently known as) AM to south-central AF. After an impressive event of diversification, other lineages shifted their distribution to other biomes or to sub-areas of the AF, including Phyllomys centralis sp. n. which is distributed in the Cerrado and transitional areas between Cerrado and AF.
Figure 8.1: Molecular dating chronogram of Phyllomys inferred from concatenated
genes (vWF, GHR, RAG1, and Cytb). Horizontal bars represent 95% credibility intervals for time estimates.
0 5 1 0 UFMG 2376 pha 355 v 8 m 5 NSV 160599 UFMG 3016 MCNU 844 m c n m 2 7 0 9 UFES 120 MNRJ 62393 f s 1 4 1 1 MCNU 828 UFES 284 pha 358 h g b 5 8 5 UFMG 3017 UFES 43 MNRJ 62392 UFES 620 UFMG 3014 b 3 0 4 CMUNB3820 UFMG 2489 f s 1 2 3 0 f s 0 6 4 3 b 7 2 3 MNRJ 62391 UFMG 2487 m c n m 2 0 2 7 c i t 1 3 4 4 Phyllomys pattoni
Phyllomys centralis sp. nov. Phyllomys mantiqueirensis Phyllomys sp. 3 Phyllomys brasiliensis Phyllomys lamarum Phyllomys blainvilii Phyllomys sp. 2 Phyllomys dasythrix Phyllomys sulinus Phyllomys nigrispinus Phyllomys sp. 1 Phyllomys lundi MA Echimys chrysurus