Frontiers of Structural and Civil Engineering CN 10-1023/X https://doi.org/10.1007/s11709-020-0623-6 ISSN 2095-2430 RESEARCH ARTICLE
The use of artificial neural networks to estimate seismic damage
and derive vulnerability functions for traditional masonry
Tiago Miguel FERREIRAa*, João ESTÊVÃOb, Rui MAIOc, Romeu VICENTEc a
ISISE, Institute of Science and Innovation for Bio-Sustainability (IB-S), Department of Civil Engineering, University of Minho, Guimarães 4800-058, Portugal
b
Department of Civil Engineering, University of Algarve, Faro 8005-139, Portugal c
RISCO, Department of Civil Engineering, University of Aveiro, Aveiro 3810-193, Portugal *Corresponding author. E-mail: [email protected]
Front. Struct. Civ. Eng., Just Accepted Manuscript • https://doi.org/10.1007/s11709-020-0623-6
http://journal.hep.com.cn on Apr 19, 2020
© Higher Education Press and Springer-Verlag GmbH Germany, part of Springer Nature 2020
Just Accepted This is a “Just Accepted” manuscript, which has been examined by the peer‐review process and has been accepted for publication. A “Just Accepted” manuscript is published online shortly after its acceptance, which is prior to technical editing and formatting and author proofing. Higher Education Press (HEP) provides “Just Accepted” as an optional and free service which allows authors to make their results available to the research community as soon as possible after acceptance. After a manuscript has been technically edited and formatted, it will be removed from the “Just Accepted” Web site and published as an Online First article. Please note that technical editing may introduce minor changes to the manuscript text and/or graphics which may affect the content, and all legal disclaimers that apply to the journal pertain. In no event shall HEP be held responsible for errors or consequences arising from the use of any information contained in these “Just Accepted” manuscripts. To cite this manuscript please use its Digital Object Identifier (DOI(r)), which is identical for all formats of publication.”
Verso: Front. Struct. Civ. Eng. 2020
Recto:Tiago Miguel FERREIRA et al. Damage and vulnerability analysis based on ANNs Front. Struct. Civ. Eng. 2020
RESEARCH ARTICLE
https://doi.org/10.1007/s11709-020-0623-6
The use of artificial neural networks to estimate seismic damage
and derive vulnerability functions for traditional masonry
Tiago Miguel FERREIRAa*, João ESTÊVÃOb, Rui MAIOc, Romeu VICENTEc
aISISE, Institute of Science and Innovation for Bio-Sustainability (IB-S), Department of Civil Engineering, University of Minho, Guimarães4800-058, Portugal
bDepartment of Civil Engineering, University of Algarve, Faro8005-139, Portugal
cRISCO, Department of Civil Engineering, University of Aveiro, Aveiro3810-193, Portugal *Corresponding author. E-mail: [email protected]
ABSTRACTThis paper discusses the adoption of Artificial Intelligence-based techniques to estimate seismic damage, not with the goal of replacing existing approaches, but as a mean to improve the precision of
empirical methods. For such, damage data collected in the aftermath of the 1998 Azores earthquake (Portugal) is used to develop a comparative analysis between damage grades obtained resorting to a classic damage formulation and an innovative approach based on Artificial Neural Networks (ANNs). The analysis is carried out on the basis of a vulnerability index computed with a hybrid seismic vulnerability assessment methodology, which is subsequently used as input to both approaches. The results obtained are then compared with real post-earthquake damage observation and critically discussed taking into account the level of adjustment achieved by each approach. Finally, a computer routine that uses the ANN as an approximation function is develop and applied to derive a new vulnerability curve expression. In general terms, the ANN developed in this study allowed to obtain much better approximations than those achieved with the original vulnerability approach, which has revealed to be quite non-conservative. Similarly, the proposed vulnerability curve expression was found to provide a more accurate damage prediction than the traditional analytical expressions.
KEYWORDSArtificial Neural Networks, seismic vulnerability, masonry buildings, damage estimation, vulnerability curves
1 Introduction
Large-scale seismic vulnerability assessment methods are often based on a few empirical-based parameters defined through the statistical analysis of large sets of post-earthquake damage data [1], and normally uses simplified expressions, which are very easy to implement in Geographical Information Systems (GIS software), being a worldwide adopted approach. Some of these methods have been reviewed and discussed in depth in recent review articles [2,3]. However, the inability of traditional statistical methods to handle missing or noisy data, as well as to manage nonlinearities and to identify certain behavior patterns, opens up space to the use of innovative computer-based solutions. In the last couple of years, the use of Artificial Neural Networks (ANNs) is becoming increasingly popular in many civil engineering applications [4–6], namely in the field of
earthquake engineering [4–17]. Traditionally, ANNs are used as “black boxes” to obtain a problem solution without a clear understanding about the mathematical relations between the inputs and the outputs, which are often considered as being a handicap for engineering purposes. Moreover, as discussed by Estêvão [18], the precision of the results obtained from ANNs-based approaches is very dependent on the dimension of training data set required, which often makes it impossible to use this kind of techniques when only small data sets are available. Trying to overcome this issue and taking the best of these two important group of approaches, a simplified large-scale seismic vulnerability assessment approach and an ANN are used together. It is worth noting that the ANN is used herein, not only to obtain a problem solution, as usual, but also as a guiding line function to develop a new simplified vulnerability curve expression with a good approximation to the observed damage data. Despite not solving the above mentioned “black box” problem, using the proposed approach opens the possibility of deducing new simplified expressions using the well-known mapping capabilities of ANNs to better correlate input and output variables. For such, a set of computer routines were developed to find an expression that best fits the results of a Multi-layer Feed-Forward Neural Network (MFFNN), which
Verso: Front. Struct. Civ. Eng. 2020
Recto:Tiago Miguel FERREIRA et al. Damage and vulnerability analysis based on ANNs Front. Struct. Civ. Eng. 2020
RESEARCH ARTICLE
https://doi.org/10.1007/s11709-020-0623-6
was previously trained with data obtained from a post-earthquake damage data set collected in the aftermath of the 9th of July 1998 Azores earthquake. A comparative analysis between the vulnerability functions derived from the application of a widely used seismic vulnerability assessment approach and an approach based on the use of ANNs was carried out to understand how capable an ANN is to find a problem solution, even when using a low number of training sets. This comparative analysis was carried out by evaluating the relative deviations between observed damage and the damage estimated by both approaches. Results shows that the ANN solutions are more accurate than the ones obtained with traditional approaches. Moreover, it was also possible to develop a computer routine that uses the ANN as an approximation function, which led to another simplified expression, yet with almost the same precision obtained with the ANN. More than simply deducing a new simplified expression, which domain of validation is obviously limited to Azores and just for the effect of a single earthquake, in this paper is presented a new approach for developing worldwide simplified expressions to describe vulnerability, namely if more data are used to train an ANN.
2 The earthquake of July 9, 1998
With a macroseismic intensity VII on the Modified Mercalli Intensity (MMI) scale [19], the July 9th 1998 Azores earthquake is considered one of the most destructive events in the recent seismic history of Portugal, having affected a total of more than 5,000 people, within which 8 fatalities, 150 injured and about 1500
homeless were reported [20]. Final estimates reported that about 70% of the building stock of Faial, Pico and S. Jorge islands was buffeted by this earthquake. From the technical and academic point of view, the 1998 event allowed to gather an unprecedented amount of good quality post-earthquake data concerning different variables related with the building stock, namely concerned to their main architectural and constructive features, damage report, and the costs associated with repair and/or retrofitting interventions. The database (hereinafter mentioned as “Faial database”) resulting from the 10-year reconstruction process of Faial Island, which was carried out under the supervision of the Society of Promotion for Housing and Infrastructures Rehabilitation (SPRHI), was gathered in 2007 by the Regional Secretariat for Housing and Equipment (SRHE) of Faial Island and subsequently assembled in the book edited by Oliveira et al. [21].
The quality and uniqueness of this database in both national and international context have encouraged the development of several advanced studies throughout the following years. Even though the authors were allowed to access the full database, a complementary field work was conducted to understand the evolution and the diachronic process resulting from rehabilitation interventions implemented since 1998 [21]. Zonno et al. [22] presented a proposal of a macroseismic intensity distribution map for the Faial island, which was constructed on the basis of the post-earthquake field survey and observation campaigns that followed the earthquake of July 9, 1998.
As referred in the introductory section, this extensive database was used in this work to compare the feasibility of the vulnerability function proposed by Bernardini et al. [23] with that resulting from an innovative approach based on the use of ANNs. Using as input data the same vulnerability parameters that compose the vulnerability index method, ANNs were trained to predict the damage grade for a given
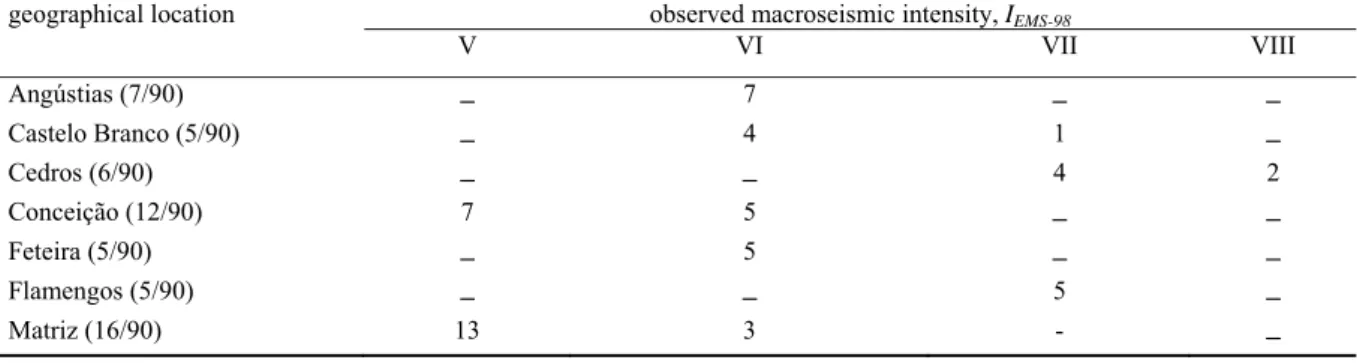
macroseismic intensity, IEMS-98. The data set of 90 stone masonry buildings is distributed in Table 1 by the four observed macroseismic intensities mapped for the island of Faial (from IEMS-98 = V to VIII).
Table 1 Location and distribution of the assessed buildings considering the Macroseismic Intensity registered in situ
geographical location observed macroseismic intensity, IEMS-98
V VI VII VIII Angústias (7/90) – 7 – – Castelo Branco (5/90) – 4 1 – Cedros (6/90) – – 4 2 Conceição (12/90) 7 5 – – Feteira (5/90) – 5 – – Flamengos (5/90) – – 5 –
Verso: Front. Struct. Civ. Eng. 2020
Recto:Tiago Miguel FERREIRA et al. Damage and vulnerability analysis based on ANNs Front. Struct. Civ. Eng. 2020
RESEARCH ARTICLE https://doi.org/10.1007/s11709-020-0623-6 Pedro Miguel (5/90) – – 5 – Praia de Almoxarife (16/90) 5 1 10 – Ribeirinha (8/90) – – – 8 Salão (5/90) – – – 5
number and percentage of
buildings per intensity 25 (27.8%) 25 (27.8%) 25 (27.8%) 15 (16.6%)
The traditional stone masonry buildings comprised in this sample are considered representative of the Azorean vernacular heritage, not only in terms of material and constructive technology, but also in terms of typology, which differs significantly depending on whether the building is located within a rural or an urban environment. The following Table 2 presents the distribution of these buildings by parish and the respective frequency in terms of observed discrete damage grades, Di, which are classified according to the European Macroseismic Scale, EMS-98 [24].
Table 2 Location and distribution of the assessed buildings considering their observed damage grades
geographical location observed damage grades, Di
no damage (D0) D1 D2 D3 D4 D5 Angústias (7/90) – 7 – – – – Castelo Branco (5/90) – 1 3 – – 1 Cedros (6/90) – – 3 3 – – Conceição (12/90) 1 4 5 2 – – Feteira (5/90) – 2 1 1 1 – Flamengos (5/90) – – 3 0 2 – Matriz (16/90) 1 13 2 – – – Pedro Miguel (5/90) – – – – 2 3 Praia de Almoxarife (16/90) 2 3 4 7 – – Ribeirinha (8/90) – 1 – 2 1 4 Salão (5/90) – 1 1 1 – 2
number and percentage of
buildings 4 (4.4%) 32 (35.6%) 22 (24.4%) 16 (17.8%) 6 (6.7%) 10 (11.1%)
As one can observe, about 60% of the considered buildings present a damage grade ranging between D1 and D2, which corresponds to “negligible” and “moderate damage,” 25% show a damage grade between D3 and D4, which corresponds to “substantial” to “very heavy damage,” and finally, about 11% present a damage grade D5, corresponding to a “total or near total collapse.” The remaining 4% don’t present any damage (D0).
3 The seismic vulnerability assessment approach
3.1 General formulation
The seismic vulnerability assessment approach used in this work was originally developed in Italy and has been successfully applied during the past 25 years in several research works all over the globe, particularly in Europe. Most recently, it was adapted and calibrated to the Portuguese masonry building stock reality by Vicente et al. [25] and Ferreira et al. [20], respectively. In conceptual terms, the methodology is based on the calculation of a vulnerability index that results from the weighted sum of the 14 evaluation parameters given in Table 3, each of which focused on a specific aspect related to the seismic response of the building.
Table 3 Vulnerability index parameters, classes and weights, adapted from [13].
parameters vulnerability class cvi weight,
wi
relative weight
A B C D
Group 1. structural building system P1 Type of resisting system 0 5 20 50 2.50 50/100 P2 Quality of resisting system 0 5 20 50 2.50
Verso: Front. Struct. Civ. Eng. 2020
Recto:Tiago Miguel FERREIRA et al. Damage and vulnerability analysis based on ANNs Front. Struct. Civ. Eng. 2020
RESEARCH ARTICLE
https://doi.org/10.1007/s11709-020-0623-6
P3 Conventional strength 0 5 20 50 1.00
P4 Maximum distance between
ll 0 5 20 50 0.50
P5 Number of floors 0 5 20 50 0.50
P6 Location and soil conditions 0 5 20 50 0.50 Group 2. irregularities and interactions P7 Aggregate position and
i t ti
0 5 20 50 1.50 20/100
P8 Plan configuration 0 5 20 50 0.50
P9 Height regularity 0 5 20 50 0.50
P10 Wall facade openings and
li t
0 5 20 50 0.50
Group 3. floor slabs and roofs P11 Horizontal diaphragms 0 5 20 50 0.75 18/100
P12 Roofing system 0 5 20 50 2.00
Group 4. conservation status and other
elements P13 Fragilities and conservation status 0 5 20 50 1.00 12/100
P14 Non-structural elements 0 5 20 50 0.75
As presented in Table 3, the 14 parameters that compose the method are distributed over 4 vulnerability classes, Cvi of growing vulnerability: A, B, C and D. Each class is associated to a weight, wi, that reflects the importance of that parameter in particular; ranging from 0.5 for the less important to a 1.5 for the most important. A complete discussion on the relative importance of each parameter can be found in Ref. [25].
Equation (1) gives the seismic vulnerability index associated to each building, ∗. The higher the
vulnerability index, the more vulnerable is the building. For ease of use, it is usually normalized to fall within the range of 0 to 100, assuming from that moment on the notation, .
∗ ∑ . (1)
3.2 Damage estimation
Based on the above-presented vulnerability index formulation, mean damage grades, , can be estimated for different seismic hazard scenarios. To this end, an analytical expression that correlates macroseismic intensities with the mean damage grade, , of the damage distribution in terms of the vulnerability value, Iv, was proposed by Bernardini et al. [23]. Such formulation is expressed by Eqs. (2) and (3):
2.5 3 tanh .. . , (2)
, , if 7
1 , if 7 (3)
where, IEMS-98 is the seismic hazard described in terms of Macroseismic Intensity [24], V is the vulnerability index used in the Macroseismic Method [26], given in Eq. (4), and f (V, IEMS-98) is a function depending on the vulnerability index and intensity, which was introduced in the expression to adjust the trend of the
vulnerability curves for the lower extremes of the macroseismic intensity grades, namely for IEMS-98 V. This expression was proposed within the framework of an innovative macroseismic approach allowing the
vulnerability analysis of building typologies defined according to the European Macroseismic Scale, EMS-98 [24], and relate it to its vulnerability classes. Moreover, this expression has been widely used and validated in literature, see for example [22].
0.592 0.0057 (4)
To simplify the interpretation of the mean damage grade value, , and to compare it with the discrete damage grades, Di, used in Section 2, these two descriptors can be indirectly correlated through a set of damage factors, DF, which represent the cost of returning a building to its original condition. To this purpose, a probabilistic distribution of damage, derived from the discretisation of the beta distribution defined within
Verso: Fro Recto:Tia Front. Stru RESEARC https://doi the range proposed Using correspo the mean 1.42
3.3 Co
To analy suffered Section 2 1.28 was evaluated damage” and 4.0, approach correspo From damage grade dis and D5 ( Fig. 1 O An alt grade su and the v Followin felt (from functions these int out, sincont. Struct. Civ go Miguel FER uct. Civ. Eng. 2 CH ARTICLE i.org/10.1007/s e of 0 to 5, ca d by Ref. [27] the damage f ondence betwe n damage gra 2.50 ;
omparison
yze the ability by the buildi 2. From that a s obtained, wi d with the vu ” and “moder which corres h, only one bu onding to “tot Fig. 1 one ca (colored in gr stribution. Th 10.0%). Observed versus ternative way ffered by the vulnerability ng this proced m IEMS-98= V t s. Regarding ensities can b e for macrose . Eng. 2020 RREIRA et al. D 2020 11709-020-062 an be assumed ], which can b factors propo een the discre ade value, : D3 2.50
n between
y of the vulne ings, it was ap application, p ith a standard ulnerability in ate damage” sponds to “sub uilding result al or near tota an also observ ray), an obser he largest diff s estimated disc y of analyzing buildings is t functions giv dure, it is pos to VIII) and t the macrosei be seen as the eismic intens Damage and vu 23-6 d. This corres be approxima osed by [27] a ete damage g : D0 (no dama 3.50estimated
erability index pplied to each presented in F d deviation of ndex approach (D0 to D2), an bstantial” to “ ted in a mean al collapse” ( ve that the vu rvation that i ferences were crete damage gr g the ability o through the c ven by Eq. (2) ssible to plot a to analyze its ismic intensit e most relevan ities below V ulnerability anal spondence w ated by the an 4 as threshold v grades, Di, def age) 0 ; D4 3.50and obser
x approach to h one of the 9 Fig. 1 (colore f 1.07. It can h resulted in a nd about 14% “very heavy d n damage grad (D5). ulnerability in s particularly e found in the rade distribution of the vulnera confront/comp ) for different a point cloud s mathematica ties considere nt ones consi V the potentia lysis based on A as carried out nalytical func . (5) values in Eq. fined in the E 0.50 ; 0 4.0rved dama
o correctly est 90 buildings t d in black), a be observed t a mean dama % present a m damage” (D3 de, , betwee ndex approach y evident at th e case of dam ns, using the vu ability index a parison betw t macroseism for each one al correlation ed in this wor dering the ma al level of dam ANNs t herein resor ction given by (5), it is then EMS-98 [24] D1 0.50 0 ; D5 4.0age
timate the me that compose a damage dist that about 85 age grade, mean damage to D4). Using en 4.0 and 5.0 h tends to und he extreme en mage grades D ulnerability inde approach to e een the obser mic intensities e of the four m n with the corr rk, it is impor ain objective mage is very l rting to the co y Eq. (5): n possible to e and different 1.42 00 5. ean damage g e the data set ptribution mea 5% of the buil , ranging betw grade, , be g the vulnera 0, i.e., in a da derestimate th nds of the me D0 (28.9%), D ex approach. stimate the m rved mean da s, as shown in macroseismic responding vu rtant to stress s of the analy low and for in
orrelation establish a t ranges of ; D2 00 . grades presented in an value of ldings ween “no etween 2.5 ability index amage grade he observed an damage D1 (11.1%) mean damage amage grades n Fig. 2. c intensities ulnerability out that ysis to carry ntensities
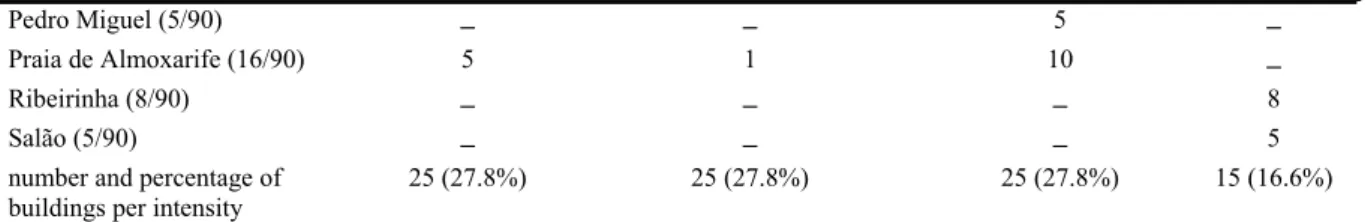
Verso: Fro Recto:Tia Front. Stru RESEARC https://doi above IX near tota Fig. 2 C (c) VII; (d The an through t the field points ar To qu and the a intensity relative d maximum black da statistica a standar analytica 36% of t
ont. Struct. Civ go Miguel FER uct. Civ. Eng. 2 CH ARTICLE i.org/10.1007/s X it is expecte al collapse). Confront betwee d) VIII. nalysis of the the applicatio survey, parti re significantl antify the dif average devia y (identified w deviations pe m relative dev shed line). Fi al analysis car rd deviation o al and observ the cases such
. Eng. 2020 RREIRA et al. D 2020 11709-020-062 ed that most t en observed me e results prese on of the vuln icularly for lo ly shifted by fferences foun ations obtaine with the red d er intensity ran
viation value igure 3(b) sho rried out. Hen of 15.84, was ed damage fa h deviation w Damage and vu 23-6 traditional ma an damage grad ented in Fig. 2 nerability ind ower intensiti excess from t nd between an ed respectivel dashed lines a nge from 6.1 e of about 55. ows the histo nce, in statisti s obtained. In alls within the was found to b
ulnerability anal
asonry buildin
(a)(b)
(c)(d) des and the vuln 2 corroborate ex approach t es. This can b the correspon nalytical and ly for each bu and the pink a
%, for intens 3% was obta gram and the ical terms, a m about 59% o e range of 2 be equal or lo lysis based on A ngs will reach nerability funct es the idea tha tend to be les be clearly see nding vulnera observed dam uilding assess area). As can ity VIII, up to ined for inten e best-fit Gaus mean relative of the cases, th 20%, highligh ower than 10% ANNs h levels of se
tions for intensi at the mean d ss conservativ en in Fig. 2(a) ability curves
mage, Fig. 3( sed and for ea be observed i o 20.3%, for nsities V and ssian curve re e deviation va he relative de hted in pink in % (highlighte evere damage
ities: (a) IEMS 9
damage value ve than those ) and 2(b), w . (a) presents th ach macrosei in Fig. 3(a), t intensity V, w VI (identified esulting from alue of about eviation foun n Fig. 3(b), a d in light red (total or 98 = V; (b) VI; s estimated observed in where most he relative smic the average whereas a d with the m the 15.75, with d between and in about d).
Verso: Fro Recto:Tia Front. Stru RESEARC https://doi Fig. 3 R assessed;
4 The
4.1 Ge
ANNs ar their per Accordin ANN an is one of differenc already k layers ar output neont. Struct. Civ go Miguel FER uct. Civ. Eng. 2 CH ARTICLE i.org/10.1007/s Relative deviatio and (b) histogra
e ANNs
eneral form
re computing formance (lea ng to Drew an d its intended f the most freq ce over the en known. The f re referred to eurons, as sho . Eng. 2020 RREIRA et al. D 2020 11709-020-062 on between obs am with best-fitmulation
g systems insp arn) to do tas nd Monson [2 d application. quently used. ntire training first layer of n as hidden bec own in Fig. 4 Damage and vu 23-6erved and estim t Gaussian curv pired by the b sks by conside 28], there are However, am . This learnin set, which is neurons repre cause they ha 4. ulnerability anal (a) (b) mated damage, u ve. biological neu ering exampl e many learnin mong those, t ng algorithm a constituted o esents the pre ave no direct
lysis based on A
using the vulne
ural networks les, generally ng algorithm the Paul Werb attempts to m of a large num selected inpu contact with ANNs erability index a s, which can p without task s available de bos’s backpro minimize the l mber of cases ut parameters data other tha
approach: (a) fo progressively k-specific prog epending on t opagation alg least mean sq for which th whereas the an through th or each building y improve gramming. the type of gorithm [29] quare e outcome is middle he input and g
Verso: Fro Recto:Tia Front. Stru RESEARC https://doi When input and obtained connecti the error training p should b overcom error app Fig. 4 A A gen input lay hidden la propagat which tra
ont. Struct. Civ go Miguel FER uct. Civ. Eng. 2 CH ARTICLE i.org/10.1007/s the network d the hidden l d from this co ons to reduce r is minimized period. To im e proportiona mpensate, and proaches the g ANN inspired fr neral MFFNN yer, 16 AN in ayer was cho tion algorithm ansforms the . Eng. 2020 RREIRA et al. D 2020 11709-020-062 is set up, ran layers, and th mparison is t e the least me d. As explain mprove the ca ally inverse to
the error cur global minim
rom human syna N was adopted n one hidden l sen by a trial m. Each artifi input signals Damage and vu 23-6 ndom weights he ANN outpu
then back pro ean square err ned in [28], th apacity of the o the complex rve will oscill ma.
apse. d for this wor
layer, and one and error pro cial neuron (A s (xi) in an ou
ulnerability anal
s are assigned uts are produ opagated throu
ror, i.e., the b he degree of a ANN to dete xity of the pr late widely, ra rk, which is co e AN in the o ocess. The AN AN) of an AN utput result (tr lysis based on A d to the conne uced and comp
ugh the netw best fit with th adjustment pe ect subtle patt oblem, otherw ather than osc
omposed by t output layer. T NN was train NN is a comp rying to repro ANNs ections betwe pared with tru ork, changing he data. This er learning rou
terns within t wise the ANN cillating to a
two artificial The number o ned using the
putational ele oduce the beh
een the neuron ue data. The g the weights process is rep utine is set be the data, such N will tend to minimized de neurons (AN of artificial ne common erro ment, as show havior of a bra ns in the error s of the peated until efore the h adjustment o egree as the N) in the eurons in the or back-wn in Fig. 5, ain cell).
Verso: Fro Recto:Tia Front. Stru RESEARC https://doi Fig. 5 S The ac the weig The ou sigmoid During weights The al the conv used to i As dep (Iv) and t output re adjusted, mean est ANN.
ont. Struct. Civ go Miguel FER uct. Civ. Eng. 2 CH ARTICLE i.org/10.1007/s ingle artificial n ctivity vj of o ghts (wi) of ea utput result is function (Eq g the training (Eq. (8)), iter lgorithm conv vergence rate ncrease the a picted in Fig. the macroseis esult, correspo , trying to avo timation of da . Eng. 2020 RREIRA et al. D 2020 11709-020-062 neuron represen ne AN is giv ach connectio s dependent o . (7)), so this g process, the ratively, to m _ vergence rate is low, otherw algorithm con . 6, the set of smic intensity onding to the oid the over-t amage. The N Damage and vu 23-6 ntation. en by Eq. (6) n. on the compu was an obvio implemented minimize the n _ e is ruled by t
wise the rate nvergence rate f training vect y values (IEMS e 90 buildings training of th NEUNET sof ulnerability anal ), which is the 0 ∑ 1 utation of the ous choice fo ∙ 1 d back-propa network error ⋅ ∑ , the learning p will be increa e.
tors was comp S-98), as the in s referred in S he ANN (train ftware [30] w lysis based on A e result of the ⋅ (6) activation fun or the present tanh (7) gation algorit s Zij. _ parameter, . ased. A mom posed by the nput data, and Section 2. Th ning with = was used in thi
ANNs e combination nction f(v). It study. thm tries to a _ ( If the value o mentum fact normalized v d the mean da he level of trai = 0.05 and = is work for tr n of the input t is usual the a
adjust the con
(8) of this parame tor (0 ≤ ≤ 1 vulnerability amage grade ( ining was em = 0.1) to assu raining and pr t signals and adoption of a nnection eter is small, 1) can also be index values ( ), as the mpirically ure a good rocessing the a e
Verso: Fro Recto:Tia Front. Stru RESEARC https://doi Fig. 6 A
4.2 Co
The accu The appl mean va the vulne (colored discrete D4, and t Fig. 7 O Whenont. Struct. Civ go Miguel FER uct. Civ. Eng. 2 CH ARTICLE i.org/10.1007/s Adopted ANN a
omparison
uracy of the A lication of the lue of 2.03 an erability inde in black in th damage grad the remaining Observed versus opposing the . Eng. 2020 RREIRA et al. D 2020 11709-020-062 architecture.n between
ANN develop e ANN to the nd a standard ex approach. F he following e ranging bet g 7% a discre s estimated mea e mean dama Damage and vu 23-6estimated
ped in the sco e same buildin d deviation of From the mea Fig. 7), it is p tween D0 to D ete damage gr an damage grad ge grade distr ulnerability anal
and obser
pe of this wo ng sample res f 1.03, which an damage gr possible to ob D2, about 22% rade of D5, co de distributions, ribution obta lysis based on Arved dama
ork is analyze sulted in a da is about 58.6 rade distributi bserve that ab % present a di orresponding resorting to the ined with theANNs
age
d and discuss amage distribu 6% higher tha ion obtained bout 71% of t iscrete damag to “total or n e ANN. e ANN to thatsed in the pre ution charact an that estima with the ANN the buildings ge grade betw near total colla
t of observed esent section. erized by a ated through N alone present a ween D3 and apse.” damage
Verso: Fro Recto:Tia Front. Stru RESEARC https://doi the obser for which grades su Simila grades an V to VII Fig. 8 O =VII; (d) I From values es (IEMS-98 = observe t individua This is obtained this figur In compa the ANN 3(a). The 31.3%. I deviation
ont. Struct. Civ go Miguel FER uct. Civ. Eng. 2 CH ARTICLE i.org/10.1007/s rved damage h the differen uch differenc arly to what h nd the vulner I, is shown in Observed mean d IEMS-98 =VIII. the analysis o stimated throu = VII and IEM
that no overfi al point (or g s also clear in d for each buil re, the averag arative terms N when comp e maximum r In statistical te n of 14.14. . Eng. 2020 RREIRA et al. D 2020 11709-020-062 distribution w nce found bet ce is lower tha has been done rability functi n Fig. 8.
damage grades of Fig. 9, one ugh the use o MS-98 = VIII), d fitting has occ group of point n the bar char lding assesse ge relative dev
, these values ared with tha relative devia erms, it was o Damage and vu 23-6 with quite a g tween observ an 5%. e in the previo ions derived b versus ANN-d e can observe of the ANN w depicted in F curred, since t ts) of the data rt presented in ed and for eac
viations rang s reflect the s at obtained wi ation obtained obtained a me ulnerability anal good precisio ed and estima ous Section 3 by the ANN f (a)(b) (c)(d) derived vulnerab that a very sa was achieved, ig. 8(c) and 8 the curves do a set. n Fig. 9(a), w ch macroseism ge from 1.4% ignificant im ith the traditi d with the AN ean relative d lysis based on A on. In fact, wi ated damage 3, the compar for macroseis bility functions atisfactory ag particularly 8(d), respectiv o not reveal a
where the rela mic intensity to 3.2%, re mprovement of onal vulnerab NN is also low deviation valu ANNs
ith the except was about 1
rison between smic intensiti
:(a) IEMS-98 = V
greement betw for the higher vely. Furtherm
particular ad
tive and the a are illustrated spectively, fo f the approxim bility index ap wer, falling fr ue of about 0. tion of discret 11%, for all o n observed me ies in the rang
; (b) IEMS-98 =V
ween the mea r macroseism more, it is als djustment to a average devia d. As one can or intensities mation achiev pproach, show rom about 55. .8%, with a s te damage D3 other damage ean damage ge of IEMS-98= VI; (c) IEMS-98 an damage mic intensities so possible to any ations n observe in
VIII and VI. ved through wn in Fig. .5% to tandard 3 = s o
Verso: Fro Recto:Tia Front. Stru RESEARC https://doi The hi Fig. 9(b) found be (highligh values ob presented Fig. 9 R histogram
5 Prop
The fact somehow obtain th each mac o EMS the slopeont. Struct. Civ go Miguel FER uct. Civ. Eng. 2 CH ARTICLE i.org/10.1007/s istogram and ), from where etween analyt hted in pink a btained with d in Fig. 9(b) Relative deviatio m with best-fit G
posal of
that the origi w resembles a he parameters croseismic in 98 , in Eq. (9 e of the sigmo . Eng. 2020 RREIRA et al. D 2020 11709-020-062 the best-fit n e it is possible tical and obse and light red)
the traditiona ) is characteri on between obs Gaussian curve.
a new an
inal formulati a sigmoid fun s that best fits ntensity. Then 9), which will oid function: Damage and vu 23-6 normal curve e to observe t erved damage , representing al vulnerabilit ized by a meaerved and estim
nalytical
ion for estima nction (Eq. (7 s the ANN res n, the Least S l center the cu ulnerability anal resulting from that in about 8 e falls within g an improvem ty index appr an value of 0. (a) (b) mated damage, r
expressio
ating damage 7)), has led to sults. First, th quares Metho urve, and thelysis based on A m the statistic 81% and 56% the range of ment of abou roach, present .80 and a stan resorting to the
on for da
e in traditiona the idea of p he inflection p od (LSM) wa function ANNs cal treatment % of the cases 20% and ut 22.2% and ted in Fig. 3( ndard deviatioANN: (a) for e
amage es
al masonry bu programming point of the c as applied to o , in E of this data a s, the relative 10%, respect 20% in relati (b). The distri on of 14.84. each building asstimation
uildings, give a series of ro curve was ideobtain the fun Eq. (10), whic are given in e deviation tively ion to the ibution ssessed; and (b)
n
en by Eq. (2), outines to ntified for nction ch will adjust ) tVerso: Fro Recto:Tia Front. Stru RESEARC https://doi As the expressio intensity where, given by The an macrosei character Fig. 10 A This c (11), not importan seismic d increase increase The fi Section 2 for macr between pink and As it i work, giv tradition 90 buildi
ont. Struct. Civ go Miguel FER uct. Civ. Eng. 2 CH ARTICLE i.org/10.1007/s e original exp on proposed h y, IEMS-98, and i y Eq. (12) whi nalytical vuln ismic intensit ristic “S-shap Analytical vuln configuration t only because nt, because th damage in ma of the level o for higher in inal comparis 2, and the new roseismic inte
observed and d light red, res is possible to ven by Eq. (1 al mean dam ings) the devi
. Eng. 2020 RREIRA et al. D 2020 11709-020-062 pression propo herein (Eq. (1 the vulnerab s a third-degr ich was also
nerability fun ties, IEMS-98. A ped” or sigmo nerability functi can be interp e it follows th he configurati asonry buildi of damage for ntensities (IEM son between t w analytical v ensities from d analytical d spectively. observe, the 11), presents a
age grade for iation found b Damage and vu 23-6 0 EMS 98 osed by Bern 11)) estimate bility index, Iv 1 ree polynomi obtained usin 0.109 nction obtaine As can be see oid curve.
ion for different preted as a go he same spati ion of the sigm ings: low leve
r the central i MS-98> X). the observed m vulnerability V to VIII. To damage is low analytical vu a better adjus rmulation exp between the a ulnerability anal 86.8 7 0.037 0.0 nardini et al. [ s the mean da v. tanh ial that define ng the LSM: 0.82 ed through Eq en in Fig. 10, t macroseismic ood indicator ial shape of th moid curve a els of damage intensities (V mean damage functions giv o simplify the wer than 20% ulnerability fu stment to the pressed by Eq analytical val lysis based on A .7 EMS 98 004 [23], in Eqs. ( amage grade, es the upper li 0.032 q. (11) is pres the resulting intensities. of the suitabi he original ex djusts very w e for lower in V <IEMS-98 ≤ X e grades, , ven by Eqs. (2 e analysis, the and 10% are unction derive observed dam q. (2). Actual lue, obtained ANNs (9) (10) (2) and (3), th , ì , as a func (11 imit of the vu 2 sented in Fig. vulnerability ility of the pa xpression, but well to the the
ntensities (IEM X), and final s
for the build 2) and (11), a e cases for wh e given in foll
ed through th mage than tha ly, only in 17 through Eq. he vulnerabili ction of the m 1) ulnerability fu (12) 10 for differ y function fol arameters defi t also, and mo eoretical prog MS-98 ≤ V), a su tabilization o
ding stock des are presented hich the devia lowing Fig. 1 he ANN devel at resorting to 7% of the cas (11), is highe ity curve macroseismic unction, ent llows a
fined for Eq. ore gression of udden of this scribed in in Fig. 11, ation found 11, colored in loped in this o the es (15 out of er than 20%, n
Verso: Front. Struct. Civ. Eng. 2020
Recto:Tiago Miguel FERREIRA et al. Damage and vulnerability analysis based on ANNs Front. Struct. Civ. Eng. 2020
RESEARCH ARTICLE
https://doi.org/10.1007/s11709-020-0623-6
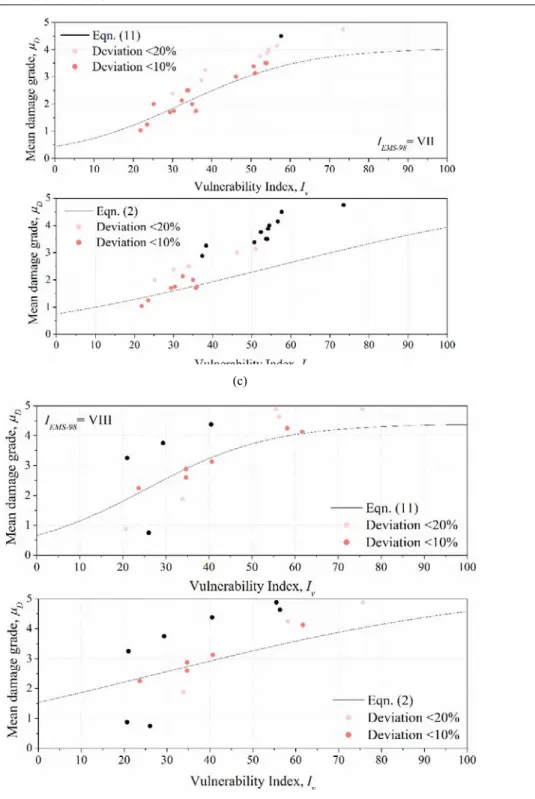
whereas, in the case of the traditional mean damage grade formulation, in Eq. (2), that percentage increases to 41% (37 out of 90 buildings). Moreover, it is important to note that this better approximation is observed for all the macroseismic intensity spectrum, not only for certain subsets of its domain.
(a)
Verso: Front. Struct. Civ. Eng. 2020
Recto:Tiago Miguel FERREIRA et al. Damage and vulnerability analysis based on ANNs Front. Struct. Civ. Eng. 2020
RESEARCH ARTICLE
https://doi.org/10.1007/s11709-020-0623-6
(c)
(d)
Fig. 11 Comparison between observed and estimated damage resorting to Eqs. (11) and (2) for macroseismic intensities: (a)
IEMS-98= V; (b) IEMS-98= VI; (c) IEMS-98 = VII; and (d) IEMS-98 = VIII.
Finally, Fig. 12 shows the vulnerability curves obtained with the new proposed analytical expression for different vulnerability index values, Iv.
Verso: Fro Recto:Tia Front. Stru RESEARC https://doi Fig. 12 V
6 Fina
The pres tradition vulnerab data coll tradition through t from the In gen in the inp approxim vulnerab underest (D0 and D slight ten observed 5%. The an 3 for the ANN, w the ANN Finally expressio analyzed to the Az the resea might be possessioont. Struct. Civ go Miguel FER uct. Civ. Eng. 2 CH ARTICLE i.org/10.1007/s
Vulnerability cu
al remark
sent paper dis al masonry b bility index m lected after th al stone maso the referred a e ANN results neral terms, th put layer, 16 mations than t bility index-ba timate damag D5), the appro ndency to ove d and estimate nalysis of the vulnerability ith a mean re N was slightly y, when comp on, presented d. However, th zorean traditi arch process h e used to obta on of sufficie . Eng. 2020 RREIRA et al. D 2020 11709-020-062
urves for differ
ks
scusses the po buildings thro method and an he 1998 Azore onry building approaches. F s. he ANN adop AN in one hi those obtaine ased approach ge, particularly oximation ob erestimate the ed damage w e deviations fo y index metho elative deviati y lower than t pared to the o d in Eq. (11), his expressio onal masonry herein idealiz ain optimized ently large po Damage and vu 23-6 rent vulnerabilit otential of usi ugh the comp n innovative a es earthquake gs, which was Furthermore, pted in this st idden layer, a ed with the or h has reveale y for the extr btained with A e damage for was about 11 found between od and in Fig ion value of a that obtained original expre provides a m on cannot be s y building typ zed can be see d vulnerability ost-earthquake ulnerability anal ty index values ing alternativ parative analy approach base e was used to s then critical a new analyti tudy, a genera and one AN in riginal seismi ed to be quite reme upper an ANN was quidamage grad %, for all oth
n analytical a g. 11 for the A
about 0.8% ag with the vuln ession of Bern much more acc
seen as a univ pology, but al en as a repres y functions fo e damage dat lysis based on A , Iv. e strategies to ysis of two di ed on the use o generate a d ly compared ical expressio al MFFNN co n the output l ic vulnerabilit non-conserv nd lower boun ite accurate. A de D3, for wh her damage g and observed ANN has conf gainst 16%. T nerability ind
nardini et al. curate predict versal alterna
lso to the eart sentative and or a specific b ta sets. ANNs o estimate sei ifferent appro of ANNs. Po data set of rea
with analytic on for damag omposed by t layer, allowed ty index appr ative, present nds of the me As discussed ich the differ rades such di damage, pres firmed the be The standard dex approach, [23], it is cle tion of damag ative, being na thquake of Ju compelling e building typol ismic damage oaches, a wid ost-earthquak al damage eva cal results obt e estimation w two artificial d to obtain m roach. In fact ting a tenden ean damage d in Section 4. rence found b ifferences are sented respec etter performa deviation obt 14.14 over 1 ear that the ne ge for the dat aturally limite uly 9, 1998. In example on h logy, whenev e in dely used ke damage aluation for tained was derived neurons (AN much better , whereas the cy to distributions 2, despite a between e lower than ctively in Fig. ance of the tained with 15.84. ew analytical ta set herein ed not only n any case, how ANN ver in the N) e .
Verso: Front. Struct. Civ. Eng. 2020
Recto:Tiago Miguel FERREIRA et al. Damage and vulnerability analysis based on ANNs Front. Struct. Civ. Eng. 2020
RESEARCH ARTICLE
https://doi.org/10.1007/s11709-020-0623-6
AcknowledgementsThis work was funded by the Portuguese Foundation for Science and Technology (FCT) through the postdoctoral Grant SFRH/BPD/122598/2016. The authors acknowledge to the Society of
Promotion for Housing and Infrastructures Rehabilitation (SPRHI) and to the Regional Secretariat for Housing and Equipment (SRHE) of Faial for their support and contribution to the development of this work. They would also like to express their gratitude to the anonymous reviewer for their insightful and constructive comments.
References
1. FerreiraT M, MaioR, CostaA A, VicenteR. Seismic vulnerability assessment of stone masonry façade walls: Calibration using fragility-based results and observed damage.Soil Dynamics and Earthquake Engineering, 2017, 103: 21–
37doi:10.1016/j.soildyn.2017.09.006
2. KapposA J. An overview of the development of the hybrid method for seismic vulnerability assessment of buildings.Structure and Infrastructure Engineering, 2016, 12(12): 1573–1584doi:10.1080/15732479.2016.1151448
3. FerreiraT M, MendesN, SilvaR. Multiscale seismic vulnerability assessment and retrofit of existing masonry buildings.Buildings, 2019, 9(4): 91doi:10.3390/buildings9040091
4. RezaeiS, ChoobbastiA J. Liquefaction assessment using microtremor measurement, conventional method and artificial neural network (Case study: Babol, Iran).Frontiers of Structural and Civil Engineering, 2014, 8(3): 292–307doi:10.1007/s11709-014-0256-8
5. ZakianP. An efficient stochastic dynamic analysis of soil media using radial basis function artificial neural network.Frontiers of Structural and Civil Engineering, 2017, 11(4): 470–479doi:10.1007/s11709-017-0440-8
6. AbdollahzadehG, ShabanianS M. Experimental and numerical analysis of beam to column joints in steel structures.Frontiers of Structural and Civil Engineering, 2018, 12(4): 642–661doi:10.1007/s11709-017-0457-z
7. ReyesJ, Morales-EstebanA, Martínez-ÁlvarezF. Neural networks to predict earthquakes in Chile.Applied Soft Computing, 2013, 13(2): 1314–1328doi:10.1016/j.asoc.2012.10.014
8. HuangC S, HungS L, WenC M, TuT T. A neural network approach for structural identification and diagnosis of a building from seismic response data.Earthquake Engineering & Structural Dynamics, 2003, 32(2): 187–206doi:10.1002/eqe.219
9. MolasG L, YamazakiF. Neural networks for quick earthquake damage estimation.Earthquake Engineering & Structural Dynamics, 1995, 24(4): 505–516doi:10.1002/eqe.4290240404
10. Bani-HaniK, GhaboussiJ, SchneiderS P. Experimental study of identification and control of structures using neural network. Part 2: Control.Earthquake Engineering & Structural Dynamics, 1999, 28(9): 1019–1039
doi:10.1002/(SICI)1096-9845(199909)28:9<1019::AID-EQE852>3.0.CO;2-X
11. FerrarioE, PedroniN, ZioE, Lopez-CaballeroF. Bootstrapped Artificial Neural Networks for the seismic analysis of structural systems.Structural Safety, 2017, 67: 70–84doi:10.1016/j.strusafe.2017.03.003
12. MorfidisK, KostinakisK. Approaches to the rapid seismic damage prediction of r/c buildings using artificial neural networks.Engineering Structures, 2018, 165: 120–141doi:10.1016/j.engstruct.2018.03.028
13. MorfidisK, KostinakisK. Seismic parameters’ combinations for the optimum prediction of the damage state of R/C buildings using neural networks.Advances in Engineering Software, 2017, 106: 1–16doi:10.1016/j.advengsoft.2017.01.001
14. VazirizadeS M, NozhatiS, ZadehM A. Seismic reliability assessment of structures using artificial neural network.Journal of Building Engineering, 2017, 11: 230–235doi:10.1016/j.jobe.2017.04.001
15. AnitescuC, AtroshchenkoE, AlajlanN, RabczukT. Artificial neural network methods for the solution of second order boundary value problems. Computers,Materials & Continua, 2019, 59(1): 345–359doi:10.32604/cmc.2019.06641
16. GuoH, ZhuangX, RabczukT. A deep collocation method for the bending analysis of Kirchhoff plate.Computers, Materials & Continua 2019; 59(2): 433–456 DOI: 10.32604/cmc.2019.06660
17. WangZ, PedroniN, ZentnerI, ZioE. Seismic fragility analysis with artificial neural networks: Application to nuclear power plant equipment.Engineering Structures, 2018, 162: 213–225doi:10.1016/j.engstruct.2018.02.024
18. EstêvãoJ M C. Feasibility of using neural networks to obtain simplified capacity curves for seismic assessment.Buildings, 2018, 8(11): 151–164doi:10.3390/buildings8110151
19. WoodH O, NeumannF. Modified Mercalli intensity scale of 1931.Bulletin of the Seismological Society of America, 1931, 21(4): 277–283
Verso: Front. Struct. Civ. Eng. 2020
Recto:Tiago Miguel FERREIRA et al. Damage and vulnerability analysis based on ANNs Front. Struct. Civ. Eng. 2020
RESEARCH ARTICLE
https://doi.org/10.1007/s11709-020-0623-6
20. FerreiraT M, MaioR, VicenteR. Seismic vulnerability assessment of the old city centre of Horta, Azores: Calibration and application of a seismic vulnerability index method.Bulletin of Earthquake Engineering, 2017, 15(7): 2879–2899 doi:10.1007/s10518-016-0071-9
21. OliveiraCS, CostaA, NunesJC. The 1998 Açores Earthquake: A Decade Later. 2008 (in Portuguese)
22. ZonnoG, OliveiraC S, FerreiraM A, MusacchioG, MeroniF, Mota-de-SáF, NevesF. Assessing seismic damage through stochastic simulation of ground shaking: The case of the 1998 Faial Earthquake (Azores Islands).Surveys in Geophysics, 2010, 31(3): 361–381doi:10.1007/s10712-009-9091-1
23. BernardiniA, GiovinazziS, LagomarsinoS, ParodiS. Vulnerability and damage prediction at the territorial scale according to a macroseismic methodology consistent with the EMS-98 scale. In: Proceedings of the 12th Conference of the Italian National Association of Earthquake Engineering. Pisa: ANIDIS, 2007
24. GrünthalG. European Macroseismic Scale 1998 (EMS-98). Luxembourg: European Center for Geodynamics and Seismology,1998.
25. VicenteR, ParodiS, LagomarsinoS, VarumH, SilvaJ A R M. Seismic vulnerability and risk assessment: Case study of the historic city centre of Coimbra, Portugal.Bulletin of Earthquake Engineering, 2011, 9(4): 1067–1096doi:10.1007/s10518-010-9233-3
26. LagomarsinoS, GiovinazziS. Macroseismic and mechanical models for the vulnerability and damage assessment of current buildings.Bulletin of Earthquake Engineering, 2006, 4(4): 415–443doi:10.1007/s10518-006-9024-z
27. BrameriniF, Di PasqualeG, OrsiniA, PuglieseA, RomeoR, SabettaF. Seismic Risk of the Italian Territory. Proposal for a Methodology and Preliminary Results. Technical Report N. SSN/RT/95/01. Roma,1995
28. DrewP J, MonsonJ R T. Artificial neural networks.Surgery, 2000, 127(1): 3–11doi:10.1067/msy.2000.102173
29. WerbosP J. Beyond Regression: New Tools for Prediction and Analysis in the Behavioral Sciences. Cambridge: Harvard University, 1974
30. EstêvãoJ M C. Computer Model for Buildings Seismic Risk Assessment. Lisbon: Instituto Superior Técnico, UTL, 1998 (in Portuguese)