F
ACULTY OF
E
NGINEERING OF THE
U
NIVERSITY OF
P
ORTO
Algorithms and Technologies for
Inspection Places
Jorge Miguel Marques Ribeiro
A thesis submitted for the degree of
Doctor of Philosophy in Leaders for Technical Industries
Supervisor: Prof. António Paulo Gomes Mendes Moreira (Ph.D.)
Co-supervisor: Prof. Agostinho Gil Teixeira Lopes (Ph.D.)
Abstract
In such competitive and global world where we live, the technology plays an important role on approaching people and enhancing their life conditions. Nevertheless, all the de-velopment faced along the time has the major responsibility of the most extraordinary creature: the Human. He is, in fact, the most important player for the significant changes and enhancements in our life conditions, making available to people the necessary tools to reach those goals.
The use of technology under the industrial context shall mainly focus on the working conditions improvement and, whenever possible, improving the manufacturing process performance. However, in order to have broader and robust approach to any process im-provement, the focus shall be addressed to the Human. Human Resources are the most differentiated elements of any organization, once they are the natural engine to execute the change within the organization.
The inspection processes, as part of the manufacturing process, point to the quality as-surance of the product, in order to grant the customer satisfaction. Although inspection processes are not added-value processes, they are crucial to guarantee the organization’s image and perception from the customers point of view. A long-lived relation between the organization and the customers is also based on the credit build-up between them and the high quality standards provided by the organization.
The trend of the replacement of the Human by automatic systems verified over time has been essential to reach significant manufacturing process improvements, especially in what concerns the process costs and the guarantee of an uniform inspection process. In the beginning, this approach has been followed in repetitive tasks, where the human con-tribution was mainly by means of physical interactions, i.e. where the human intelligence did not play a significant role. This kind of approach has been also followed in other inspection processes, in particular on those where the human contribution is crucial to assure the product quality. Some of the disappointing results obtained are caused by the difficulty of gathering the intrinsic knowledge as a result of the cognitive processes used, with special emphasis on the extraordinary ability Humans have to quickly adapt to sud-den changes in the manufacturing process with impact on the final product quality. Although the significant number of scientific contributions in this research area, the re-placement of Humans by automatic systems did not always obtain the expected results. Part of this failure might be addressed to the absence of people performing the inspection in the development process of the new solution. The operators who perform the inspec-tion are the ones carrying the intangible knowledge that allows the quality assurance of the inspection process with high quality standards.
Facing the challenge of improving the process performance of an inspection process, to-i
ii
tally done by Humans, one seeks for a structured approach to the problem focusing the development of the potential solution on the operator, using the technology as a way to help him, allowing the continuous introduction of process improvements along the time. One of the biggest challenges one might face is the operator’s awareness as well as to keep away the fear about the technology becoming a threat for their job positions. Those aspects forced to develop intense and continuous work with them to gather their difficul-ties, methods, and knowledge with the aim of developing a solution that incorporates their contributions and that could improve their working conditions.
The careful approach to the problem is also extended to the technology assessment and selection process that better fit in the inspection context, assuring a smooth adoption and diffusion process by the users, granting the desired compatibility between Humans and Technology. This compatibility shall also be inherent to the interface design adopted in the new inspection solution, leading to the enhancement of the inspection process perfor-mance by means of cost reduction granted by faster and more effective inspection. The interaction between the technology and the human shall be seen as a way for tech-nology serving the human needs, i.e. enhancing their life conditions. The transition from a purely manual process to a system that combines humans and technology, that evolves along the time, and adapts to different contexts, implies a different sight to the inspection process. The significant change expected in the inspection process requires a model which highlights the influence of the diverse variables that contribute to the inspection process performance, allowing the identification of the improvement elements and reinforcing the learning process.
The paradigm and mentality changes within an organization are extremely complex and critical. The very promising results obtained along the entire project create the idea that those changes are possible, even for those who were not so optimistic in the beginning of this path due to the complexity of the problem in hands in combination with the very demanding goals and unsuccessful results of previous attempts. The confidence demon-strated by the various entities involved in the project, the decision of the company to proceed with the industrialization of the solution proposed, and the extremely positive feedback from the operators, disseminate the idea that one followed the right approach to the problem. Being part of the changing process, contributing at the same time for the notion that human contribution is fundamental in any technical development, makes me proud and conscious that the scientific, industrial and personal objectives were reached.
Resumo
Num mundo globalizado e altamente competitivo como aquele em que vivemos, a tec-nologia tem um papel fundamental na aproximação dos povos e na melhoria das condições de vida das pessoas. No entanto, todo o desenvolvimento que se tem verificado ao longo dos tempos tem a responsabilidade maior do ser mais extraordinário que se conhece: o Ser Humano. É ele o verdadeiro responsável pelas profundas alterações e melhorias nas nossas condições de vida, colocando ao dispor das pessoas os meios e as ferramentas necessárias à obtenção desses grandes objetivos.
A utilização da tecnologia em contexto industrial deve visar, no seu essencial, a melhoria das condições de trabalho e, sempre que possível, melhorar o desempenho dos processos de manufatura. Contudo, o foco de uma abordagem mais abrangente e robusta para a melhoria de qualquer processo, deve ser o Homem. O grande fator diferenciador de qual-quer organização é o capital humano, os seus Recursos Humanos. São eles os verdadeiros motores da mudança que uma organização poderá ambicionar alcançar.
Os processos de inspeção, sendo parte integrante do processo de manufatura, pretendem garantir a excelência do produto, de forma a garantir a plena satisfação dos clientes a quem se dirige. Não sendo processos de valor acrescentado, os processos de inspeção são fundamentais para a garantia da imagem e perceção dos clientes face à organização com quem estabelecem uma relação. O valor da confiança entre organização e cliente é extremamente importante para consolidar uma relação que se pretende duradoura e com elevados padrões de qualidade.
A tendência verificada ao longo do tempo de substituição do Homem por sistemas de automação foi fundamental para a obtenção de melhorias significativas nos processos de fabrico ao nível do seu custo e da capacidade de ter um padrão de inspeção uniforme ao longo do tempo. Esta abordagem foi inicialmente focada em processos altamente repeti-tivos e mecanizados, onde a contribuição humana se centrava, essencialmente, nos aspetos físicos, ou seja, em processos em que a contribuição da inteligência humana era pouco significativa. Este tipo de abordagem generalizou-se para outros processos de inspeção, nomeadamente naqueles em que o contributo humano se revela essencial para a garantia da qualidade do produto. Os resultados nem sempre foram um sucesso pela dificuldade de adquirir o conhecimento intrínseco resultante dos processos cognitivos adoptados, em particular pela extraordinária capacidade humana de se adaptar rapidamente a variações circunstanciais no processo de manufatura.
Apesar dos imensos contributos científicos existentes nesta área de investigação, a substi-tuição do Homem por sistemas autónomos nem sempre tem verificado bons resultados. Parte desse insucesso pode ser atribuído à ausência da contribuição das pessoas que in-tegravam o processo de inspeção no desenvolvimento de novos processos. São essas
iv
pessoas as portadoras do conhecimento intangível que possibilita a garantia de elevados padrões de qualidade do processo de inspeção.
Colocado perante um desafio de melhorar o desempenho de um determinado processo de inspeção, totalmente manual, é fundamental estruturar esse problema de uma forma coerente e prática centrando o desenvolvimento de uma possível solução no operador, uti-lizando a tecnologia como meio para o ajudar, possibilitando a introdução de melhorias nesse processo ao longo do tempo. A exigente tarefa de captar o interesse dos oper-adores, assim como afastar o receio da tecnologia se tornar uma ameaça aos seus postos de trabalho, obrigou a um intenso e persistente trabalho junto daqueles que realizam a inspeção, no sentido de absorver melhor as dificuldades, os métodos e o conhecimento existente, e desenvolver uma solução que incorporasse os seus contributos e melhorasse as suas condições de trabalho.
O cuidado a ter com a abordagem ao problema é igualmente extensível ao processo de seleção e escolha da(s) tecnologia(s) que melhor se adapta(m) ao contexto da inspeção, garantindo um suave processo de adoção e difusão pelos seus utilizadores, assegurando compatibilidade entre o Homem e a Tecnologia. Essa compatibilidade pode e deve tam-bém ser garantida através de um correto desenho das interfaces existentes, ambicionando, ao mesmo tempo, uma melhoria do desempenho do processo de inspeção, em particular com o objetivo de reduzir os seus custos através de uma inspeção mais rápida e mais efi-caz.
A interação entre a tecnologia e o ser humano deve ser vista como um meio para a tec-nologia servir os propósitos humanos, ou seja, melhorar as suas condições de vida de uma forma direta ou indireta. A passagem de um sistema puramente manual para um sistema que combina a tecnologia com o ser humano, e que evolui ao longo do tempo, adaptando-se às diferentes realidades, obriga a uma visão diferente do processo de inspeção. Esta alteração deve ser modelada de forma a ser perceptível a influência das diversas variáveis no desempenho do processo de inspeção, permitindo ao mesmo tempo a identificação dos fatores de melhoria e reforçando o processo de aprendizagem.
A mudança de paradigma e, também, de mentalidades dentro de uma organização afigura-se complexa e de difícil alcance. Os resultados extremamente positivos verificados ao longo de todo o projeto permitiram fazer acreditar que era possível, mesmo aqueles que se mostravam mais cépticos no seu início, devido à exigência dos objetivos, da complexi-dade do problema e do historial de experiências mal sucedidas. A confiança demonstrada pelas diversas entidades envolvidas neste projeto e a decisão de prosseguir a industri-alização da solução, assim como os comentários extremamente positivos por parte dos operadores, transmitem a confiança necessária para acreditar que o caminho seguido foi o correto. Fazer parte dessa mudança, tendo ao mesmo tempo contribuído para passar a mensagem de que a inclusão do Homem no desenvolvimento de qualquer solução tec-nológica é fundamental, deixam a sensação de orgulho e de ter atingido os objetivos científicos, industriais e pessoais.
Résumé
Dans un monde globalisé et hautement concurrentiel comme celui que nous vivons, la technologie a un rôle vital à rassembler les gens et l’amélioration des conditions de vie des populations. Cependant, tout le développement qui a été vu à travers les âges a la plus grande responsabilité d’être plus extraordinaire que nous connaissons: l’Être Humain. Il est vraiment responsable des profonds changements et des améliorations dans nos con-ditions de vie, en mettant à la disposition des personnes ayant les moyens et les outils nécessaires pour atteindre ces grands objectifs.
L’utilisation de la technologie dans un contexte industriel devrait viser, en substance, l’amélioration des conditions de travail et, si possible, améliorer la performance des pro-cessus de fabrication. Toutefois, la mise au point d’une approche plus globale et robuste à l’amélioration de tout processus, devrait être l’homme. Le grand facteur de différenci-ation pour toute organisdifférenci-ation est son capital humain, ses Ressources Humaines. Ils sont les véritables moteurs du changement qu’une organisation peut aspirer à atteindre. Le processus d’inspection, qui fait partie intégrante du processus de fabrication, cherchent à assurer l’excellence du produit, afin d’assurer la satisfaction complète des clients à qu’il s’adresse. N’étant pas des processus à valeur ajoutée, les procédures d’inspection sont fondamentales pour assurer l’image et la perception des clients contre l’organisation avec qui ils établissent une relation. La valeur de la confiance entre l’organisation et le client est extrêmement important de construire une relation que si attente durable et basée sur des normes de qualité élevée.
L’ évolution dans le temps de remplacement de l’homme par les systèmes d’automatisation était essentielle pour obtenir des améliorations significatives dans les processus de fabri-cation au niveau de son coût et la possibilité d’avoir un modèle uniforme d’inspection au fil du temps. Cette approche a été d’abord porté sur les processus hautement répéti-tives et mécanisées où la contribution de l’homme portait principalement sur les aspects physiques, c’est à dire dans les cas où la contribution de l’intelligence humaine était nég-ligeable. Cette approche a été généralisée à d’autres processus d’inspection, en particulier ceux où la contribution de l’homme est essentiel pour assurer la qualité du produit. Les résultats ne sont pas toujours un succès en raison de la difficulté d’acquérir la connais-sance intrinsèque résultant des processus cognitifs adoptées notamment par la capacité extraordinaire des humaines à s’adapter rapidement aux changements de situation dans le processus de fabrication.
Malgré les énormes contributions scientifiques existantes dans ce domaine de recherche, le remplacement de l’homme par des systèmes autonomes n’a pas toujours vu de bons résultats. Une partie de cette défaillance peut être attribuée à l’absence de la contribution des personnes qui ont fait partie de la procédure d’inspection dans le développement de
vi
nouveaux procédés. Ces personnes sont les porteurs de connaissances intangibles qui per-met d’assurer des normes élevées de qualité du processus d’inspection.
Face à un défi d’améliorer la performance d’un processus d’inspection particulier, en-tièrement manuel, c’est fondamental de structurer ce problème d’une forme cohérente et pratique pour développer une solution centrée à l’opérateur, en utilisant la technologie comme un moyen d’aider, rendant possible la l’amélioration du processus au fil du temps. La tâche exigeante de capter l’intérêt des opérateurs ainsi que conjurer la peur de la tech-nologie deviennent une menace pour leurs emplois, forcé au travail intense et persistant avec ceux qui font l’inspection afin de mieux absorber les difficultés,les méthodes et les connaissances existantes, et développer une solution qui intégre leurs contributions et qui peut améliorer leurs conditions de travail.
Le soin de la solution au problème est également étendu à la sélection et évaluation des technologies qui répondent le mieux dans le contexte du processus d’inspection, d’assurer un bon déroulement du processus d’adoption et la diffusion par ses utilisateurs, et pour as-surer la compatibilité entre l’Homme et la Technologie. Cette capacité doit également être assurée par une conception correcte des interfaces existantes, convoitant tout en amélio-rant la performance du processus d’inspection, en particulier dans le but de réduire leurs coûts grâce à des inspections plus rapides et plus efficace.
L’interaction entre la technologie et l’être humain doit être considéré comme un moyen de la technologie pour servir des fins humaines, à savoir, pour améliorer les conditions de vie d’une manière directe ou indirecte. La transition d’un système purement manuel à un système qui combine la technologie avec des êtres humains, qui évolue au fil du temps, et qui s’adapt à des situations différentes, nécessite un point de vue différent du processus d’inspection. Ce changement doit être conformée de manière à être sensible à l’influence de plusieurs variables sur les performances du processus d’inspection, tout en permettant l’identification des facteurs améliorant et en renforçant le processus d’apprentissage. Le changement de paradigme et aussi des mentalités au sein d’une organisation, était com-plexe et difficile à atteindre. Les résultats très positifs observés tout au long du projet ont conduit à croire que c’était possible, même pour ceux qui étaient les plus sceptiques au début, en raison de l’exigence des objectifs, de la complexité du problème et une histoire de mauvaises expériences. La confiance témoignée par les différentes entités impliquées dans ce projet et la décision de poursuivre l’industrialisation de la solution, ainsi que les évaluations très positives des opérateurs, transmettre la confiance de croire que le chemin suivi était le bon. Faire partie de ce changement, tout en contribuant en même temps à transmettre le message que l’inclusion de l’Homme dans le développement de toute solu-tion technologique est essentiel établi le sentiment de fierté et d’avoir atteint les objectifs scientifiques, industriels et personnels.
Acknowledgments
First of all, I would like to thank to my supervisor, Prof. António Paulo Moreira, for his continuous support, for being patient, for giving me advises in the different contexts, and for pushing me to achieve the goals of my research and the goals of the industrial project. All his knowledge and great ideas contribute for a successful research and industrial re-sults. I would like to express my acknowledge for the availability always demonstrated along the entire PhD and his sense of criticism that push my motivation higher and chal-lenging me to pursue the perfection. I cannot forget the importance Prof. António Paulo Moreira had by inviting me for the AutoClass project.
I would also like to thank to my co-supervisor, Prof. Gil Lopes for his availability, for the useful ideas given along the project, and for the contributions to my thesis.
The PhD resulted in a team work where several people were involved in. I must highlight the importance of someone that impresses me every day for the professionalism, sense of creativity and passion for the work. The successful of the project and the very interesting and promising results achieved so far had a great contribution of Eduarda. We had tough discussions along this path but we have always keep the immense respect we have from each other. We are both passionate and we hardly fight for our ideas. At the end, we only care about the successful of the team work on top of our own interests. Every day has been a pleasure to work with you, for your creativity, for challenging me to overcome the obstacles we have faced along the way, and for your special way of creating a friendly environment where everybody feels comfortable to accomplish the goals. I am pretty sure the future will be bright and you will achieve all your professional objectives always keeping a smile on your face.
The results obtained in the project could not be gotten without the contribution of Paulo Malheiros, João Paulo Silva, and Bruno Pereira. The visibility and importance of your work were probably not always recognized outside of the team, but you know how much I appreciated it. Your inputs, ideas and outstanding work contribute in a very decisive way for the results obtained in the project. You are professionals with whom I would like to work again, once you never refuse a challenge and you always provide trustful and very competent work.
I want also to thank to Prof. Paulo Costa, for his sense of pragmatism and for the simple and great ideas that enhanced my work and contribute in a very significant way to the results of the project.
To my colleague Michael Donauer who has also been part of this project and with whom I shared a lot of ideas and, together with Eduarda, we prepare the presentations for the company with very good results.
To my colleagues and friends from the Doctoral Program with whom I had the pleasure vii
viii
to work with along the courses: Ricardo, Filipe, Anton, and Tiago. We have developed a truly team work and I believe that it was the right way to build a team spirit.
To all my friends and family for being so patient with my absences and for believing in my work and my capabilities to reach the goals.
To my sister, my brother-in-law, and my nephews for being so proud of my results and for supporting my family when I could not provide the support they request.
To my parents, for pushing me so hard to not accept the average and pursuing the best in every single thing I do. For challenging me to face the obstacles as opportunities and to not give up even when everything seems to be leading to that end. I know how much proud you have on me and in my work, but this would not be possible without your ef-forts, your commitment, love and respect for your sons.
Last, but for sure not least, to my loyal wife Ana, my lovely daughter Inês, and to my cheerful son Miguel. You have been always my foundations and my source of motivation in every single day of my PhD. Ana, you have been always the one accepting my choices, giving all the support that makes this PhD possible. You could compensate my absence when our children need both of us. Everybody can see the great mother and the great woman you are by the lovely children we have and for making possible the conclusion of the PhD on the schedule. I want to apologize for my absences and for my selfishness in adopting this way, but I am sure this will contribute for a better future for our family, and especially for our children.
Institutional Acknowledgments
To Foundation for Science and Technology, Lisbon, through 3° Quadro Comunitário de Apoio, and the POCTI and FEDER programmes. I also acknowledge FCT for PhD schol-arship supporting my research along the entire project and the MIT-Portugal program (Engineering Design and Advanced Manufacturing focus area) for creating the necessary conditions to realize my PhD. To Faculty of Engineering of the University of Porto, for hosting me since the beginning of the Doctoral Program, and to to INESC TEC for all the support provided along the project.
This project has not been possible without Continental. I would like to express my grat-itude to the company for providing all the necessary conditions to perform the research. Continental made available all the resources (human resources, data, and capital) that al-low to proceed with the project with successful results. I would also like to thank to all managers, engineers, technicians, and operators from the different Departments who have always show availability to create the conditions to perform my work, and to the mem-bers of the Steering Committee for your feedback and inputs along the entire project. A special thank must be addressed to all operators of Final Finishing area for their availabil-ity, tolerance, and insightful feedback along the entire project which make possible the achievement of the project goals.
“Any process is better than no process! A good process is better than a bad process. Even a good process can be made better!”
Michael Hammer
Contents
1 Introduction 1
1.1 Motivation . . . 2
1.2 Company description . . . 3
1.3 Tire Manufacturing Process Overview . . . 5
1.3.1 Process Data Overview . . . 6
1.3.2 Final Finishing Process Description . . . 8
1.4 Problem Statement . . . 12
1.4.1 Need of Process Automation . . . 13
1.4.2 Need of Virtual Inspection . . . 17
1.5 Research Methodology . . . 20
1.6 Structure of the document . . . 23
2 State-of-the-art 25 2.1 Handling Solutions . . . 26
2.1.1 Handling solutions available in the company . . . 26
2.1.2 Handling solutions available in the market . . . 30
2.1.3 Handling solutions under patent protection . . . 35
2.2 Technology Assessment and Selection . . . 46
2.3 Human-Machine Interfaces . . . 55
2.4 Decision models for semi-automatic systems . . . 60
3 Proposed Solution for Tire Inspection Process 65 3.1 General System Architecture . . . 69
3.1.1 Tire Image Acquisition System . . . 70
3.1.2 Tire Virtual Inspection . . . 76
3.2 System Validation . . . 81
3.2.1 Methods for System Validation . . . 81
3.2.2 Design of Experiments . . . 83
3.2.3 Statistical Analysis . . . 84
4 Technology Solutions Analysis 85 4.1 Technology Selection, Integration and Deployment Methodology . . . 85
4.1.1 Technology Pre-Selection Process . . . 87
4.1.2 Externalities Analysis . . . 91
4.1.3 Sensitivity Analysis . . . 96
4.1.4 Risk Assessment . . . 97 xiii
xiv CONTENTS 4.2 Case Study . . . 97 4.2.1 Tire Handling . . . 98 4.2.2 2D Vision . . . 106 4.2.3 3D Vision . . . 109 4.2.4 Thermal Infrared . . . 119
4.2.5 Proposed Solution for Tire Image Acquisition Station . . . 121
4.2.6 Results . . . 130
4.2.7 Road map for Technology Integration and Deployment . . . 135
4.2.8 Sensitivity Analysis . . . 145
4.2.9 Risk Assessment . . . 149
4.2.10 Conclusions . . . 149
5 Human-Machine Interfaces 151 5.1 HMI development methodology . . . 151
5.2 HMI Features . . . 154 5.3 Interface Designs . . . 156 5.3.1 Interface Design 1 . . . 156 5.3.2 Interface Design 2 . . . 157 5.3.3 Interface Design 3 . . . 158 5.4 Preliminary Results . . . 160
5.5 Data Collection and Analysis . . . 164
5.6 As-is and Proposed Solution Comparison . . . 174
5.7 Conclusions . . . 175
6 Decision Model for Tire Inspection Solution 179 6.1 Automatic tire detection system characterization and model . . . 180
6.2 Virtual tire inspection system characterization and model . . . 181
6.3 Proposal for tire inspection system decision model . . . 185
7 Conclusions 187 7.1 Scientific Contributions . . . 188
7.2 Future Work . . . 189
A Data structure to support FISA 191
B Survey used in the first phase of experiments with operators 193
C Training session sheet example 195
List of Figures
1.1 Continental AG global locations (source: Wikipedia [1]) . . . 4
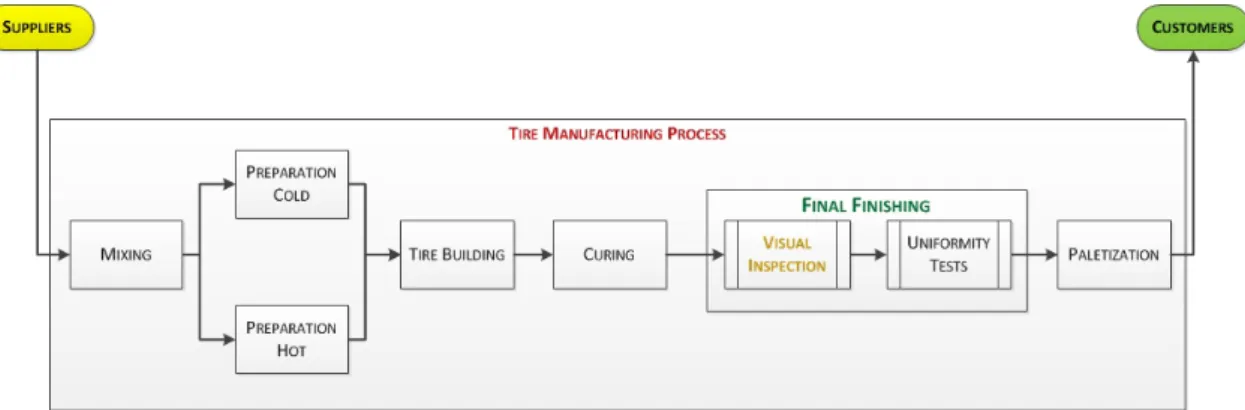
1.2 General tire manufacturing process from the raw materials supplier until the final customer . . . 5
1.3 The structure of a tire and part names (source: Hankook [2]) . . . 6
1.4 Meaning of the different tire dimensions placed in the tire sidewall (source: Engine Basics[3]) . . . 7
1.5 Pareto of the Non-Conformity (NC) occurrence . . . 8
1.6 Detailed view over the final finishing process flow . . . 8
1.7 Grader’s task timings acccording to tire quality grade decision . . . 9
1.8 Information insertion into the system according to production volume . . 10
1.9 Visual Inspection process flow . . . 11
1.10 Time distribution over the different tasks performed by the Visual Inspec-tor (VI) . . . 12
1.11 Inspection time variability among the different Visual Inspectors (VIs) of a shift . . . 12
1.12 Tires with the same kind of imperfection assessed in different ways . . . . 15
1.13 Imperfections caught at the overinspector station by tire surface . . . 16
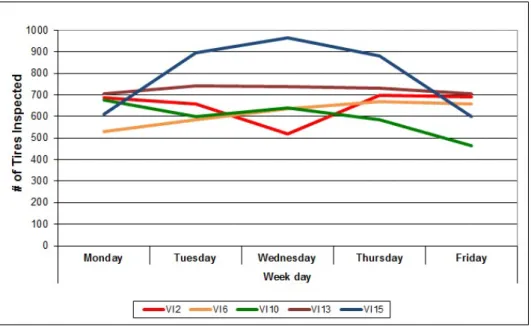
1.14 Number of inspected tires per shift along one week for some operators . . 17
1.15 Rejection ratio for each VI observed in a particular shift . . . 17
1.16 Research methodology followed in the project development . . . 21
2.1 ContiSeal Laser Marker handling solutions . . . 27
2.2 Bead Lubricant Applicant (Uniformity Machine) handling solution . . . . 27
2.3 Uniformity Machine Test Area handling solution . . . 28
2.4 InspectoMat handling solution . . . 29
2.5 ContiSeal Sealant Application handling solution . . . 29
2.6 ContiSeal Tire Washing Machine . . . 30
2.7 DOT read-out application handling solutions . . . 31
2.8 Trimming Machine handling solution (source: Matteuzzi [4]) . . . 32
2.9 Y.MTIS Family TBR solution from YXLON (source: YXLON [5]) . . . . 32
2.10 YXLON bead spread technology (source: YXLON [5]) . . . 33
2.11 VerTiX-PLUS solution from MicroPoise . . . 34
2.12 Tire Surface Inspection solution from Micro-Epsilon . . . 34
2.13 Tire bead inspection apparatus (source: [6]) . . . 36
2.14 Self contained unit for tire inspection and preparation (source: [7]) . . . . 37
2.15 Apparatus for tire inspection (source: [8]) . . . 37 xv
xvi LIST OF FIGURES
2.16 Tire inspection system based on X-ray technology (source: [9]) . . . 38
2.17 Inspection apparatus for tires (source: [10]) . . . 39
2.18 Defect marker apparatus (source: [11]) . . . 39
2.19 Apparatus used to apply the coating material inside the tire surface (source: [12]) . . . 40
2.20 Tire spreading and inspecting machine (source: [13]) . . . 41
2.21 Tire spreader and inspection apparatus (source: [14]) . . . 42
2.22 Tire shape inspection device (source: [15]) . . . 43
2.23 Tire testing apparatus (source: [16]) . . . 44
2.24 Tire appearance inspection apparatus (source: [17]) . . . 44
2.25 Apparatus with mechanisms for rotating and spreading a tire for inspec-tion (source: [18]) . . . 45
2.26 Tire inspection device (source: [19]) . . . 46
2.27 Tire interior inspecting system (source: [20]) . . . 47
2.28 Example of technology frontiers (source: Kirby and Mavris [21]) . . . 50
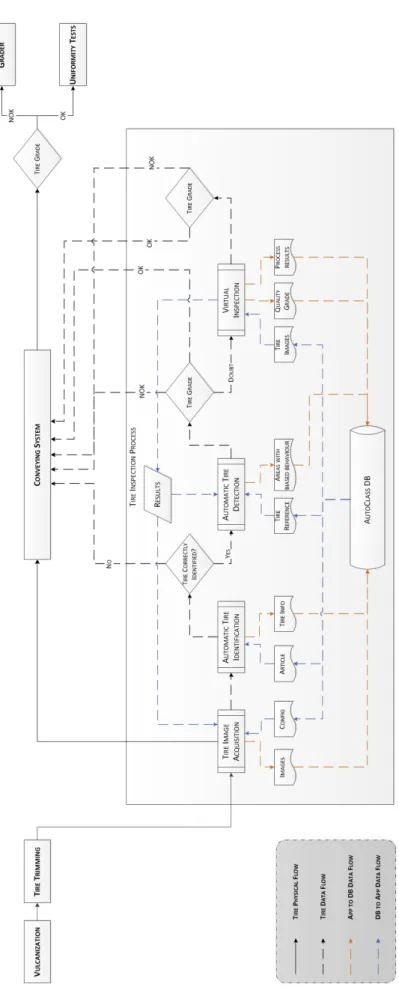
3.1 The new inspection process flow suggested for the Tire Inspection process 67 3.2 General system architecture for the tire inspection process . . . 69
3.3 Image acquisition station: overview of the structure used in the prototype 71 3.4 Image acquisition station: detail of the use of manipulator to place the equipment in the interior of the tire . . . 72
3.5 Flowchart of the acquisition control station application for the tire image acquisition station during the development phase . . . 74
3.6 Setup & Acquisition flow chart . . . 75
3.7 Handling configuration flow chart . . . 77
3.8 Tool available in the tire grabber applications to support the lighting setup 78 3.9 Lighting configuration flow chart . . . 78
3.10 Suggested flow chart for the industrial implementation of the tire image acquisition station . . . 79
3.11 Virtual Inspection station: overview of the prototype . . . 80
4.1 Technology Selection, Integration & Deployment Methodology . . . 86
4.2 Analytical Hierarchy Process (AHP) methodology: general approach . . . 87
4.3 X-ray test machine handling solution . . . 100
4.4 The shift to Channel Metal Oxide Semiconductor (CMOS) technology with impact on machine vision’s limits (source: I-Micronews [22]) . . . . 107
4.5 AVT Prosilica GC780 camera (source: AVT Prosilica [23]) . . . 108
4.6 IDS µEye camera (source: IDS [24]) . . . 109
4.7 Point Grey Flea3 USB3 camera (source: Point Grey [25]) . . . 109
4.8 Maximum frame rate versus image height for GC780 (source: AVT [23]) . 110 4.9 3D geometry types (source: SICK IVP [26]) . . . 111
4.10 3D coordinate system for reverse ordinary geometry (source: SICK IVP [26]) . . . 112
4.11 3D image output enhancing an imperfection in the sidewall . . . 113
LIST OF FIGURES xvii
4.13 LMI3D Gocator 2000 Family Laser Scanner solution (source: LMI
Tech-nologies[28]) . . . 114
4.14 Photonfocus MV1-D2048 camera (source: Photonfocus [29]) . . . 114
4.15 Bytewise 3D Laser Scanner solution (source: Bytewise [30]) . . . 115
4.16 Laser solution (source: Z-LASER [31]) . . . 115
4.17 FLIR A Family thermal infrared camera (source: FLIR [32]) . . . 120
4.18 Gobi 384 thermal infrared uncooled camera (source: Xenics [33]) . . . . 120
4.19 Example of images obtained with thermal infrared technology . . . 121
4.20 Thermal infrared camera business trends (source: I-Micronews [34]) . . . 122
4.21 3-axis configuration (elbow down): variables used for inverse kinematics . 124 4.22 3-axis configuration (elbow up): variables used for inverse kinematics . . 124
4.23 3-axis configuration: representation of the light incidence point in the object124 4.24 Tire handling solution used for the tire image acquisition station . . . 127
4.25 Tire handling solution: detailed views . . . 128
4.26 Tire handling solution: mechanisms . . . 128
4.27 2D image captured from tire sidewall (inside) . . . 131
4.28 2D image captured from tire sidewall (outside) . . . 131
4.29 2D image captured from tire tread . . . 132
4.30 2D image captured from tire interior . . . 132
4.31 3D image gathered from tire sidewall . . . 132
4.32 Acquisition time variation according to tire rim size (inches) . . . 134
4.33 Opportunities vs Threats Internal Factor weights influence . . . 146
4.34 IPC vs EIL probabilities’ influence . . . 147
4.35 ICR vs EIL probabilities’ influence . . . 148
5.1 Methodology followed for HMI development . . . 152
5.2 HMI design 1: tire image flowing on the screen . . . 157
5.3 HMI design 2: static view of the tire image split into layers . . . 158
5.4 HMI design 3: 3D view of all tire surfaces . . . 159
5.5 Inspection Time Distribution of 3 operators in the first phase of the exper-iments . . . 161
5.6 Room lighting effects on the screen . . . 163
5.7 Inadequate view angle and screen size not adapted to the workstation . . . 163
5.8 Virtual Inspection interface: first version . . . 164
5.9 Data structure used for experiment data gathering . . . 166
5.10 Inspection time influenced by tire surface viewed . . . 168
5.11 Inspection time influenced by the image length . . . 169
5.12 Inspection time distribution by tire grade . . . 169
5.13 Quality assessment results from one operator . . . 170
5.14 Virtual Inspection interface: enhanced version . . . 171
5.15 Virtual Inspection results comparison for the enhanced design version . . 171
5.16 Virtual Inspection interface: details of enhanced version . . . 173
5.17 Inspection time of the same tire images with different lengths . . . 173 5.18 Virtual Inspection: inspection time (per image) distribution for each session174 5.19 Physical Inspection: inspection time (per tire) distribution for each session 175
xviii LIST OF FIGURES
5.20 Inspection time evolution along the experience: operator’s experience in-fluence . . . 177 5.21 Inspection time evolution along the experience: operator’s experience
in-fluence . . . 177 5.22 Final workstation design: semi-sitting position . . . 178 5.23 Final workstation design: sitting position . . . 178 6.1 Automatic Tire Detection model: overview of the different elements . . . 181 6.2 Decision-Maker model and its different components . . . 182 6.3 Virtual Inspection model: overview of the different elements . . . 184 6.4 Virtual Inspection model: detailed view and interdependencies . . . 186
List of Tables
1.1 Groups of non-conformities (NCs) according to the area . . . 7
1.2 Repeatability study results for a group of VIs . . . 14
4.1 Pairwise comparison intensity values and correspondent meaning . . . 89
4.2 Random Index (RI) values from [35] . . . 90
4.3 Quantitative values to evaluate technical solutions . . . 90
4.4 Probabilistic expressions and perceived probability estimates [36] . . . . 93
4.5 Algebraic model variables used for evaluating potential strategies . . . 94
4.6 Algebraic model variables and the respective meaning . . . 95
4.7 Range of tire dimensions currently manufactured in the plant . . . 99
4.8 Handling solutions grouped according to tire position and tire/equipment relation . . . 102
4.9 Qualitative analysis of handling solutions . . . 103
4.10 Qualitative scoring of handling solutions . . . 104
4.11 Pairwise comparison of the handling solution criteria . . . 105
4.12 Criterion relative weight for handling solutions . . . 105
4.13 Handling solutions’ ranking . . . 106
4.14 2D vision solutions: main features (sources: [23], [24], and [25]) . . . 109
4.15 3D vision solutions: main features (sources: [27], [28], [29], and [30]) . . 115
4.16 Quantitative analysis of the different 3D solution tested . . . 117
4.17 Pairwise comparison of the 3D solution criteria . . . 117
4.18 Criterion relative weight for 3D solutions . . . 118
4.19 3D solutions’ ranking . . . 118
4.20 Thermal infrared camera solutions features (sources: [32] and [33]) . . . 120
4.21 Vision technology selection for the tire image acquisition station . . . 123
4.22 Tire Image Acquisition Station: technologies used and unit cost . . . 129
4.23 Power consumption per unit for technology used in the tire image acqui-sition station . . . 130
4.24 Range of tire dimensions acquired in the tire image acquisition station . . 135
4.25 Opportunities and Threats relative importance for internal and contextual environments . . . 136
4.26 Opportunity factors pairwise comparison for the internal environment . . 138
4.27 Opportunity factors relative weight for the internal environment . . . 138
4.28 Threat factors pairwise comparison for the internal environment . . . 139
4.29 Threat factors relative weight for the internal environment . . . 139 4.30 Opportunity factors pairwise comparison for the contextual environment . 141
xx LIST OF TABLES
4.31 Opportunity factors relative weight for the contextual environment . . . . 141 4.32 Threat factors pairwise comparison for the contextual environment . . . . 142 4.33 Threat factors relative weight for the contextual environment . . . 142 4.34 Comparison of the strategic alternatives (Opportunities) . . . 143 4.35 Comparison of the strategic alternatives (Threats) . . . 144 4.36 Algebraic model output results . . . 144 5.1 Results of the operator’s decisions along the first phase of the experiments 161
List of Terms
AHP Analytical Hierarchy Process.
AMT Advanced Manufacturing Technologies. AVT Allied Vision Technologies.
BDE Basic Decision Equations. CCD Charge-Coupled Device. CI Consistency Index.
CMOS Channel Metal Oxide Semiconductor. CPB Combined Panning Buttons.
CR Consistency Ratio.
CVT Commercial Vehicle Tires. DB Database.
DEA Data Envelopment Analysis.
DEA-AR Data Envelopment Analysis - Assurance Region. DMU Decision-Making Units.
DoE Design of Experiments.
DOT Department Of Transportation. DPB Distributed Panning Buttons.
ENCC Enhanced Navigator with Continuous Control. EVA-MIX EVAluation of MIXed criteria.
FOV Field Of View. fps frames per second.
xxii List of Terms
G&D Grab & Drag. GigE Gigabit Ethernet. GP Goal Programming. HD High Definition.
HMI Human-Machine Interface. IDS Imaging Development Systems. IP Intellectual Property.
IPC Industrial PC (Personal Computer). LED Light Emitting Diode.
MADM Multi-Attribute Decision-Making. MAUT Multiple Attribute Utility Theory. MAVT Multiple Attribute Value Theory. MCDM Multi-Criteria Decision-Making. MU Uniformity Machine.
NC Non-Conformity. NCs non-conformities.
NDA Non-Disclosure Agreement. NPV Net Present Value.
OCR Optical Character Recognition. OE Original Equipment.
OEM Original Equipment Manufacturer. PCA Patent Co-citation Approach. PVT Passenger & Light Trucks. QFD Quality Function Deployment. RI Random Index.
List of Terms xxiii
SDK Software Developer’s Kit.
SMART Simple Multiple-Attribute Rating Technique. TCP/IP Transmission Control Protocol / Internet Protocol. TCT Time Compression Technologies.
TOPSIS Technique for Order Preference by Similarity to Ideal Solution. USB Universal Serial Bus.
UTA Utility Theory Additive. VI Visual Inspector.
Chapter 1
Introduction
In such competitive business world, any company is seeking for competitive advantages that allow them to be sustainable along the time. This competitiveness might be achieved by four distinct ways: overall cost leadership, overall differentiation, focus-segment cost leadership, or focus-segment differentiation [37]. In addition to the competitive advan-tage every company is following, organizations are always concerned about the customers perception with respect to the quality of products or services they provide. Quality is something inherent to any product or service from the customer’s perspective [38]. Along the time, companies have been investing a lot of time and resources in enhancing the quality of the processes, products and services. Although the quality assurance does not add value to the final product or service, it is something that must be part of it. Dif-ferent strategies have been followed: some of them with a focus on the product (product quality) and some others with focus on the process (process quality). There are also cases that combine the two approaches in order to get a superior quality. Sousa and Voss [39] mention five alternative approaches:
• transcendent: looking for excellence
• product-based: amount of desirable attribute • user-based: fitness for use
• manufacturing-based: conformance to specification • value-based: satisfaction relative to price
Nevertheless, one of the main concerns about quality assurance is related to cost [40]. The goal is to have a quality assurance process as much effective as possible and with the lowest possible cost.
2 Introduction
With this motto in mind, Continental Mabor and MIT-Portugal Program came up with the AutoClass project. AutoClass stands for Automatic Classification and Quality Control for Car Tires. It is an industrial based project agreed between Continental Mabor In-dústrias de Pneus, a Portuguese affiliated company of the multinational Continental AG Corporation, and MIT-Portugal Program, by the Engineering Design and Advanced Man-ufacturing focus area. The project intends to develop an automatic quality control system for the car tires final inspection process with the aim of reducing the actual process costs by 50%. The project has the target to develop an industrial prototype to be installed at the plant that can demonstrate the possibility to achieve the project goals.
Many different technologies were studied and tested along the project. A structured ap-proach to the selection and assessment of the different technologies is essential to identify the most suitable options for the inspection solution. Since the current process is mainly a human-based process, workers but also all people involved in the process (managers, engineers, maintenance, quality, human resources, etc.) must be involved in the project development and definition. Their experience and knowledge are used as an input for the project development. In addition, an automatic system does not mean a simple non-human system. Process flexibility is inherent to human-based processes. A human-machine sys-tem is a more sophisticated syssys-tem, but also a more flexible, reliable and effective solution. Technology should support workers to improve their job conditions. People should train the system to improve and to acquire new information. This also reveals another impor-tant outcome that should be expected in this project: an iterative system that consimpor-tantly evolves with time. New tire types are always coming (different sizes, tread width, speci-fications, etc.) and the system must be able to adapt to new realities in order to keep the system flexibility and robustness through the time. The system shall create the necessary conditions to monitor and to allow acting online in the manufacturing process.
1.1
Motivation
The actual quality control process of inspection is performed by very knowledgeable, very specialized and well-trained operators. The decision of the tire classification (OK or NOK) is completely based on the human capability of analyzing correctly the tire quality taking into account all the requirements specified by the customers. The task performed by the operators is a multi-source process once they combine the information from differ-ent senses (like vision, touch, smell, etc.) in order to make a decision about the quality of the tire they are inspecting. In addition, the use of cognitive skills (memory, ability to associate a specific tire to a specific kind of imperfection, perception, awareness, etc.)
1.2 Company description 3
to enhance their capability of classifying a tire addresses the difficulty to translate these aspects into a system with a certain level of automation. Acquiring and transferring all these skills, knowledge and capabilities of humans into an automatic system means a sig-nificant degree of complexity and leads to an immense technical challenge.
This existing gap between the actual human-based quality inspection process and a full automatic system might be easily observed by the fact that until now, no one (company, research institute or organization) has been able to develop such a system, although sev-eral attempts and significant investments have been done to accomplish that.
Big challenges create high motivations. The problem one faces in this project represents a big challenge and has very high risks but also a great opportunity to create something innovative with significant impact in the industrial environment, and that can be general-ized to other realities rather than the tire manufacturing process.
The project also contains several fields of expertise of research, from the technology se-lection and assessment to the design and definition of interfaces with operators.
1.2
Company description
Continental AG, internally often called Conti for short, is a worldwide leading German manufacturer of tires, brake systems, vehicle stability control systems, engine injection systems, tachographs and other parts for the automotive and transport industries. The company is based in Hanover, Lower Saxony, Germany. It is the world’s 4th largest tire manufacturer after Bridgestone, Michelin and Goodyear [41], according to the revenue data from 2009. At the Original Equipment Manufacturer (OEM) supplier’s level, Con-tinental AG is the European leader and takes the 4th place in the worldwide market [42]. Continental AG had sales volume of almost 32 billion euros in 2012 which represented a sales increase of about 7.3% with respect to 2011. The company employs almost 170 000 workers in all facilities [43].
It was founded in 1871 as a rubber manufacturer, Continental-Caoutchouc und Gutta-Percha Compagnie. After acquiring Siemens VDO, it has become one of the top 5 auto-motive suppliers in the world [1].
Continental AG is organized in two main groups: the rubber group and the automotive group. The rubber group roughly represents 40% of the sales and comprises the following divisions:
• Passenger & Light Trucks (PVT) • Commercial Vehicle Tires (CVT)
4 Introduction
• ContiTech
The following divisions constitute the automotive group ( 60% of sales): • Chassis & Safety
• Powertrain • Interior
Continental AG is located in 13 different countries worldwide, consisting of 23 produc-tion plants, with facilities located worldwide (Figure 1.1).
One of Continental’s main areas of expertise and technical leadership is Fuel
Consump-Figure 1.1: Continental AG global locations (source: Wikipedia [1])
tion Reduction, achieved through more efficient fuel injection systems, reduced rolling resistance tires and hybrid propulsion systems.
Continental sells tires for automobiles, motorcycles, and bicycles worldwide under the Continental brand. It also produces and commercializes other brands on a regional level, such as General, Euzkadi, or Barum. Continental’s customers include all major auto-mobile, truck and bus producers, such as Volkswagen, Daimler AG, Ford, Volvo, Iveco, Schmitz, Koegel, Freightliner Trucks, BMW, General Motors, Toyota, Honda, Renault and Porsche [44].
In 2001, Continental acquired a controlling interest in Temic, Daimler Chrysler’s auto-motive electronics business, which is now part of Continental Autoauto-motive Systems. The company also purchased German automotive rubber and plastics company Phoenix AG in 2004 and the automotive electronics unit of Motorola in 2006. In 2007, Continental ac-quired Siemens VDO from Siemens AG. In August 2008 Continental agreed to be taken over by the family-owned auto parts manufacturer Schaeffler Group and a consortium of banks in a deal valuing the company at AC12 billion. Schaeffler has however pledged to
1.3 Tire Manufacturing Process Overview 5
restrict its stake in the company to less than 50% for at least four years. Dr. Karl-Thomas Neumann has succeeded Manfred Wennemer as chief executive officer of Continental on September 1st, 2008 [45].
Continental Mabor Indústria de Pneus, S.A. is a Continental AG affiliate. The Portuguese plant produces PVT tires for the Original Equipment (OE) and replacement markets. Be-sides the Continental brand, it is also responsible for the production of brands such as Mabor, Semperit, Gislaved, etc.
Continental AG set up together with the Portuguese company Mabor in 1989/90 a joint venture for the production of tires in Lousado. In 1993, the company sees a complete takeover of the tire activities and of a factory producing textile cord [46]. Currently, Lou-sado plant is responsible for a daily production of about 50 000 tires. It employs more than 1600 workers from diversified areas (engineering, production, human resources, ac-counting, etc.) and the company had, in 2010, a turnover ofAC487.94 million.
1.3
Tire Manufacturing Process Overview
The tire manufacturing process comprises six main process steps: mixing, preparation cold, preparation hot, tire building, curing and final finishing. The final finishing process is the place in the manufacturing process where tire quality visual inspection takes place. It also includes the uniformity tests process before the tires are sent to the warehouse where the paletization process occurs. A simplified block diagram of the tire manufactur-ing process is presented in Figure 1.2 where the process dependencies are also shown.
The tire manufacturing process at the Portuguese plant follows exactly the same
ap-Figure 1.2: General tire manufacturing process from the raw materials supplier until the final customer
6 Introduction
including the material and machinery suppliers as well as the end costumers OEM and af-termarket customers (replacement market). Under such a complex manufacturing process and supply chain, a production control system is implemented in the plant.
1.3.1
Process Data Overview
Tire industry uses specific terminology for the tire structures and for the information that is printed in the tire surfaces. Figure 1.3 shows a tire profile with the representation and meaning of the different tire parts. It is important to refer that some terms have more than one word to identify the tire surface. For instance, shoulder is also known (and it will be used as that along this document) by buttress. Inner liner will be used along this document with the term interior.
Another important aspect to be taken into account is the tire labeling. It is a mandatory
Figure 1.3: The structure of a tire and part names (source: Hankook [2])
information that is printed in the tire sidewall to provide the necessary data to the end-user. In particular, the tire dimensions (Figure 1.4) and the Department Of Transportation (DOT) information which gives the manufacturing origin of the tire as well as an identifi-cation code about the tire features.
The AutoClass project is focused on the quality inspection of tires at the end of the man-ufacturing process. The type of non-conformities (NCs) can vary significantly according to the tire surface location, type of imperfection (visual or structural imperfection), or process-related issues. The percentage of tires with NCs depends on the production mix and process performance but, in general, it represents 10% of the total production. 1% - 2% of the total production are going to scrap due to very critical NCs that cannot be
1.3 Tire Manufacturing Process Overview 7
Figure 1.4: Meaning of the different tire dimensions placed in the tire sidewall (source: Engine Basics[3])
recovered.
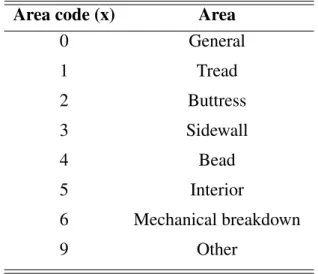
In total, 76 different NC codes can be identified in the final finishing process with fre-quencies of occurrence that vary significantly according to the production mix but with a distribution similar to the one presented in Figure 1.5. NC codes are organized by groups of NCs with a generic format xz, where x represents the tire surface (see Table 1.1), and zis a sequential number that identifies a specific imperfection within a certain group of NCs [47].
Generally, a tire will be classified as NOK when an imperfection is detected and the
Table 1.1: Groups of NCs according to the area
Area code (x) Area
0 General 1 Tread 2 Buttress 3 Sidewall 4 Bead 5 Interior 6 Mechanical breakdown 9 Other
tire is classified as OK when it does not contain any imperfection that can affect the tire performance or is “visible”.
8 Introduction
Figure 1.5: Pareto of the NC occurrence
1.3.2
Final Finishing Process Description
The final finishing process is the ultimate process before the tire is sent to the customers. It is responsible for the quality assurance of the tires previously produced (visual inspec-tion) and for the tire performance analysis (uniformity tests). Although the inspection process does not add value to the product, it is of the most importance since it reflects the company’s image to the customer.
Whenever a tire arrives to the final finishing process, a set of VIs perform the tire quality inspection and take a decision about the quality grade. When the tire is assessed as OK, the VI puts the tire on the conveyor to be transported to the uniformity tests process.. However, when the operator identifies a potential flaw in the tire, he suspends the state of the tire in the production control system and he sends the tire to the grading station (Figure 1.6).
The grading station is the place where the graders assign the NC code to the tire whenever
1.3 Tire Manufacturing Process Overview 9
the tire is NOK. They are also the only ones that can scrap a tire, i.e. tires with imperfec-tions that might compromise the tire performance. When the tire has an imperfection that can be recovered, the grader sends the tire to the rework process. After a tire is reworked, the grader performs an additional inspection to check the quality grade of the tire (Figure 1.6).
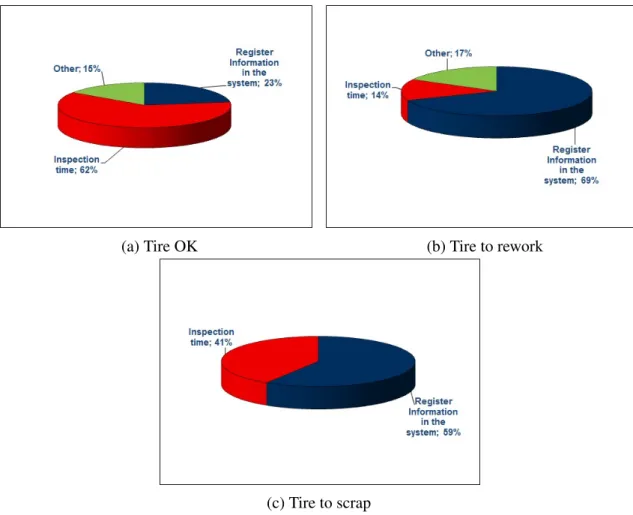
The grader roles include the tire inspection and the registration of the tire information in the system (barcode, tire mold number, and NC code). The task distribution with respect to the process time depends on the tire quality grade and the decisions that are taken by the grader (Figure 1.7). In Figure 1.7, Other refers to the tire handling (clean-up the marks drawn by the VI, some tire trimming, etc.).
One can notice the weight of the tire information registration in the system. The
intro-(a) Tire OK (b) Tire to rework
(c) Tire to scrap
Figure 1.7: Grader’s task timings acccording to tire quality grade decision
duction of the data is done manually and the system does not have a quick response. The immediate impact is the low level of data inserted in the system (Figure 1.8). Not all tires with imperfections which are not going to scrap have the correspondent NC code inserted in the system. This has a very negative impact on the process tracking but the system
10 Introduction
restrictions will also interfere in the grader’s performance.
There is another process step called OverInspector. The overinspector is a qualified
per-Figure 1.8: Information insertion into the system according to production volume
son from the Quality department that randomly selects the tires classified as OK by the VI in order to perform the quality evaluation of each VI. Roughly 10 tires are daily selected from each VI and the results of the overinspector process reflects in the bonus policy of the VIs.
Tire uniformity process is done in an automatic way. The Uniformity Machine (MU) re-alizes the uniformity tests using a specific recipe for each article and based on the results, the machine paints the quality marks on the tire sidewall. These quality marks are very important to the end costumers, since they use these data to select the most suitable tires for car assembly.
1.3.2.1 Visual Inspection Task Description
Tire visual inspection is a 100% human-based process done by very experienced and well-trained operators. The visual inspection process comprises three main tasks: tire quality inspection which is the main and the most important task, tire trimming (flash and air vents removal) and tire identification. To be able to realize all these tasks, the operators have also to handle the tire. All tasks take an average cycle time of 30 seconds for a machine cycle of 12 seconds. The full visual inspection flow is shown in Figure 1.9. Regarding the tire quality inspection, operators make use of the different senses such as vision, smell, and tact to analyze and take a decision concerning the quality conformance of the tire, taking into account the quality standards in place over Continental AG. The tire conformance includes visual aspects (e.g. blemishes) as well as tire performance and safety aspects (e.g. blisters).
1.3 Tire Manufacturing Process Overview 11
The tire identification task done by the operators considers the information taken by the
Figure 1.9: Visual Inspection process flow
barcode read-out. There is a barcode scanner at each station that outputs the green tire code. With the green tire code, one or more possible cured tires (depending on the type of market: OE or replacement market) are listed on the screen. Then, the operator selects the correspondent article to the tire in front which is assigned to the barcode. From this point on, by reading the barcode, one can access to the article information. This information is crucial for the conveyor system to decide which path each tire shall follow.
The inspection station does not allow an uniform inspection of all tire surfaces. For that reason, VIs make use of a mirror to inspect the tread surface.
Although the tire trimming task is represented as an independent task, sometimes VIs perform this task in parallel with the visual inspection. The exact determination of the time associated to each task is then complex. Nevertheless, an idea of the task time distribution is provided in Figure 1.10 where one can observe that more than 50% of the time is spent in the trimming, and only1/3of the time is dedicated to the tire inspection.
Otherrefers to the tasks of tire identification and tire handling.
The task time distribution is also dependent on the individual that performs the inspection and it also varies along the time with external factors. In a specific shift, the inspection
12 Introduction
Figure 1.10: Time distribution over the different tasks performed by the VI
time variability among the different VIs can vary significantly as it is shown in Figure 1.11.
Figure 1.11: Inspection time variability among the different VIs of a shift
1.4
Problem Statement
The current inspection process is a full human-based process. At the Portuguese plant, this process is handled in 24 workplaces by very specialized, experienced, and well-trained workers in 8-hour shifts, 24 hours a day, 7 days a week, within 5 teams. The daily pro-duction in the Portuguese plant is about 50 000 tires, and the inspection is performed in 100% of the tires.
1.4 Problem Statement 13
A safety product like a car tire requires a reliable and trustable process as the one in place. Flexibility is needed because of the product mix, but due to cost effectiveness the com-pany would like to introduce an automatic system in the final inspection process, keeping the actual levels of quality. The types of flaws are diversified, either by the location (inter-nal or exter(inter-nal side) or by the type of imperfection: excess of material, lack of material, foreign material, some kind of deformation, etc.
The final inspection process includes a visual but also manual handling of the tire which means a significant degree of complexity. The use of different sources of information requires specialized and very knowledgeable actors to guarantee a high level of perfor-mance and quality assurance.
The problem described here seems to be a purely technical issue. However, a complex and critical system such as the final inspection process requires a more broadly approach considering also economical aspects of the different possible solutions and also the social impact of the developed system. One shall be able to identify the critical aspects of the as-is process and compare with the developed solution. Aspects like the average number of tires inspected per shift or how many kilograms an operator carries per day and its implications in his health shall be taken into account. Additionally, if one looks to the tire quality control as a decision-making process, humans play the central role in the system development and implementation. Technology shall be seen as a support tool for the op-erators task in order to enhance the overall process performance.
In fact, although the problem, in the initial phase, was seen as a technical challenge, the research done allowed to change the approach to the problem without compromising the ultimate goal: enhance the quality inspection system in the tire manufacturing environ-ment by means of cost reduction. Technology is seen as a compleenviron-mentary tool to the humans.
1.4.1
Need of Process Automation
From the observations done in the final finishing process as well as the data analysis performed, one could identify some areas of improvement in the visual inspection process. The main outcome about the aspects to be reconsidered in the future solution for the visual inspection process are:
• Detection is a subjective process once one observe different decisions among VIs (Table 1.2)
14 Introduction
• The current workstation does not allow an uniform observation of all the tire sur-faces (Figure 1.13)
• Most of the time in the visual inspection is dedicated to the tire trimming and tire handling (Figure 1.10)
• The performance of the VIs varies significantly along the time regarding quality (Figure 1.15) and productivity (Figure 1.14)
The subjectivity associated to the tire quality assessment might be observed in the results obtained from the repeatability study frequently performed by the quality department to understand how “calibrated” VIs are. The study is composed by a set of tires with differ-ent grades that will be assessed by three operators at three differdiffer-ent attempts. The results of the quality assessment are then gathered and compared with the expected result. Table 1.2 shows the results obtained for the different attempts for one tire NOK (NC: blemish at bead). The results clearly show that the three VIs have different decisions along the attempts. VI 2 always assess the tire as OK when in fact the tire is NOK. The only time the three operators are coincident in the decision (attempt 3), they all fail the quality as-sessment.
The results gathered from the repeatability study show that the decisions among the op-Table 1.2: Repeatability study results for a group of VIs
VI’s Assessment
Attempt VI 1 VI 2 VI 3
1 OK OK NOK
2 NOK OK NOK
3 OK OK OK
erators are quite different. One of the reasons for that result might be in the definition of what is an imperfection and what is not. Figure 1.12 gives an example of two different tires with the same kind of flaw: blemish in tread. Although one could imagine that both tires shall be classified as NOK, in fact they are not. The reason for that classification is the customer requirements that are different from customer of the tire of Figure 1.12a and from customer of the tire of Figure 1.12b. The level of acceptance from the different customers introduce some ambiguity in the decisions operators have to perform.
Another aspect that requires improvement is the one related to the process deviations. Although the company defines a clear procedure for the visual inspection process [48], in
1.4 Problem Statement 15
(a) Tire OK (b) Tire NOK
Figure 1.12: Tires with the same kind of imperfection assessed in different ways
fact one could observe deviations from the original procedure. In order to speed-up the inspection process, some operators do not follow entirely the full procedure. They also develop particular ways of inspecting the tires which they consider more effective and ef-ficient. However, this can lead to process mistakes and wrong decisions. Additionally, the VI has to assign a decision to the tire and then drive the tire to the correspondent conveyor. In fact, one observed some situations in which the tire decision and the conveyor in which the tire was placed did not match, i.e. there is no correspondence between detection and decision. In the worst case scenario, an operator can detect an imperfection in a tire, mark it, but then assigns the tire as OK and sends it to the uniformity tests. If the imperfection is purely visual, this might lead to a tire that is sent to the customer with an imperfection that is tagged.
The feedback collected from the interactions with the operators highlight their difficulty to inspect some tire surfaces. In fact, the current workstation does not allow an uniform observation of the tire, mainly the tread area. The results from the overinspector process also show that imperfections in the tread area represents 25% of the cases (Figure 1.13). The results also demonstrate that the bead area which is hidden by the operator’s hand is a critical area. Some of the imperfections in the bead surface are not detectable by haptics but rather by vision. The 28% of cases observed in the sidewall surface can be explained by the fact that the tire surface where imperfections are most common is the sidewall, i.e. that the probability to occur an imperfection in this tire surface is high which can lead to a higher probability of non-detection.
The time dedicated to the tire inspection is not so significant which is somehow con-tradictory to the inspection process aim. Indeed, only 29% of the time (Figure 1.10) is spent to perform the most important task of the inspection process. The introduction of
16 Introduction
Figure 1.13: Imperfections caught at the overinspector station by tire surface
automation in the process shall focus in this particular aspect: identify the tasks that do not represent a significant added-value to the inspection process, although they are neces-sary, and that do not represent significant needs of flexibility. Tire trimming, tire handling and tire identification are the three main tasks that are aligned with this line of thought. Tire trimming is out of the project scope, but the impact of this task in the overall cost per-formance of the process is significant and efforts shall be addressed to this process in the future. Tire handling will reduce dramatically the ergonomic issues currently observed, minimizing the physical efforts needed to inspect a tire. Tire identification shall promote a better product and process tracking and minimizing the identification mistakes currently occurring which represents 10% of the customer complaints in 2010 [49].
Finally, the variability observed in the VI’s performance is significant as one might ob-serve in Figure 1.14 and Figure 1.15. This is particularly critical once the inspection process is placed between two automatic systems: the curing process and the uniformity tests. The productivity measured by the number of tires inspected by a VI in a shift has impact in the buffer dimension. The variability observed cause significant disturbances in the process management. The peaks noticed in the shift breaks and shift changes are also very critical, and special attention shall be paid to this issue.
As mentioned before, the ratio of OK and NOK tires is about 9:1. Once the tires are randomly distributed through the operators, one shall expect similar levels of rejection among the VIs. However, the results show considerable differences among them (min: 5%; max: 15%) denoting different criteria, awareness and cautious when inspecting a tire (Figure 1.15). The introduction of automation shall also contribute to a more uniform assessment of the tire quality aiming to reduce the impact in the process performance (tires OK sent to the grading station) and to avoid customer complaints (tires NOK sent to customers).
1.4 Problem Statement 17
Figure 1.14: Number of inspected tires per shift along one week for some operators
Figure 1.15: Rejection ratio for each VI observed in a particular shift
1.4.2
Need of Virtual Inspection
Some features of the actual inspection process require to be improved not only with the aim of reducing the process costs but also to improve the process performance and min-imizing the negative impacts in the upstream processes. However, there are aspects of the current inspection process that shall be kept once they add value to the process. The deep knowledge of the VIs about the occurrence and detection of the NCs as well as their


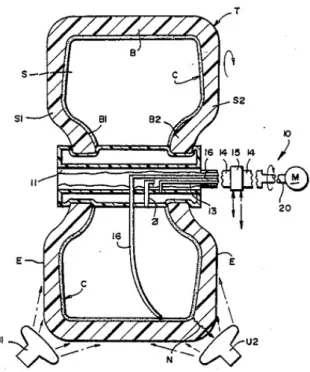
![Figure 2.25: Apparatus with mechanisms for rotating and spreading a tire for inspection (source: [18])](https://thumb-eu.123doks.com/thumbv2/123dok_br/18934018.938884/71.892.332.616.217.625/figure-apparatus-mechanisms-rotating-spreading-tire-inspection-source.webp)