LOSS AVERSION AND THE DISPOSITION EFFECT AROUND
THE WORLD
Menglin Guan
Dissertation submitted as partial requirement for the conferral of
Master in Finance
Supervisor:
Prof. Sofia Brito Ramos, ISCTE Business School, Department of Finance
LOSS AV ERS IO N A ND THE DI S P OSITI ON EF F ECT AROUN D TH E W ORLD
M
eng
li
n Gu
a
n
Abstract
In this article, we study how the performance of mutual fund affects investor’s behavior. I use mutual fund from around the world and analyse cross country differences on a sample of 45 countries. The study focuses on investigating the loss aversion, the disposition effect, and risk-aversion. Empirical results show that investors pay more attention on the fund which attracted larger fund flows previously, and loss aversion, disposition effect is significant among around half countries’ investors. Bigger funds are preferred by investors before financial crisis and this result changed after the crisis. The evidence is weak to conclude that whether the investors prefer older funds.
Key words: drawdown risk, loss aversion, disposition effect, flow-performance relationship
JEL classification code: G11, G23
Acknowledgements:
I acknowledge, with gratitude, my debt and many thanks to my supervisor, Professor Sofia Ramos for her great help, precious advice and guidance despite a busy schedule. This thesis would not be possible without Professor Sofia Ramos’ profound knowledge and patient encouragement.
It gives me great pleasure in acknowledging the long time support of my parents and thanks to my fiancée accompanied me in Europe during past year.
I am indebted to my colleagues for their support and motivation through the process. I express, sincerely, my grateful.
Resumo
Esta tese estuda como a performance passada dos fundos afecta os fluxos de investimento em fundos em vários países. É usada uma amostra internacional de fundos e são analisadas diferenças entre países em comportamentos tais como “ disposition effect”, aversão às perdas e aversão ao risco. São esperadas diferenças entre os vários países, países desenvolvidos e emergentes, europeus, asiáticos e americanos. Os resultados mostram evidencia de aversão ao risco, “disposition effect’ e aversão às perda na maioria dos países. Os resultados também mostram que os fluxos são autoregressivos e que os investidores preferiam fundos de grande dimensão antes da crise, mas os resultados mudaram depois da crise. A evidencia não é clara sobre se os investidores preferem fundos mais antigos ou mais recentes.
I CONTENTS 1. INTRODUCTION ... 3 2. LITERATURE REVIEW ... 4 3. DATA ... 8 3.1. DESCRIPTION OF SAMPLES ... 8
3.2. DESCRIPTIVE SUMMARY STATISTICS ... 9
3.3. VARIABLES ... 12
3.3.1. FUND FLOWS ... 12
3.3.2. DRAWDOWN... 13
3.3.3. RISK (STANDARD DEVIATION) ... 13
3.3.4. PAST RETURNS ... 13
3.3.5. FLOWS t-i ... 13
3.3.6. FUND SIZE (TNA) ... 13
3.3.7. AGE OF FUND ... 14 4. METHODOLOGY ... 14 4.1. REGRESSION EQUATION ... 14 4.2. HYPOTHESES ... 15 5. EMPIRICAL RESULTS ... 15 5.1. CORRELATION OF VARIABLES ... 15
5.2. REGRESSION APPROACH RESULTS ... 17
5.2.1. REGRESSION OF 1-MONTH FUND FLOW ON DRAWDOWN RISK ... 17
5.2.2. REGRESSION OF 3-MONTHS FUND FLOW ON DRAWDOWN RISK ... 20
5.2.3. REGRESSION OF 1-MONTH FUND FLOW ON STANDARD DEVIATION ... 23
5.2.4. REGRESSION OF 3-MONTHS FUND FLOW ON STANDARD DEVIATION ... 25
5.2.5. REGRESSION OF 1-MONTH FUND FLOW ON STANDARD DEVIATION BEFORE FINANCIAL CRISIS ... 27
5.2.6. REGRESSION OF 1-MONTH FUND FLOW ON STANDARD DEVIATION AFTER FINANCIAL CRISIS ... 29
II 5.2.7. REGRESSION OF 1-MONTH FUND FLOW ON DRAWDOWN RISK BEFORE FINANCIAL
CRISIS ... 30
5.2.8. REGRESSION OF 1-MONTH FUND FLOW ON DRAWDOWN RISK AFTER FINANCIAL CRISIS ... 32
5.2.9. REGRESSION OF 3-MONTHS FUND FLOW ON STANDARD DEVIATION BEFORE FINANCIAL CRISIS ... 34
5.2.10. REGRESSION OF 3-MONTHS FUND FLOW ON STANDARD DEVIATION AFTER FINANCIAL CRISIS ... 35
5.2.11. REGRESSION OF 3-MONTHS FUND FLOW ON DRAWDOWN RISK BEFORE FINANCIAL CRISIS ... 37
5.2.12. REGRESSION OF 3-MONTHS FUND FLOW ON DRAWDOWN RISK AFTER FINANCIAL CRISIS ... 38
6. CONCLUSION ... 39
7. BIBLIOGRAPHY ... 42
3
1.
Introduction
The disposition effect has been widely acknowledged in the literature of behavioral finance. Shefrin and Statman (1985) defined disposition effect as a phenomenon that investors sell winners too early and ride losers too long. It relates to the tendency of investors to sell shares whose price has increased, while keeping assets that have dropped in value. That is to say, when investors have unrealized investment gains, they are “risk averse” so they tend to sell their investments too early to lock in their investment gains.
There are numerous papers study disposition effect (Lee, Yen, Chan, 2013), the research related to flow performance relationship (Sirri and Tufano, 1998; Ferreira, Keswani, Miguel, Ramos, 2012), and research by Haigh and List (2005) relate to loss aversion.
Studies on investment behavior also have acknowledged less aversion. Loss aversion refers to people's tendency to strongly prefer avoiding losses to acquiring gains. Some studies suggest that losses are twice as powerful, psychologically, as gains. Loss aversion was first
demonstrated by Amos Tversky and Daniel Kahneman.( Kahneman, D. and Tversky, A. 1984. Choices, Values, and Frames. American Psychologist 39 (4): 341–350.). This leads to risk aversion when people evaluate an outcome comprising similar gains and losses, since people prefer avoiding losses to making gains.
Downside risk was introduced in the financial literature to measure financial risk associated with losses. That is, the risk of difference between the actual return and the expected return (when the actual return is less), or the uncertainty of that return.
Shefrin and Statman (1985) and Frazzini (2006) suggest that the disposition effect of investors is a result of the prospect theory and mental accounting (Lee, Yen, Chan, 2013), when investors have unrealized investment gains, they are risk-averse investors so they tend to sell investments so early that cannot lock in their investment gains.
Investors are less willing to recognize losses (which they would be forced to do if they sold assets which had fallen in value), but are more willing to recognize gains. This is irrational behavior, as the future performance of equity is unrelated to its purchase price. If anything, investors should be more likely to sell “losers” in order to exploit tax reductions on capital gains.
In this thesis, I study how the performance of mutual fund affects investors’ behavior, if they reveal disposition effect, the investors will tend to sell shares whose price has increased, while keeping assets that have dropped in value. Their purpose is locking returns, investors are less
4
willing to recognize losses, nevertheless are more willing to recognize gains. The disposition effect can be partially explained loss aversion. I use a sample of 45 countries from January 2002 to December 2013 and monthly frequency data. The investors’ behavior is measured by fund flows. I analyses how standard deviation, drawdown risk, past returns, affect fund flows. I use also several control variables such as fund size, fund age and previous fund flow. I found that loss aversion and disposition effect are significant among around half countries’ investors. The mutual funds which attracted fund flow previously, these funds will attract more cash inflows. Bigger funds are preferred by investors before financial crisis and this result changed after crisis. Weak evidence shows whether the investors prefer older funds or not.
The thesis has the following structure, section 2 is a review of the relevant literature. Section 3 describes the data. Section 4 explains the methodology. Section 5 presents and discusses the empirical results. The 6th and final section give the concluding remarks.
2. Literature review
There are numerous papers that study how investment flows depend on past performance using US mutual fund flow data. Most of them show that flows are highly dependent on past performance and investors chase winners more intensely than they sell poorly performing funds.
The article (Ferreira, Keswani, Miguel, Ramos, 2012) discusses how mutual fund flows depend on past performance across 28 countries and show there are marked differences in the flow-performance relationship across countries.
The article used biased-free data from Lipper Hindsight database on mutual fund sizes and returns, Lipper collect these data from fund management companies directly, in order to avoid double-counting funds.
The fund flow for fund i in country c at quarter t is the fraction with the denominator total net assets value at the end of quarter t and numerator which is the difference between total net assets value at the end of quarter t and product of net assets value at the end of quarter t-1 multiply 1+Ri,c,t, Ri,c,t is fund i’s raw return from country c in quarter t. Performance measurement is using raw returns and risk-adjusted returns in local currency, authors calculate four-factor alphas for domestic funds and the same way to calculate Jensn’s alpha, and use market, size, value and momentum factors instead of a single market factor. Besides, non-performance-related variables are also important in explaining flows and the sensitivity
5
to performance, dummy variable is introduced to capture the impact of geography, zero represents a domestic fund while one represents an international fund, control for the number of countries where a fund is registered to sell. The style of funds may affect the flows they receive, the author estimate the loading on SMB and HML factors in each fund quarter and include the loadings as additional control variables, and the average percentage flow across all funds in the prior quarter in each country is also included. Next this article expounds the flow-performance relationship and explaining this relationship across countries.
The authors show that there are substantial differences in flow-performance relationship across countries. Investors in more developed countries are generally more proactive that elsewhere. More sophisticated investors are and the lower participation costs they face, the less convex the flow-performance convexity.
The study by Barber, Odean, Zheng (2000) finds evidence of disposition effect, the authors state three main results, investors buy funds with strong past performance lead to more than half of fund purchases occur in top ranked funds; investors sell funds with strong past performance and are reluctant to sell their losing fund investments, thus nearly 40% of fund sales occurred in funds which ranked top quintile of past annual returns; investors also sensitive to the form in which fund expenses are charged, they are less likely to buy funds with high transaction expenses.
The authors of this study used mutual fund account data and returns data, and collected the primary fund data from a large discount brokerage firm on the investment of 78000
households from January 1991 through December 1996,42% of the sampled households reside in the western part of United States, 19% in the East, 24% in the South, and 15% in the Midwest, the dataset enables to separately analyse purchase and redemption decisions and discloses the exact timing and amount from TNA and fund returns. This research exclude from the current analyses investments in common stocks, American receipts, warrants and options. The frequency of mutual fund returns data is monthly, the data is from Center for Research in Security Prices mutual fund database, this part restrict analyses to bond funds, international equity funds and specialized sector funds.
The author calculated proportion of gains and losses realized based on these data with two ratios by formula:
PGR= (1)
6
It will helpful to discover investors are more willing to realize either gains or losses since a large difference in the proportion of PGR and PLR is figured out. Then to estimate monthly time-series regression and Fama-French model monthly time-series return in order to evaluate the performance of fund purchase portfolios. As the previous research, this article discussed flow-performance relations as well and found a strong tendency for purchases to follow strong past performance yields large net inflows to top-ranked funds.
Based on the empirical evidence, the past fund performance is useful in predicting future returns. Mutual fund investors use simple decision heuristics when selecting mutual funds, when purchasing funds, investors use a representativeness heuristic, where recent
performance is deemed overly representative of a fund manager’s true ability. When selling funds, the representativeness heuristic is more than offset by investor’s reluctance to realize losses which is called disposition effect.
The study by Andrade (2009) , on a mutual fund sample from CRSP US mutual fund
database, this paper contain quarterly and monthly data for all US open-end mutual funds that operated at any point between December 1969 and March 2007, author obtain the timing and source of fund performance from conditional and unconditional return equations, the equation of modified one-factor model splits the market’s upward and downward moves, thus it
provides a more flexible framework than Jensen’s α one factor model. The conditional measures of return-based are introduced to express the mutual fund’s excess return conditional on the sign of market’s return.
This study confirms that mutual fund investors use historic performance to pick funds that had low downside risk and good performance. The author used two approaches to figure out fund flows are decreasing on downside risk and increasing in performance which support investors chase funds with low downside risk.
Another research analyses disposition effect and market states based on the data from Taiwan mutual investors (Lee, Yen, Chan, 2013). The data in the study obtained from the Taiwan Securities Investment Trust and Consulting Association, the sample is from July 2001 to October 2008, the frequency of the data is monthly, there are 110 mutual funds totally with monthly returns and other necessary data such as redemption rate, market adjusted return, size, turnover rate, management expenses. The individual data from August 2000 to October 2008 is obtained as well in order to get robust results. Authors identified market states and used the basic model to examine the behavior of mutual fund investors’ redemption in the full, bull, bear and neutral market. Author also set three testable hypotheses, first one is mutual fund investors more actively redeem their mutual fund units when the mutual funds
7
have losses under a bear market than under a bull market; second, investors actively redeem both winner and loser mutual fund units under a neutral market; third, mutual fund investors are more (less) actively to redeem their funds have moderate gains under a bear (bull) market. The modified equation include various levels of mutual fund gains and losses and follow Lee et al (2010) to classify the mutual fund gains and losses in five different categories and account for the fixed effect from mutual fund by introduce dummy variables.
This study finds that Taiwan mutual fund investors also exhibit a disposition effect which is consistent with the results of Taiwan stock investors in Barber et al. (2007); investors redeem their mutual fund units more under a bear market than a bull market when they have extreme capital losses; When investors have moderate gains, they are less active in redeeming their mutual fund units under a bull market relative to a bear market; Under a neutral market, investors actively redeem mutual fund units in both winner and loser mutual funds except when they have extreme capital losses. So disposition effect isn’t uniform, it varies by market conditions.
It seems different market states affect investor psychology regarding future market trends and disposition effect varies across bull, bear and neutral markets. In a bull market, investors are relatively more reluctant to redeem mutual fund shares than in a bear market for a loser mutual fund.
The investors may be able to predict the next period’s mutual fund returns correctly, and there exists strong correlations between mutual fund returns and local market returns (Hens, 2013). The data on time preference and risk attitudes is from international test of risk attitudes and the survey carried out among more than 6000 economics students from 53 countries, this study provides data on time preferences, loss aversion, and uncertainty aversion. Mutual fund data is provided by Morningstar which consists of fund flows, total net asset values, returns of individual mutual funds and equity funds, the monthly frequency data is from the beginning of 1991 to the end of 2011 with each fund has domicile and region of sale information. The stock market data is from Thomson Reuters Datastream. This study test the hypotheses that differences in time and risk preferences can explain the cross-sectional differences in equity fund flows. Dr. Thorsten Hens performed regression on the fund flows and squared fund flows, capturing the volatility to test effects of patience and loss aversion; performed
regression for the fund flow return relationship for every country separately. The returns and flows mostly strong auto correlated, so heteroscedasticity adjusted New-West standard errors for t-statistics in the regressions is necessary. The result shows loss aversion and patience have significant effects on the flows, explaining the cross-country difference. Moreover,
8
investors actually evaluate returns with their utility functions and execute their trading decisions since the interactions between returns and flows with the substitution of interaction between loss aversion and returns. These conclusions became even stronger after 2007 financial crisis time.
There are quite a few studies (Shefrin and Statman, 1985; Frazzini, 2006) that validate the existence of the disposition effect. It’s meaningful in the USA, Europe and the Asia Pacific.
3. Data
3.1. Description of the samples
We study the disposition effect and loss aversion of mutual fund investors across several countries. The data in this article are drawn from Lipper database with monthly returns. The time period is from January 2002 to December 2013.
In order to get the representative results, the data of 7 countries which with the least number of funds are eliminated, the data from 38 countries in different continents are drawn from the Lipper database.
9 3.2. Descriptive summary statistics
10
Table1 shows the mean and gross value of funds by country, at the end of 2013. The country with greatest total TNA is USA which is 398000 billion.
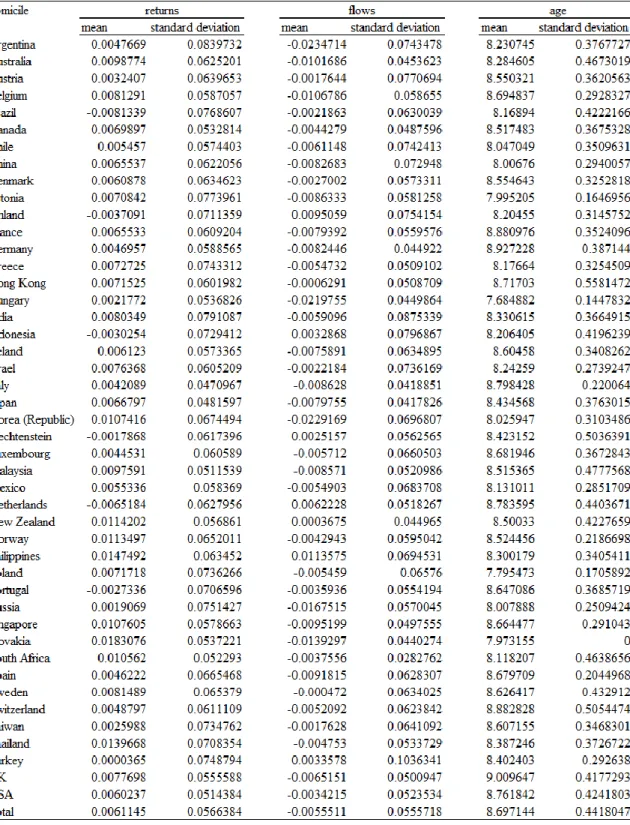
Table 2 represents the fund variables by country, each represents winsorized returns,
winsorized relative flows, and age of the fund, and two columns are mean, standard deviation in sequence.
12
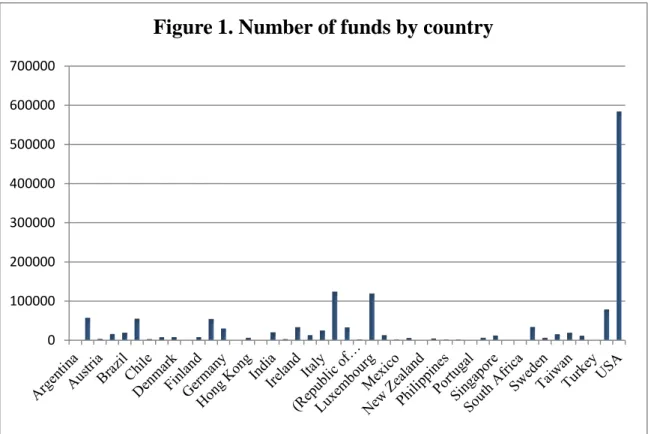
Table 3 presents summary the number of funds by country. As we would expect, the number of funds in developed countries is larger, in USA, there are 584,129 funds in USA which with 40.77% of total observations. There are totally 1432846 funds at the end of year. The funds size of emerging market is in the middle, such as China, Thailand and Hong Kong, Japan which is the top Asian country is with the second largest funds number. We can see the English-speaking countries and some developed European countries hold the highest number of observations.
3.3. Variables 3.3.1. Fund flows:
In this article, we define new money growth rate as the net growth in total net assets (TNA) based on Chevalier and Ellison (1997) and others. Fund flow for time period t is calculated as: Flow t =
(3) Assume the flows occur at the end of each quarter. The absolute fund flow is calculated as: Flow t = TNAt-TNAt-1 (4) To make sure the extreme values will not drive the results, we winsorize fund flows and returns by country at the bottom and top 1% level of distribution.
The future flow performance is measured by past performance, returns and others. Our purpose is to figure out how the past performance affects the future flows of funds.
0 100000 200000 300000 400000 500000 600000 700000
13 3.3.2. Drawdown
Drawdown measures the decline from a historical peak in some variable, it is the “pain” period experienced by an investor between a peak (new highs) and subsequent valley (a low point before moving higher). Maximum drawdown is the worst (the maximum) peak to valley loss since the investment’s inception. The maximum drawdown duration is the worst (the maximum/longest) amount of time an investment has seen between peaks.
Drawdown is performance-related variable which is introduced in order to study loss aversion, we predict the investors’ behavior react to drawdown cross countries is different.
3.3.3. Risk (Standard deviation)
Standard deviation is applied to the rate of return of an investment to measure the
investment's volatility. Standard deviation is also known as historical volatility and is used by investors as a gauge for the amount of expected volatility.
There are risk seeker and risk-averse investors, we introduce this independent variable in order to investigate the type of investors. Greater volatility sometimes leads to higher returns, nevertheless the benefits and risks are always together.
3.3.4. Past returns
The past returns or profit is the income of investor, also it is the object of investment. Raw returns are drawn from Lipper database. We introduce past return to study disposition effect, loss is more powerful than gain rationalize that investors reduce the cash inflow once they have returns on the fund.
3.3.5. Flows t-i
We introduce previous fund flows to investigate how this variable will affect future flows as it is close related to the future flows, it may create positive cycle of investing. We regress flows of future one month and three month, so i=1 or 3.
3.3.6. Fund size (TNA)
In our regression, the study controls for fund size by computing the natural logarithm of total net assets. Total net assets are the difference between assets and liabilities. Fund size is a very important control variable, although it is the non-performance-related variable, investors always take this into consideration when they make decisions. We expect larger fund is more prone to attracts cash flow.
14 3.3.7. Age of fund
Age of fund is also a control variable which may affect investors’ choice, as the funds exist for long time, it is well known the people and brand dominates some other factors in the judgment of investing. In the study, we set the last date of our observation as a value and the difference this value and value of launch date is the age of fund. In regression, we calculate age of fund by natural logarithm of age,
4. Methodology
This study aims to measure how investors’ behavior reacts to losses. Investor behavior is measured by fund flows. The fund performance is measured by several factors, we set future fund flows as the dependent variable, the monthly, seasonally, and future flows will be measured one by one. The independent variables include past returns, drawdown risk, gains and losses, extreme performances.
Besides these variables, it shows non-performance-related variables always effect the future flows, we think it’s necessary to introduce some control variables in order to explaining future flows and sensitivity to performance, we will figure out if the large fund capture larger
amount of money for example. We will use natural logarithm of TNA as one control variable. Some studies choose fund age to explain the flows, we use it here as well. As Gil-Bazo and Ruiz-Verdu (2009) and others show the fund fees will effect the flow, we include actual annual charge (aac), actual initial charge (aic) and arc as other control variables.
4.1. Regression equation:
We will use two equations the following linear regression specifications
Flowt = b1×Drawdown t-i +b2× Past Returns + b3×Flows t-i + b4×TNA + b5×Age + c (5) Flowt = b6×Risk + c (6) Flowt = a1×Risk t-i +a2× Past Returns + a3×Flows t-i + a4×TNA + a5×Age + c (7) The above flows are regressed by domicile and monthly, seasonally, semi-annually, annually flows are regressed separately.
Based on my study across different countries or regions, the piecewise linear regression is necessary. Piecewise regression is a method in regression analyses in which the independent variable is partitioned into intervals and a separate line segment is fit to each interval. This regression is useful when the independent variables, clustered into different groups, exhibit different relationships between the variables in these regions. As we all know the 2007
15
financial crisis, we will investigate the investors’ decisions favoring before and after crisis, if there exists some differences, so we will regress everything again before year 2007 and after year 2006.
4.2. Hypotheses:
For the coefficients of our regressions, we make some hypotheses:
Hypotheses 1: b1<0, because of loss aversion, usually when the funds resulted in loss,
investors would decrease the cash inflow to the funds in the future in order to avoid loss more. Hypotheses 2: b4>0, the funds that with large total net asset may attract more flows as they are more visible and well-known by investors, big fund also better in withstand outer
impingement.
Hypotheses 3: b6<0, because of risk aversion, greater volatility is the potential problem for investors.
We will compare the hypotheses with the empirical results.
5. Empirical results
5.1. Correlation of variables
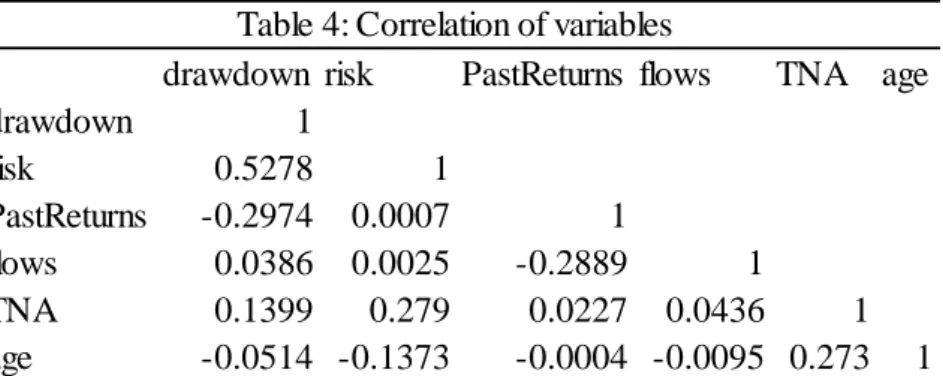
Table 4 present correlations for variables. From the results, we can see drawdown is positively correlated with risk or standard deviation, the drawdown increases, the more declines from peak to trough means rising risk of lose as we expected. As the correlation coefficient is 0.5278, these two variables are moderate correlated. When the absolute value of correlation coefficient is between 0.3 and 0.5, they are low correlated. Past returns and
drawdown are negatively low correlated, it is obviously that drawdown leads to the deductions of returns, but not that much based on our research of these countries. As past returns decreased, the fund will lose some amount of cash inflows than before, so past returns and flows are also negatively low correlated. There is evidence shows risk and total net assets
drawdown risk PastReturns flows TNA age
drawdown 1 risk 0.5278 1 PastReturns -0.2974 0.0007 1 flows 0.0386 0.0025 -0.2889 1 TNA 0.1399 0.279 0.0227 0.0436 1 age -0.0514 -0.1373 -0.0004 -0.0095 0.273 1
16
are positively low correlated with the coefficient which equals to 0.279. Generally speaking, the older fund will own more net assets, otherwise the fund will fade away, so TNA is positively low correlated with age of the fund. For the rest of the correlations between variables, we can conclude they are not correlated as the absolute value coefficients between them are close to zero or far less than 0.3.
As drawdown and risk are moderate correlated, in order to avoid multicollinearity, we will regress them separately.
17 5.2. Regression approach results
5.2.1. Regression of 1-month fund flow on drawdown risk
USA: Flowst = -0.015×drawdown – 0.314×past returns + 0.471×Flows t-1 + 0.001×TNA – 0.004×Age + c
drawdown_12m past returns Flows t-1 TNA Age Observations R-squared Adjusted R-squared
Argentina -0.014 0.192 0.323** -0.005 0.008 385 0.337 0.192 Australia 0.009 -0.106* 0.094*** 0.002*** -0.006*** 5,584 0.071 0.057 Austria -0.029 0.228*** 0.072 0.005*** -0.005 2,212 0.106 0.064 Belgium 0.005 -0.337*** 0.269*** 0.001 -0.001 13,786 0.221 0.214 Brazil -0.009** 0.045*** 0.171*** 0.001** -0.007*** 16,896 0.054 0.046 Canada 0.005 -0.228*** 0.250*** 0.001*** -0.002 48,017 0.161 0.158 Chile -0.088** 0.005 0.132 -0.001 0.004 899 0.245 0.187 China 0.034*** 0.274*** -0.072*** 0.003*** 0.009*** 7,307 0.427 0.419 Denmark 0.011 0.196*** 0.166*** 0.004*** -0.009*** 3,914 0.171 0.142 Estonia 0.234** 0.28 0.021 0.002 -0.026 127 0.62 0.202 Finland -0.029** 0.125*** 0.175*** 0.003* -0.016** 2,651 0.18 0.139 France 0.001 -0.254*** 0.357*** 0 -0.002* 45,489 0.24 0.238 Germany 0.001 -0.205*** 0.376*** 0 0.002* 27,169 0.243 0.24 Greece -0.019 0.211* 0.283 0 -0.015 211 0.629 0.293 Hong Kong -0.008 -0.152** 0.368*** 0.002** -0.002 4,522 0.209 0.189 Hungary -0.07 -0.202 0.265* 0.005 -0.031 250 0.235 0.061 India 0.012 0.492*** 0.107*** 0 -0.002 13,702 0.639 0.636 Indonesia -0.072*** 0.284 0.194*** 0.003** -0.005 2,184 0.263 0.228 Ireland -0.015*** -0.239*** 0.307*** 0.002*** -0.004** 28,489 0.176 0.172 Israel -0.066** 0.083 0.356*** 0.002 -0.005 932 0.268 0.218 Italy -0.003 -0.245*** 0.388*** 0 0.001 23,782 0.304 0.301 Japan -0.009*** 0.024*** 0.381*** -0.000** 0.001* 52,698 0.204 0.202 Korea -0.017** 0.03 0.277*** 0.001*** -0.007** 19,685 0.183 0.178 Liechtenstein -0.018 -0.149** 0.262*** 0.001 0.016** 1,581 0.205 0.147 Luxembourg -0.001 -0.227*** 0.272*** 0.001*** -0.002* 100,964 0.133 0.131 Malaysia 0.006 -0.046 0.115*** 0.003*** 0 12,305 0.106 0.099 Mexico -0.233 -1.019** -0.016 0.001 -0.026 141 0.273 -0.13 Netherlands -0.009* -0.314*** 0.412*** 0.001 -0.004** 5,132 0.435 0.421 New Zealand 0.123*** 0.101 0.109 0.004* -0.009 692 0.254 0.051 Norway 0.01 0.083 0.163*** 0.004** -0.016 1,026 0.24 0.135 Philippines -0.072* -0.096 0.168*** 0.002 -0.001 920 0.163 0.092 Poland 0.004 -0.118 0.200*** -0.002 -0.03 380 0.151 0.013 Portugal -0.017 -0.073 0.04 0.003 0.003 553 0.398 0.178 Russia 0.012 -0.365*** 0.220*** 0.001 -0.014** 5,567 0.208 0.199 Singapore -0.003 -0.159*** 0.505*** 0.001 -0.002 11,702 0.343 0.335 Slovakia South Africa 0.016 -0.095 0.653*** 0.004 0.005 100 0.792 0.497 Spain -0.002 -0.236*** 0.385*** 0.001** -0.004 30,924 0.279 0.275 Sweden -0.017 0.258*** 0.102*** 0.001 0.001 2,684 0.19 0.15 Switzerland -0.003 -0.375*** 0.380*** -0.001 -0.005*** 11,946 0.337 0.332 Taiwan -0.008** -0.212*** 0.457*** 0 -0.001 15,956 0.344 0.34 Thailand 0.002 0.080** 0.196*** 0.004*** -0.003 10,938 0.138 0.13 Turkey -0.088** 0.059 0.06 0.006* -0.002 576 0.198 0.161 UK 0.004 -0.245*** 0.214*** 0.002*** -0.003*** 72,542 0.128 0.127 USA -0.015*** -0.314*** 0.471*** 0.001*** -0.004*** 583,943 0.415 0.415
18
Canada: Flowst = -0.005×drawdown -0.228× past returns + 0.250×Flows t-1 + 0.001×TNA – 0.002×Age + c
China: Flowst = 0.034×drawdown +0.274× past returns – 0.072×Flows t-1 + 0.003×TNA + 0.009×Age + c
Japan: Flowst = -0.009×drawdown +0.024× past returns +0.381 ×Flows t-1 – 0.000×TNA + 0.001×Age + c
UK: Flowst = 0.004×drawdown-0.245× past returns + 0.214×Flows t-1 + 0.002×TNA – 0.003×Age + c
Germany: Flowst = 0.001 ×drawdown -0.205× past returns + 0.376×Flows t-1 + 0×TNA + 0.002×Age + c
Table 5 analyses whether fund flows are sensible to drawdown, the regression result of fund flow for the future one month. From the result, it is obviously total net assets and fund flow of original month are positively correlated with the future fund flows, we cannot easily
summarize the relationship between drawdown and past returns, it depends on specific country or region. It’s always more difficult for funds which are old to attract fund flows, investors are more willing to select young fund as their investments. We include standard deviation in the dependent variables in order to find out the level of risk averse of investors, the USA which is the country with the largest observations, the investors in the country are less risk averse, more risk seekers are among US investors, high risk sometimes means high returns.
Let’s see the regression equation of some countries, we choose USA, Japan as the developed country, China which is the representative of emerging market. The Chinese investors are always positively with all variables except previous fund flows, there are more risk seekers in China, Chinese investors are more interested in the funds which with high risk, also they paid more attention to the larger age fund for insurance as they believe the funds which exist and attract flows for long time must be with some certain reasons, Japanese and German investors are the same at this point while most of the investors from others prefer young funds. For the past returns, more than half of the countries are not trend to invest more if they earn profit from that fund, Investors are less willing to recognize losses which they would be forced to do if they sold assets which had fallen in value, but are more willing to recognize gains. We call it “disposition effect”, it relates to the tendency of investors to sell shares whose price has increased, while keeping assets that have dropped in value. For example, US investors will not invest in the funds which the asset value increased, for the Asian countries, such as China, Japan and Korean, they are opposite, the Chinese and Japanese investors are risk seekers
19
when lose and risk averse when they gain. Besides USA and UK, some EU countries, such as Portugal, Spain, Luxembourg, Germany and France, their investing tendency are negatively correlated with past returns. It’s no doubt that the larger total net assets of funds, the easier to attract cash inflow, there doesn’t exist any country which prefer smaller total net assets, the coefficients of TNA which are negative almost statistically insignificant from zero, Japan is the only one with negative coefficient which is statistically different from zero, but it’s close to zero. We can get the certain conclusion based on results. Drawdown is the peak-to-trough decline during a specific record period of an investment, fund or commodity. A drawdown is usually quoted as the percentage between the peak and the trough, generally when it happens, the inflows will be affected a lot, we can see more than half of the investors among 45
countries would not increase cash inflow in the fund, USA, Singapore, Korea, Indonesia, and Ireland, etc, investors from these countries are negatively impact by drawdown. There also exists quite a few of 45 countries are not accept lose from drawdown willingly, close to 40% investors would insist on increasing inflow even they experienced “pain” period between a peak (new highs) and subsequent valley (a low point before moving higher). Chinese, Estonian, Indian, Dutch and New Zealander are positively correlated with drawdown. Based on the regression result for one month, we can see Chinese are more activist investors as their fund flows are all positively correlated with five factors out of six, the only one they don’t prefer is the fund flows of last month, Japanese investors are sensitive to past returns, previously cash flow and risk, drawdown and total net assets almost doesn’t affect their behavior or willingness. American and Canadian investors’ behavior are quite similar, they are risk averse and don’t like drawdown, the disposition effect are obviously for them and prefer larger age fund. For the European countries, there includes variety kinds of investors and investing behavior. Next we will see the same facts based on three months.
20 5.2.2. Regression of 3-months fund flow on drawdown risk
Tables 6 is the regression result of fund flow without risk as independent variable for the future three months, based on the results, we compare the coefficient of major countries with table 5, the conclusion here are with some significant similarities to the future one month fund flow. Overall, the major differences between table 5 and table 6 are the investors’ behavior to
drawdown_12m past returns Flows t-1 TNA Age Observations R-squared Adjusted R-squared
Argentina -0.009 0.141** 0.193* -0.011** 0.011 360 0.357 0.212 Australia 0.008 -0.04 0.122*** 0.001** -0.005** 5,033 0.091 0.077 Austria -0.008 0.07 -0.003 -0.003 -0.005 2,116 0.087 0.044 Belgium 0.006 -0.350*** 0.267*** -0.001 0.001 13,272 0.369 0.363 Brazil -0.016*** 0.025*** 0.136*** -0.001** -0.007*** 15,307 0.076 0.067 Canada 0.002 -0.217*** 0.287*** 0 0 46,079 0.293 0.291 Chile -0.068** 0.07 0.065** -0.003** 0.006 816 0.37 0.319 China -0.022*** 0.185*** 0.029*** -0.001 0.007*** 6,650 0.319 0.309 Denmark 0.009 0.115*** 0.104*** 0 -0.009** 3,762 0.159 0.129 Estonia 0.176* 0.20 -0.105 -0.013 0.065 117 0.673 0.284 Finland 0.003 0.05 0.022 -0.006*** -0.013 2,490 0.135 0.09 France 0.006** -0.275*** 0.298*** -0.001*** -0.001 43,870 0.331 0.328 Germany 0.006* -0.237*** 0.305*** 0 0.003** 26,263 0.321 0.318 Greece -0.063** 0.08 0.081 0.001 -0.021 180 0.607 0.142 Hong Kong -0.007 -0.179*** 0.277*** 0.001 -0.002 4,300 0.229 0.209 Hungary -0.117 -0.04 0.079 0.007 -0.036 208 0.258 0.064 India -0.023** 0.336*** 0.153*** -0.001 -0.001 12,972 0.523 0.52 Indonesia -0.082*** 0.288*** 0.057** 0 -0.004 2,028 0.249 0.212 Ireland -0.011*** -0.285*** 0.255*** 0.001*** -0.004* 27,286 0.261 0.257 Israel -0.049** 0.05 0.200** -0.005 -0.006 865 0.22 0.165 Italy 0 -0.271*** 0.334*** -0.001** 0.002 22,991 0.406 0.404 Japan -0.009*** 0.038*** 0.195*** -0.002*** 0.003*** 50,525 0.142 0.14 Korea -0.029*** 0.02 0.203*** 0 -0.008** 17,998 0.169 0.164 Liechtenstein -0.011 -0.122* 0.156*** -0.001 0.024*** 1,487 0.262 0.206 Luxembourg 0.006*** -0.278*** 0.230*** 0 0 96,672 0.221 0.22 Malaysia 0.017** 0.00 0.113*** 0.002*** 0 11,721 0.17 0.164 Mexico -0.512*** -0.562*** 0.034 -0.027** 0.018 119 0.483 0.141 Netherlands -0.008 -0.300*** 0.442*** 0 -0.003* 4,940 0.586 0.576 New Zealand 0.077 -0.04 0.096 0.003 -0.011 638 0.282 0.07 Norway 0.023 0.05 0.051 0.003* -0.015 990 0.238 0.13 Philippines -0.079** 0.07 0.127*** -0.003 -0.003 869 0.223 0.156 Poland -0.036 -0.42 0.075 -0.004 -0.038 330 0.179 0.032 Portugal -0.003 0.05 0.028 -0.016** 0.003 532 0.504 0.318 Russia 0.015* -0.319*** 0.255*** 0 -0.010* 4,968 0.346 0.339 Singapore 0.002 -0.196*** 0.382*** 0 -0.002 11,289 0.335 0.327 Slovakia South Africa 0.062 -0.358** 0.193 0.006 0.001 82 0.703 0.074 Spain 0.003 -0.291*** 0.284*** -0.001** -0.001 29,870 0.334 0.331 Sweden 0 0.00 0.012 -0.004*** 0.004 2,561 0.16 0.118 Switzerland 0.002 -0.385*** 0.336*** -0.003* -0.005** 11,467 0.461 0.457 Taiwan -0.004 -0.302*** 0.300*** -0.002 -0.001 15,293 0.349 0.345 Thailand -0.020** 0.159*** 0.091*** 0.002*** -0.003 10,386 0.124 0.116 Turkey -0.103** 0.209* -0.004 0.001 0.009 490 0.28 0.247 UK 0.003 -0.249*** 0.243*** 0.001** -0.002* 69,892 0.255 0.253 USA -0.011*** -0.341*** 0.433*** 0.000*** -0.004*** 568,028 0.534 0.534
21
the total net assets, the funds with larger TNA will be easier to attract flows for next one month, nevertheless when we extent to fund flows of next three months, things are different, previously we have cash inflows of 39 out of 45 countries are positively correlate with TNA while there are only 16 countries left for the three months fund flows. We infer that the TNA may attract flows in short period, when period become longer, it will attract less. More and more countries will consider less of this factor, the fund with larger TNA cannot continue keep attraction of cash inflows in a long time.
Here we choose more European countries with large observations besides major countries we analysed of table 4,
France: Flowst+2 = 0.006×drawdown 0.275× past returns + 0.298×Flows t1 – 0.001×TNA -0.001 ×Age +c
Germany: Flowst+2 = 0.006×drawdown -0.237× past returns + 0.305×Flows t-1 – 0.000×TNA + 0.003×Age +c
Ireland: Flowst+2 = -0.011×drawdown -0.285× past returns + 0.255×Flows t-1 + 0.001×TNA – 0.004×Age + c
Italy: Flowst+2 = 0×drawdown -0.271× past returns + 0.334×Flows t-1 – 0.001×TNA + 0.002×Age + c
Luxembourg: Flowst+2 = 0.006×drawdown -0.278× past returns + 0.230×Flows t-1 – 0×TNA – 0×Age + c
Spain: Flowst+2 = 0.003×drawdown -0.291× past returns + 0.284×Flows t-1 – 0.001×TNA – 0.001×Age + c
Switzerland: Flowst+2 = 0.002×drawdown -0.385× past returns + 0.336×Flows t-1 – 0.003×TNA – 0.005×Age + c
UK: Flowst+2 = 0.003×drawdown -0.249× past returns + 0.243×Flows t-1 + 0.001×TNA – 0.002×Age + c
We can see the disposition effect is obviously for these European countries, all of the 8 countries’ fund flows are negatively correlated with past returns, especially Switzerland which is with the lowest coefficient. Half of countries are risk averse, which is similar to the global result. The investors from UK and Ireland would decrease their investment when drawdown increases, they are conservative investors at this point.
Japan: Flowst+2 = -0.009×drawdown +0.038× past returns +0.195 ×Flows t-1 – 0.002×TNA + 0.003×Age + c
Korea: Flowst+2 = -0.029×drawdown +0.021× past returns + 0.203×Flows t-1 – 0×TNA – 0.008×Age +c
22
Taiwan: Flowst+2 = -0.004×drawdown -0.302× past returns + 0.300×Flows t-1 – 0.002×TNA – 0.003×Age +c
China: Flowst+2 = -0.022×drawdown +0.185× past returns + 0.029×Flows t-1 – 0.001×TNA +0.007 ×Age + c
Based on the regression functions of Asian countries, we can see they are quite different from European and North American countries, there doesn’t exist disposition effect for investors from China, Japan and Korea, when they earn profit from the funds, they won’t do the same as the Europeans and Americans, they will keep in increasing cash flow in these funds in order to get more profit even if the potential risk always exists.
Canada: Flowst+2 = 0.002×drawdown -0.217× past returns + 0.287×Flows t-1 + 0.000×TNA + 0.000×Age + c
USA: Flowst+2 = -0.011×drawdown -0.341× past returns + 0.433×Flows t-1 + 0.000×TNA – 0.004×Age + c
Brazil: Flowst+2 = -0.016×drawdown +0.025× past returns + 0.136×Flows t-1 - 0.001×TNA – 0.007×Age + c
The two North American countries are similar to Europeans and their behaviors are stable in comparison with what they did for the one month fund flow, the Brazilian investors are similar to Asian as at disposition effect, they are risk averse.
23 5.2.3. Regression of 1-month fund flow on standard deviation
24
Based on our previous hypotheses, b2 is negative. We will compare with the empirical results, there are 24 countries are negatively impacted on risk. As US which with the largest number of observations, this coefficient of US is not statistically different from zero, we cannot detect how the US investors impact on risk, probably they pay more attention on other factors. The Brazilians are sensitive to risk and negative impact on this, the Finnish, Japanese, Dutch and investors from Liechtenstein are similar. There are also significant interested in risk, British, Canadian and Chinese investors are in this group, these three are large countries respectively located in Europe, North America and Asia. Some medium or small countries, such as Singapore, Slovakia, and Norway are risk seekers. Generally speaking, the risk seekers are half while risk averse investors are another half on their fund flow for one month. Next we will see how they will act for three months’ cash flow.
25 5.2.4. Regression of 3-months fund flow on standard deviation
26
This table is the regression result of fund flow for next three months, risk is the only
independent variable, at first glance the results are more or less the same as it for one month, there is one more country became risk seeker. USA keep the same, they are not sensitive to risk. British, Canadian and Chinese investors are always risk seekers. They search for greater volatility and uncertainty in investments in exchange for anticipated higher returns. Risk seekers might pursue investments such as small-cap stocks and international stocks, preferring growth investments over value investments. That being said, risk-seeking investors should conduct even greater due diligence when considering a riskier investment, due to the increased implied risk of such investments. French are risk seekers for three months fund flow. We can see there exists few difference of investors’ behavior between fund flow for one month and three months.
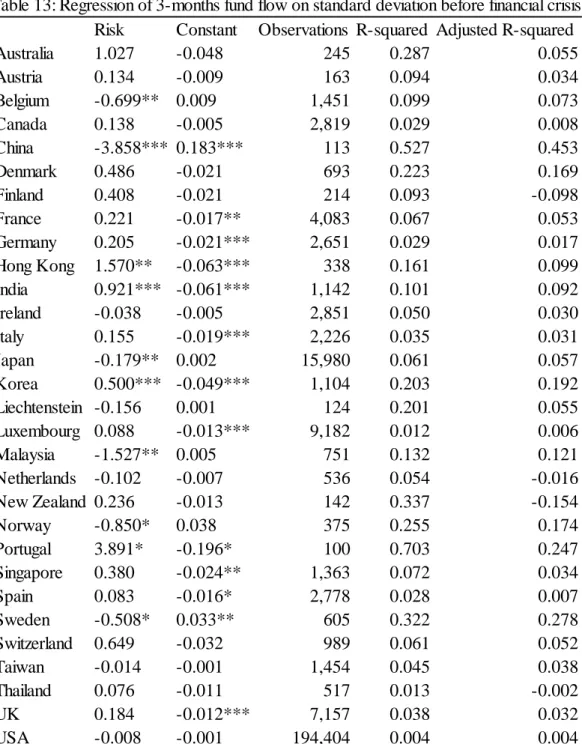
27 5.2.5. Regression of 1-month fund flow on standard deviation before financial crisis
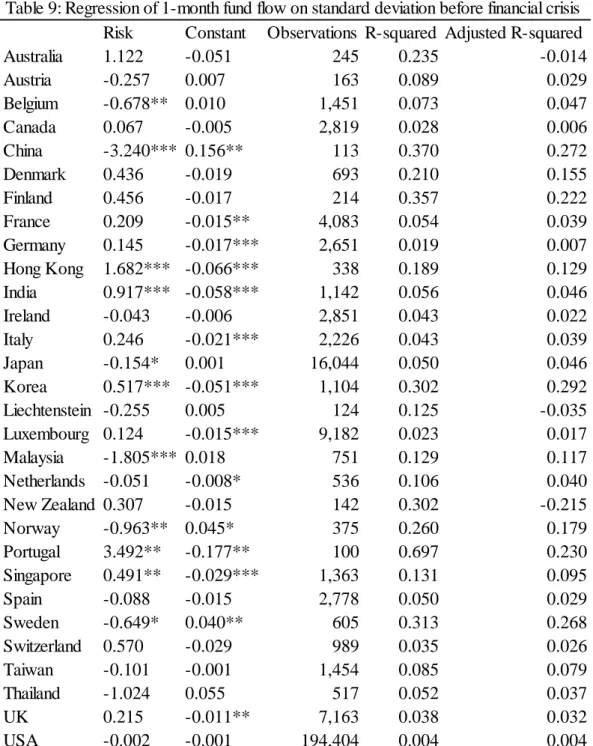
Now we will see the empirical result of fund flow before financial crisis with risk only, and check whether the crisis would affect the investors’ philosophy or not. We have totally 30 countries with sufficient observations to get the regression results. There are 13 of them are risk seekers while 6 countries are statistically significant different from zero, the risk aversion is obviously in 17 countries and 5 of them are statistically significant different from zero. We cannot analyze USA and UK here, although Chinese investors seemed conservative in this period, that is the first time Chinese are not risk seekers until now, we cannot take this as conclusion for this part, because there are just 113 observations which is far less than enough.
Risk Constant Observations R-squared Adjusted R-squared
Australia 1.122 -0.051 245 0.235 -0.014 Austria -0.257 0.007 163 0.089 0.029 Belgium -0.678** 0.010 1,451 0.073 0.047 Canada 0.067 -0.005 2,819 0.028 0.006 China -3.240*** 0.156** 113 0.370 0.272 Denmark 0.436 -0.019 693 0.210 0.155 Finland 0.456 -0.017 214 0.357 0.222 France 0.209 -0.015** 4,083 0.054 0.039 Germany 0.145 -0.017*** 2,651 0.019 0.007 Hong Kong 1.682*** -0.066*** 338 0.189 0.129 India 0.917*** -0.058*** 1,142 0.056 0.046 Ireland -0.043 -0.006 2,851 0.043 0.022 Italy 0.246 -0.021*** 2,226 0.043 0.039 Japan -0.154* 0.001 16,044 0.050 0.046 Korea 0.517*** -0.051*** 1,104 0.302 0.292 Liechtenstein -0.255 0.005 124 0.125 -0.035 Luxembourg 0.124 -0.015*** 9,182 0.023 0.017 Malaysia -1.805*** 0.018 751 0.129 0.117 Netherlands -0.051 -0.008* 536 0.106 0.040 New Zealand 0.307 -0.015 142 0.302 -0.215 Norway -0.963** 0.045* 375 0.260 0.179 Portugal 3.492** -0.177** 100 0.697 0.230 Singapore 0.491** -0.029*** 1,363 0.131 0.095 Spain -0.088 -0.015 2,778 0.050 0.029 Sweden -0.649* 0.040** 605 0.313 0.268 Switzerland 0.570 -0.029 989 0.035 0.026 Taiwan -0.101 -0.001 1,454 0.085 0.079 Thailand -1.024 0.055 517 0.052 0.037 UK 0.215 -0.011** 7,163 0.038 0.032 USA -0.002 -0.001 194,404 0.004 0.004
28
The same reason is for the country like Norway, Portugal, and etc. The Indian and Korean, Singaporean investors’ amount of cash flow is positively correlated with risk. Japanese are rational investor, until now Japanese always keep their rational investing options and after financial crisis, we will discuss it in the following part. Before financial crisis, the number of risk seek investors is smaller, we will discuss how it happens.
29 5.2.6. Regression of 1-month fund flow on standard deviation after financial crisis
30
Obviously there’s an important difference happened after financial crisis. After going through the results, there are 25 risk seekers among all 45 countries. Chinese, Canadian, Singaporean and UK investors are interested in greater volatility and uncertainty in investments in
exchange for anticipated higher returns. Australians also join the risk investment group while they are negatively impact on risk before crisis. Japanese kept the same as before. We think after financial crisis, some investors who lose a large amount because of it become more rational and conservative. But a few of 45 countries, as they’ve already lost a large amount, they were enthusiastically in greater returns and higher volatility, we analyze this is because of game psychology, otherwise they’ll never have the chance to win the returns back in short term. Besides risk, we have more other factors, we will analyze how they affect investors’ behavior.
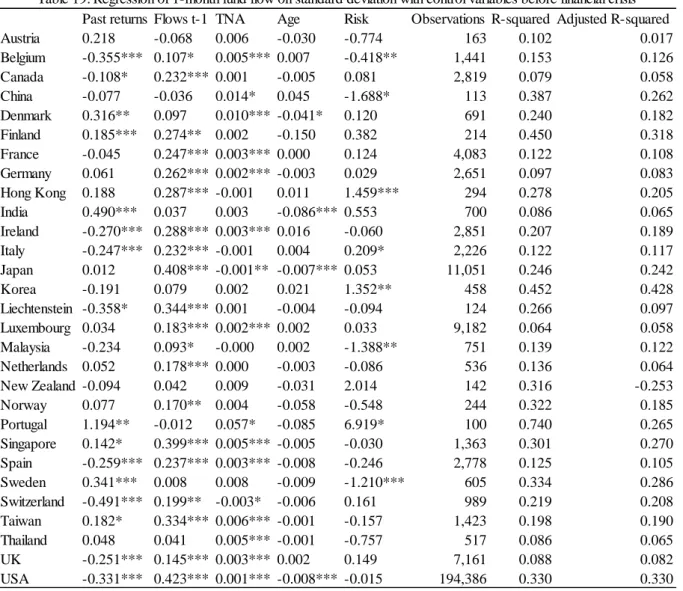
5.2.7. Regression of 1-month fund flow on drawdown risk before financial crisis
In this table, we have 29 countries with sufficient observations. Before financial crisis, there are 10 countries negatively correlated with drawdown, that is to say most of investors are
drawdown_12m past returns Flows t-1 TNA Age Observations R-squared Adjusted R-squared Austria -0.302* -0.105 -0.097 0.006 -0.050*** 163 0.133 0.051 Belgium 0.002 -0.398*** 0.116* 0.004*** 0.007 1,441 0.144 0.117 Canada 0.015 -0.087 0.230*** 0.001 -0.005 2,819 0.080 0.058 China 0.590** -0.033 -0.063 0.020** 0.114 113 0.401 0.279 Denmark 0.024 0.333** 0.097 0.010*** -0.042** 691 0.241 0.182 Finland -0.037* 0.190** 0.283** -0.003 -0.107* 214 0.449 0.317 France 0.050*** 0.035 0.244*** 0.003*** 0.000 4,083 0.127 0.113 Germany 0.012 0.079 0.261*** 0.002*** -0.003 2,651 0.097 0.084 Hong Kong 0.086*** 0.425** 0.309*** 0.002 0.018 294 0.274 0.200 India 0.044 0.543*** 0.038 0.003 -0.085*** 700 0.086 0.065 Ireland 0.005 -0.269*** 0.288*** 0.003*** 0.016 2,851 0.207 0.189 Italy 0.046*** -0.164*** 0.227*** -0.000 0.003 2,226 0.127 0.121 Japan 0.006 0.017 0.408*** -0.001** -0.007*** 11,051 0.246 0.242 Korea -0.110 -0.181 0.078 0.003 0.020 458 0.450 0.426 Liechtenstein -0.044 -0.384* 0.343*** 0.000 -0.005 124 0.268 0.099 Luxembourg 0.012 0.048 0.184*** 0.002*** 0.002 9,182 0.065 0.058 Malaysia 0.080 -0.396* 0.110** -0.001 0.003 751 0.129 0.112 Netherlands 0.001 0.050 0.176** 0.000 -0.003 536 0.135 0.063 New Zealand 0.111 0.015 0.035 0.003** -0.027 142 0.317 -0.251 Norway -0.178** -0.053 0.159** 0.006* -0.079 244 0.338 0.204 Portugal 0.182 1.732*** -0.022 -0.011 -0.032 100 0.733 0.245 Singapore -0.022 0.121 0.396*** 0.005*** -0.005 1,363 0.302 0.271 Spain 0.018 -0.190*** 0.237*** 0.003*** -0.005 2,778 0.124 0.103 Sweden -0.034 0.276** 0.022 -0.002 0.023 605 0.319 0.270 Switzerland 0.069*** -0.325*** 0.166** -0.002 -0.007* 989 0.241 0.230 Taiwan -0.018 0.158* 0.336*** 0.006** 0.000 1,423 0.197 0.189 Thailand -0.084 0.001 0.049 0.005*** 0.002 517 0.084 0.063 UK 0.030*** -0.209*** 0.144*** 0.003*** 0.002 7,161 0.090 0.083 USA -0.009*** -0.337*** 0.423*** 0.001*** -0.008*** 194,386 0.330 0.330
31
willing to invest more in the fund which with the drawdown increased. The empirical result here is different from our hypotheses to some degree, we suppose this coefficient is positive because of loss aversion. After crisis, more countries are not like previously, we will see it in the next table. We can conclude the fund flows for future one month is half positively and half negatively correlated with past returns and age of the fund. The original fund flow definitely affects the future flow, if the fund attracted cash inflow, it will attract more and more flow in next month, which is the positive cycle and vice verse. The similar situation to total net assets, this is highly corresponding to our hypotheses that TNA is positively correlated to fund flow, big funds attract more flows. For the reasons, we think big funds are more visible and well-known by investors. For the specific countries or continents, USA which is the country with largest number of observations and variety kinds of funds, the investors prefer big funds and the funds that attracted more cash flows, they don’t interested in large age funds and dislike drawdown, especially for past return, the disposition effect is very important for Americans, they will sell the fund as soon as it bring them some amount of returns. UK investors are similar to USA except their attitude to drawdown, British investors didn’t averse loss of fund, once the fund price drop a lot from peak to trough, they will increase cash flow invest on this fund and wait for the price increase, UK investors don’t accept loss because of drawdown, they are seeking long-term profits. Chinese, French, Hong Kong, Italian and Switzerland investors are the same impact on drawdown as UK. Japan is the only one country which doesn’t prefer big funds, but the value of coefficient is not large.
32 5.2.8. Regression of 1-month fund flow on drawdown risk after financial crisis
From the first sight of the result after financial crisis, there are two visible differences overall, the drawdown and age of fund. There are nearly 60% of 45 countries, their cash inflow in investing is negatively correlated with drawdown while this indicator is just one out of three before crisis. The investors would not invest or wait until the fund price increase, the crisis is
drawdown_12m past returns Flows t-1 TNA Age Observations R-squared Adjusted R-squared Argentina -0.014 0.192 0.323** -0.005 0.008 385 0.337 0.192 Australia 0.009 -0.106* 0.094*** 0.002*** -0.006*** 5,584 0.071 0.057 Austria -0.024 0.242*** 0.085 0.005*** -0.004 2,049 0.108 0.068 Belgium 0.005 -0.332*** 0.279*** 0.001 -0.002 12,345 0.227 0.221 Brazil -0.009** 0.045*** 0.171*** 0.001** -0.007*** 16,836 0.050 0.045 Canada 0.005 -0.231*** 0.250*** 0.001*** -0.002 45,198 0.165 0.163 Chile -0.088** 0.005 0.132 -0.001 0.004 899 0.245 0.187 China 0.035*** 0.280*** -0.075*** 0.003*** 0.009*** 7,194 0.428 0.421 Denmark 0.011 0.176*** 0.197*** 0.003*** -0.008** 3,223 0.135 0.111 Estonia 0.234** 0.280 0.021 0.002 -0.026 127 0.620 0.202 Finland -0.029** 0.115*** 0.166*** 0.003* -0.016** 2,437 0.156 0.125 France 0.001 -0.255*** 0.369*** 0.000 -0.002* 41,406 0.257 0.255 Germany 0.002 -0.205*** 0.389*** 0.000 0.002** 24,518 0.263 0.260 Greece -0.019 0.211* 0.283 0.000 -0.015 199 0.539 0.170 Hong Kong -0.012 -0.167*** 0.363*** 0.002*** -0.002 4,228 0.207 0.190 Hungary -0.070 -0.202 0.265* 0.005 -0.031 250 0.235 0.061 India 0.012 0.498*** 0.115*** 0.001 -0.001 13,002 0.669 0.667 Indonesia -0.072*** 0.284 0.194*** 0.003** -0.005 2,173 0.250 0.218 Ireland -0.016*** -0.237*** 0.308*** 0.002*** -0.005*** 25,638 0.174 0.171 Israel -0.066** 0.083 0.356*** 0.002 -0.005 932 0.268 0.218 Italy -0.004 -0.239*** 0.409*** -0.000 0.000 21,556 0.325 0.322 Japan -0.011*** 0.025*** 0.367*** -0.000* 0.002*** 41,647 0.189 0.187 Korea -0.016** 0.030 0.286*** 0.001*** -0.007*** 19,227 0.169 0.165 Liechtenstein -0.018 -0.139** 0.251*** 0.001 0.017** 1,457 0.202 0.151 Luxembourg -0.001 -0.234*** 0.280*** 0.001*** -0.002* 91,782 0.142 0.141 Malaysia 0.006 -0.038 0.113*** 0.003*** -0.000 11,554 0.090 0.083 Mexico -0.233 -1.019** -0.016 0.001 -0.026 141 0.273 -0.130 Netherlands -0.010* -0.320*** 0.419*** 0.001 -0.004** 4,596 0.447 0.436 New Zealand 0.123*** 0.118 0.127 0.004* -0.009 550 0.238 0.093 Norway 0.029** 0.109 0.149*** 0.003** -0.014 782 0.168 0.062 Philippines -0.072* -0.096 0.168*** 0.002 -0.001 920 0.163 0.092 Poland 0.004 -0.118 0.200*** -0.002 -0.030 380 0.151 0.013 Portugal -0.036 -0.194 0.023 0.009 0.002 453 0.291 0.119 Russia 0.012 -0.365*** 0.220*** 0.001 -0.014** 5,567 0.208 0.199 Singapore -0.002 -0.166*** 0.516*** 0.000 -0.002 10,339 0.357 0.351 Slovakia South Africa Spain -0.002 -0.231*** 0.400*** 0.001* -0.004 28,146 0.293 0.291 Sweden -0.014 0.250*** 0.130*** 0.002 -0.000 2,079 0.131 0.092 Switzerland -0.007 -0.370*** 0.391*** -0.001 -0.005*** 10,957 0.347 0.342 Taiwan -0.007** -0.220*** 0.471*** 0.000 -0.001 14,533 0.372 0.368 Thailand 0.002 0.080** 0.199*** 0.004*** -0.003 10,421 0.139 0.132 Turkey -0.088** 0.059 0.060 0.006* -0.002 576 0.198 0.161 UK 0.004 -0.243*** 0.223*** 0.002*** -0.003*** 65,381 0.134 0.133 USA -0.015*** -0.298*** 0.500*** 0.001*** -0.003*** 389,557 0.461 0.461
33
really with great impact force, and the investors’ don’t have confidence like before, in order to avoid losing anymore, they would not increase the investing amount. Also the age of fund is not as useful as before, before crisis, nearly half of investors prefer large age fund while this number decrease to 25% after crisis, the large age is not an important judgment basis as before. The rest factors to investors didn’t change a lot after crisis. Past returns are still half positively and half negatively correlated with fund flow, the original flow and size of funds always positively affect the investors’ behavior without doubt. Especially 100% of fund which they attracted cash flows, the more they got before, the more the investors would invest in next month, we can see the positive cycle is very important.
The USA and UK investors keep unchanged, Chinese investors still positive impact on drawdown, the crisis didn’t affect them a lot. Japanese became significant of drawdown and past returns, their impact just like most of countries, one difference of Japanese after crisis is they trust large age fund more than before. The European countries, Germany, France are similar except fund age. The disposition effect and loss averse are core and negative impact on Irish investors. Based on the investing behavior of specific countries, there are not similarities for the investors come from the same continent, even the neighboring country, their action are quite different. We have special country here, Chinese investors almost positive correlated with every factors, besides the 5 factors we have in this table, they are also risk seekers in table 11, it’s the only one country negatively correlated with original fund flows, as this is the fund flow for future one month, we will see if this indicator would be different in cash flow of next three month.
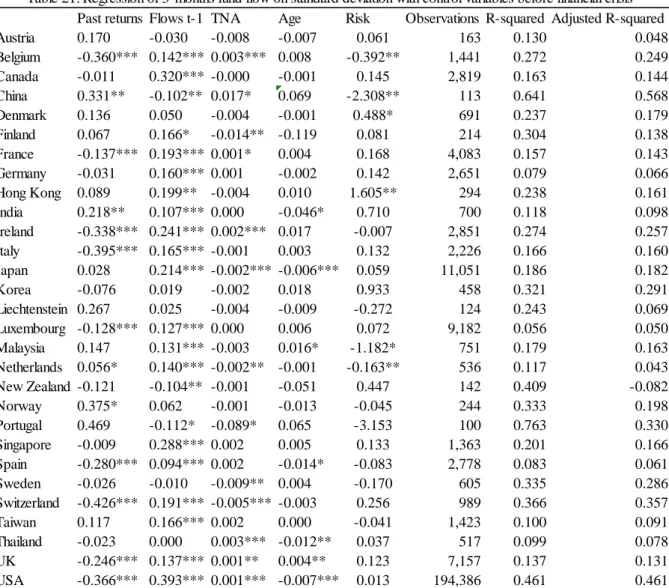
34 5.2.9. Regression of 3-months fund flow on standard deviation before financial crisis
This table shows the regression results of fund flow after financial crisis for future three months with risk as the only independent variable, the three month results is more close to the investor’s behavior in a longer term while one month is focus more on the investors’ first response to the external factors.
From the empirical result here, it’s similar to that of one month.
Risk Constant Observations R-squared Adjusted R-squared
Australia 1.027 -0.048 245 0.287 0.055 Austria 0.134 -0.009 163 0.094 0.034 Belgium -0.699** 0.009 1,451 0.099 0.073 Canada 0.138 -0.005 2,819 0.029 0.008 China -3.858*** 0.183*** 113 0.527 0.453 Denmark 0.486 -0.021 693 0.223 0.169 Finland 0.408 -0.021 214 0.093 -0.098 France 0.221 -0.017** 4,083 0.067 0.053 Germany 0.205 -0.021*** 2,651 0.029 0.017 Hong Kong 1.570** -0.063*** 338 0.161 0.099 India 0.921*** -0.061*** 1,142 0.101 0.092 Ireland -0.038 -0.005 2,851 0.050 0.030 Italy 0.155 -0.019*** 2,226 0.035 0.031 Japan -0.179** 0.002 15,980 0.061 0.057 Korea 0.500*** -0.049*** 1,104 0.203 0.192 Liechtenstein -0.156 0.001 124 0.201 0.055 Luxembourg 0.088 -0.013*** 9,182 0.012 0.006 Malaysia -1.527** 0.005 751 0.132 0.121 Netherlands -0.102 -0.007 536 0.054 -0.016 New Zealand 0.236 -0.013 142 0.337 -0.154 Norway -0.850* 0.038 375 0.255 0.174 Portugal 3.891* -0.196* 100 0.703 0.247 Singapore 0.380 -0.024** 1,363 0.072 0.034 Spain 0.083 -0.016* 2,778 0.028 0.007 Sweden -0.508* 0.033** 605 0.322 0.278 Switzerland 0.649 -0.032 989 0.061 0.052 Taiwan -0.014 -0.001 1,454 0.045 0.038 Thailand 0.076 -0.011 517 0.013 -0.002 UK 0.184 -0.012*** 7,157 0.038 0.032 USA -0.008 -0.001 194,404 0.004 0.004
35 5.2.10. Regression of 3-months fund flow on standard deviation after financial crisis
36
Overall, the regression result future three months’ fund flow is similar to that of one month. There exists some small difference, Australian’s behavior became insignificant for three months time period, some investors will not change the investing strategy immediately once the external factors changed, they need some time to analyse and decide the investing options, Australian is visible risk seeker on one month’s reaction. Chinese investors are different from Australian, they are opposite, for three months investing behavior, Chinese are risk seekers while they are insignificant to be risk seeker or risk-averse investors for shorter term, Chinese are always risk investors in great majority parts. Investors from France and Greece searched for greater volatility and uncertainty in investments in order to get anticipated higher returns. French, Japanese, Dutch and Liechtensteiner are still risk averse investors while investors from Singapore, UK and Norway are risk seekers, these countries kept the behavior unchanged from one month to three months.
When we compare this table to previously one, it’s quite different. There are more risk
seekers after financial crisis, investors are confidence with the prospect of economic recovery. From another perspective, the increase of consumption and investment amount, especially risk investment increased, the signal means the economic rapid recovery.
37 5.2.11. Regression of 3-months fund flow on drawdown risk before financial crisis
In this table, we have 29 countries with sufficient observation. For the three months’ fund flow, US investors just follow the funds that with more original flows and big total net assets, they don’t ever trust the large age fund. They deducted the cash flow once they get the returns from the fund or it decrease from peak to trough in order to averse loss, US investors are very cautious. In comparison with UK investors, British are more patient, they will not go into action as soon drawdown occurs, and they prefer large age fund, because it’s more stable and less risk. German investor only positively correlated with original flows. We don’t analyse Chinese investors, the reasons are the same as one month’s fund flow, and the number of observation is too small. Japanese’s style is dislike big and large age fund, more original fund flows is attractive to them. French investors are positive in this time period.
When we look back to previous table,the affect of drawdown, past return, original flow, and fund age are more or less the same. The investor’s based on total net assets changed a lot, Japan is the only one country which significantly negatively correlated with big funds for one month’s fund flow among all countries, and here are half of the countries dislike big funds,
drawdown_12m past returns Flows t-1 TNA Age Observations R-squared Adjusted R-squared
Austria -0.118 0.098 -0.044 -0.007 -0.019 163 0.147 0.066 Belgium -0.007 -0.408*** 0.150*** 0.003** 0.008 1,441 0.257 0.233 Canada 0.004 -0.002 0.320*** -0.000 -0.001 2,819 0.161 0.142 China -0.368 0.249* -0.093** 0.019* 0.099 113 0.629 0.553 Denmark -0.006 0.176* 0.055 -0.002 -0.002 691 0.225 0.166 Finland -0.062* 0.040 0.164 -0.017*** -0.094 214 0.328 0.168 France 0.039*** -0.075 0.191*** 0.001* 0.003 4,083 0.161 0.148 Germany 0.023 0.002 0.160*** 0.001 -0.002 2,651 0.080 0.066 Hong Kong 0.046 0.158 0.250*** -0.000 0.020 294 0.191 0.109 India 0.007 0.228* 0.109** -0.000 -0.039* 700 0.109 0.088 Ireland 0.003 -0.335*** 0.241*** 0.002*** 0.017 2,851 0.274 0.257 Italy 0.034*** -0.334*** 0.162*** -0.001 0.002 2,226 0.170 0.165 Japan -0.010 0.023 0.215*** -0.002*** -0.006*** 11,051 0.187 0.182 Korea -0.126** -0.100 0.016 -0.001 0.015 458 0.322 0.292 Liechtenstein 0.028 0.283** 0.031 -0.004 -0.007 124 0.241 0.067 Luxembourg 0.000 -0.127*** 0.127*** 0.000 0.005 9,182 0.056 0.049 Malaysia 0.153 0.020 0.147*** -0.003 0.016* 751 0.169 0.153 Netherlands -0.029 0.035 0.134*** -0.002** -0.000 536 0.118 0.045 New Zealand 0.198* 0.046 -0.126** 0.001 -0.047 142 0.474 0.037 Norway -0.119 0.290* 0.052 0.001 -0.038 244 0.354 0.223 Portugal 0.009 0.399 -0.120* -0.051** 0.062 100 0.756 0.311 Singapore -0.065*** -0.057 0.279*** 0.003* 0.002 1,363 0.211 0.176 Spain 0.024 -0.214*** 0.092*** 0.002 -0.013 2,778 0.085 0.064 Sweden 0.000 -0.032 -0.008 -0.011** 0.010 605 0.334 0.285 Switzerland 0.069*** -0.270*** 0.160*** -0.004** -0.004 989 0.398 0.390 Taiwan -0.052 0.053 0.168*** 0.002 -0.000 1,423 0.109 0.100 Thailand 0.002 -0.022 0.000 0.003*** -0.012** 517 0.099 0.078 UK 0.022** -0.214*** 0.137*** 0.001*** 0.003* 7,157 0.139 0.132 USA -0.005*** -0.368*** 0.393*** 0.001*** -0.007*** 194,386 0.461 0.461
38
generally speaking, big funds are more well-known and visible by investors, based on empirical results here, we can see investors from different countries have different ideas. It’s up to specific country.
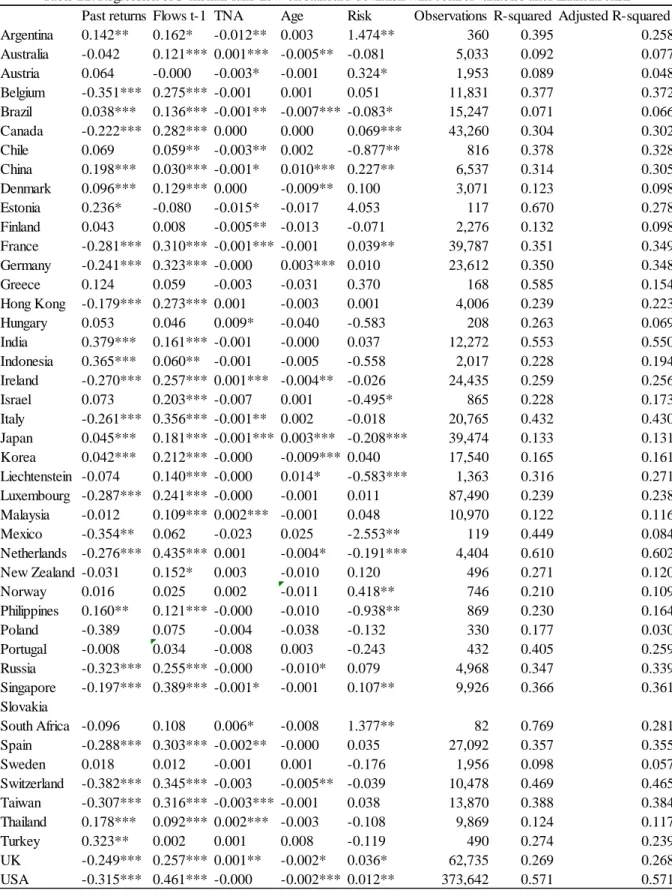
5.2.12. Regression of 3-months fund flow on drawdown risk after financial crisis
drawdown_12m past returns Flows t-1 TNA Age Observations R-squared Adjusted R-squared
Argentina -0.009 0.141** 0.193* -0.011** 0.011 360 0.357 0.212 Australia 0.008 -0.04 0.122*** 0.001** -0.005** 5,033 0.091 0.077 Austria -0.006 0.06 -0.000 -0.002 -0.004 1,953 0.084 0.042 Belgium 0.007 -0.346*** 0.275*** -0.001 0.000 11,831 0.376 0.372 Brazil -0.016*** 0.025*** 0.136*** -0.001** -0.007*** 15,247 0.073 0.068 Canada 0.002 -0.223*** 0.284*** 0.001 -0.000 43,260 0.301 0.300 Chile -0.068** 0.074 0.065** -0.003** 0.006 816 0.370 0.319 China -0.021*** 0.182*** 0.029*** -0.001 0.006*** 6,537 0.314 0.305 Denmark 0.01 0.105*** 0.130*** 0.000 -0.009** 3,071 0.122 0.097 Estonia 0.176* 0.197 -0.105 -0.013 0.065 117 0.673 0.284 Finland 0.007 0.048 0.009 -0.005** -0.012 2,276 0.132 0.098 France 0.006** -0.275*** 0.310*** -0.001*** -0.001 39,787 0.351 0.349 Germany 0.006* -0.234*** 0.323*** -0.000 0.003*** 23,612 0.351 0.348 Greece -0.063** 0.081 0.081 0.001 -0.021 168 0.588 0.161 Hong Kong -0.011 -0.190*** 0.271*** 0.001 -0.003 4,006 0.241 0.225 Hungary -0.117 -0.037 0.079 0.007 -0.036 208 0.258 0.064 India -0.025*** 0.353*** 0.160*** -0.000 -0.000 12,272 0.554 0.551 Indonesia -0.082*** 0.288*** 0.057** -0.000 -0.004 2,017 0.235 0.201 Ireland -0.012*** -0.282*** 0.256*** 0.001*** -0.004** 24,435 0.260 0.258 Israel -0.049** 0.046 0.200** -0.005 -0.006 865 0.220 0.165 Italy -0.001 -0.261*** 0.357*** -0.001** 0.002 20,765 0.432 0.430 Japan -0.009*** 0.041*** 0.184*** -0.001*** 0.004*** 39,474 0.127 0.125 Korea -0.028*** 0.021 0.212*** -0.000 -0.009** 17,540 0.166 0.162 Liechtenstein -0.012 -0.125** 0.166*** -0.001 0.025*** 1,363 0.277 0.229 Luxembourg 0.006*** -0.281*** 0.241*** -0.000 -0.001 87,490 0.239 0.238 Malaysia 0.014* 0.001 0.109*** 0.002*** -0.001 10,970 0.123 0.116 Mexico -0.512*** -0.562*** 0.034 -0.027** 0.018 119 0.483 0.141 Netherlands -0.008* -0.303*** 0.455*** 0.000 -0.003* 4,404 0.600 0.592 New Zealand 0.049 -0.019 0.148 0.003 -0.010 496 0.274 0.124 Norway 0.034* 0.023 0.038 0.003* -0.013 746 0.186 0.081 Philippines -0.079** 0.066 0.127*** -0.003 -0.003 869 0.223 0.156 Poland -0.036 -0.417 0.075 -0.004 -0.038 330 0.179 0.032 Portugal -0.016 -0.02 0.036 -0.010 0.002 432 0.405 0.258 Russia 0.015* -0.319*** 0.255*** 0.000 -0.010* 4,968 0.346 0.339 Singapore 0.004 -0.198*** 0.393*** -0.001 -0.002 9,926 0.362 0.357 Slovakia South Africa 0.062 -0.358** 0.193 0.006 0.001 82 0.703 0.074 Spain 0.003 -0.284*** 0.303*** -0.001** -0.001 27,092 0.356 0.354 Sweden -0.001 0.018 0.015 -0.003* 0.003 1,956 0.095 0.054 Switzerland -0.001 -0.383*** 0.346*** -0.003* -0.005** 10,478 0.469 0.465 Taiwan -0.001 -0.308*** 0.316*** -0.002* -0.001 13,870 0.388 0.384 Thailand -0.020** 0.161*** 0.093*** 0.002*** -0.003 9,869 0.125 0.117 Turkey -0.103** 0.209* -0.004 0.001 0.009 490 0.280 0.247 UK 0.003 -0.246*** 0.257*** 0.001** -0.002** 62,735 0.269 0.268 USA -0.012*** -0.325*** 0.458*** 0.000*** -0.003*** 373,642 0.573 0.572
39
In three months’ time period after financial crisis, American investors willing to invest more in the funds with original fund flows, from now on, they don’t care about the big or small funds, there no correlation between their cash inflow and total net asset of fund, after financial crisis, US investors are cautious and not as patient as before, they tried to avoid any potential chance of losing even at the price of potential return. UK are similar to USA, they both dislike large age fund. Thai are positive to the factors except drawdown, Chinese are the same. Brazilians are positively correlated with past returns and original flows. European countries, France, Germany are similar to each other, Japanese and Korean just different in their attitude to the age of fund, both of them are patient when face drawdown, and prefer big fund. The unification of countries is more visible here, especially for the countries from the same continent.
In comparison with results before financial crisis, less than half countries’ fund flow is positively correlated with drawdown while this percentage increased close 60% after crisis. The big funds are more welcomed as the countries which positively correlated with total net assets is increase by 10% before and after, big funds is more stable and less risk, it affect less than the small or medium fund in the crisis. Besides, large age fund are more welcomed by investors before and after, the fund that stays for longer time usually with its own advantage. The rest empirical results keep unchanged after crisis.
In three months’ time, just like comparison between one month and three months before crisis, the big difference is much more countries’ cash inflow is negatively correlated with total net assets of funds. The advantage of big funds that attract investors would not obvious as the time passes.
6. Conclusion
Our understanding of what factors drive investors’ cash flow on mutual fund is based primarily on the behavior of investors across countries. To fill this gap in the study we use data on a large sample of mutual funds in 45 countries. There are substantial differences in flow-performance relationship across countries.
The methodology is based on six variables changes various fund flows measures, we include performance-related variables and control variables. The flows response is strong in the tests based on regression results.
For the loss aversion and disposition effect which are our important objects, the results are not conclusive. There are always half of the countries’ investors are risk seekers while another
40
half are risk aversers. This result is true before and after financial crisis, there are a few countries’ investors became risk seekers after financial crisis while almost same number of investors became more conservative, so the loss aversion of investors kept overall balance all the time. The result rationalizes the existence of different type of investors. Some of investors interested in higher volatility in order to get potential higher returns, the financial crisis doesn’t affect investors too much at this point.
Our results exhibit a disposition effect, the evidences show that loss aversion and disposition among investors are similar, half of the countries’ investors are positively correlated while rest of them are negatively correlated with past returns. The results truly reflect investors’ behavior, half of countries’ investors tend to decrease the cash inflow when they get the return as the price increases in order to lock return. The rest of investors are not satisfied with
current level of return, they continue to invest more amount of cash flow and expect the price increase since these funds’ performed well recently. For Taiwan investors at this point, our result is consistent with the research by Lee, Yen and Chan (2013), Barber et al. (2007), because Taiwan mutual fund investors exhibit a disposition effect.
We cannot conclude how the loss aversion and disposition effect affect investors’ behavior as these two factors are not uniform, they vary by different countries and keep equal proportion during all time periods.
In the methodology part previously, we hypotheses drawdown and standard deviation are both negatively correlated with investors’ cash inflow, the coefficient of total net asset is positive. As expected, US which with the largest observations and value of total net assets, their investors will reduce investments amount once drawdown happens based on all regression results of US. And they are risk-averse investors. Japanese investors are the same react to drawdown as Americans. Nevertheless investors from UK which is the country with third largest observations in our sample, they are positively correlated with drawdown risk. We investigate disposition effect which is important in this study. Americans’ disposition effect is significant, once they have returns from funds, the cash inflow will be reduced in order to avoid loss and lock current gains. Some related studies suggest that losses are more powerful than gains, it’s reasonable. Not only US investors but also UK investors’ fund flows are negatively with this variable, both of them tend to sell the fund when price increases to lock return in all cases, Japanese prefer investing more in the funds which they get return. The chasing performance is visible in Japan as they are willing to invest more in the funds that performed well recently.