Study of Glass Forming on Cu
60.0Zr
32.5Ti
7.5Alloy by Molecular Dynamics Simulation
Luis César Rodríguez Aliagaa*, Camila Sanches Schimidta, Lucas Venancio Pires de Carvalho Limaa,
Ivan Napoleão Bastosa, Walter José Bottab
Received: June 05, 2017; Revised: October 04, 2017; Accepted: November 20, 2017
This paper presents the results of Molecular Dynamics (MD) simulations of Cu60.0Zr32.5Ti7.5 alloy through the open source code LAMMPS. Amorphous samples were produced by quenching the molten metal from 2300 to 300 K. The pair distribution functions of the liquid and solid were calculated. Moreover, the atomic short-range order at 800, 700 and 300 K was obtained by using the Voronoi
tesselation method. Cu-centered icosahedral clusters were the prevailing configuration. The tensile
stress-strain curve showed that the material present plastic deformation, however, shear bands were not observed in the MD simulation. The evolution of viscosity in temperatures higher than its glass transition temperature was also determined. Furthermore, the fragility of the alloy at glass temperature was evaluated.
Keywords: Amorphous alloys, Glass forming ability, Molecular Dynamics, Voronoi method
*e-mail: aliaga@iprj.uerj.br
1. Introduction
When a liquid metal is cooled at a slow or even moderate cooling rate, the liquid freezes and forms a solid at temperatures below the melting temperature, Tm. At Tm
the liquid undergoes a first-order phase transition during its solidification. It is evidenced by a great difference in the
level of some extensive properties such as volume, total energy, etc. The liquid phase has a higher energy than its solid phase; hence, the system will release energy as latent heat in order to assume a highly ordered crystalline state. On the other hand, by fast cooling the liquids, it is possible to obtain a material that persists in a liquid state even below Tm. This material is known as a supercooled liquid. As the fast cooling continues and reaches temperatures below the glass transition temperature (Tg), the material becomes a solid with a structure similar to the liquid phase. This state is referred to amorphous or glassy, which corresponds to a metastable phase1. Nowadays, it is possible to distinguish two types of amorphous materials. The first type corresponds
to ordinary amorphous, which during heating from solid state does not exhibit glass transition temperature, and just presents a crystallization temperature (Tx). The second type presents a clear Tg followed by a supercooled liquid region, until it reaches Tx.
During the last decades, the study of metallic glasses
has gained great industrial and scientific interest due to their
unique properties such as excellent corrosion resistance and high mechanical strength2. However, the production of
materials with enough thickness for technological application
is a difficult and costly task. This limitation is related to the
tendency of metallic alloys to solidify with a crystalline structure that corresponds to a more stable phase.
In order to understand bulk metallic glass for technological
applications, research is still necessary. Nowadays, the study
of metallic glasses is carried out by different approaches
such as experimental, theoretical and Molecular Dynamics. This last technique can be considered as a virtual lab tool3,
producing results related to diverse physical and structural properties. These results, however, are not always available from experimental techniques because the simulated conditions
can be very different from the actual tests. In addition, several
semi-empirical models and First Principles were proposed to explain the short-range order structure related to the Glass Forming Ability (GFA)4. Furthermore, studies based
on molecular dynamics were applied to study various alloy systems. These studies produced a sound prediction about the
development of different clusters present in the amorphous
alloys. Until now, a well-accepted approach to describe the behavior of all metallic glass systems does not exist.
It is well known that metallic glasses based on zirconium5-7,
palladium8,9 and rare earth10-12 have high GFA, thus several
alloys were proposed. However, these materials are relatively expensive. Designing amorphous phases using less costly materials such as aluminum, iron and copper can be more adequate for future engineering applications. Notwithstanding, these base elements present a lower GFA than is necessary to add adequate alloying elements to increase this ability.
aDepartamento de Materiais, Instituto Politécnico, Universidade do Estado do Rio de Janeiro, Rua
Bonfim, 25, CEP 28.625-570, Nova Friburgo, RJ, Brazil.
There are a lot of reports about Cu-Zr alloys13-16 showing
their glass forming ability. Thus, this binary system is the base for adding other elements to more easily produce the amorphous materials. Al is a common alloying element introduced in these alloys. Although, the ternary alloy improves the GFA but the corrosion properties are not so high17,18, limiting the potential technological applications.
Ti is another important alloying element that can partially replace the Zr. Ti improves the GFA and the mechanical properties19 as well as the corrosion resistance20. In this sense,
the composition Cu60Zr25Ti15 presents the lowest corrosion rate21 of the system Cu-Zr-Ti.
On the other hand, amorphous alloys present interesting
mechanical properties. In general, they hold high mechanical
resistance and exhibit elastic modulus on the same order as conventional engineering metals22 although in most cases it presents a fragile behavior. It is accepted that plastic
deformation in metallic glasses is concentrated in narrow regions called shear bands23. A well accepted theory was
proposed by Argon24, later it was developed by Falk25
and more recently by Schuh26. This theory is based on the
Shear Transformation Zones (STZ). An STZ is analogous to a nanoscopic dislocation loop. Under stress, some small group of atoms shifts with respect to a neighboring loop, creating plastic deformation. However, recent studies shown
that shear band formation depended on different conditions
such as the sample thickness27-30.
In the current work, we use the open source LAMMPS31
in computational molecular dynamics simulation to study Cu-Zr-Ti alloy because of its limited experimental data. Detailed thermo-physical characterizations of properties of this alloy were obtained from simulated and experimental methods. The tendency to form amorphous phase was presented and discussed as well as its mechanical behavior by tensile tests.
2. Experimental and Computational
Simulation
2.1 Experimental
Button alloys with the selected composition were produced by arc-melting under argon atmosphere and Ti-gettered from high purity Cu, Zr and Ti elements. Afterwards, button alloys were remelted in quartz crucibles and rapidly quenched by melt-spinning the alloys onto a copper wheel, rotating at the speed of 30 m/s. The obtained melt-spun ribbons were
characterized by X-Ray Diffraction (XRD) with Cu-Kα
radiation and Differential Scanning Calorimetry (DSC)
under a heating rate of 0.67 K/s at pure argon atmosphere.
2.2 Computational simulation
To model the atomic interaction and to obtain an atomic description of the glass formation during the rapid cooling of Cu60.0Zr32.5Ti7.5 alloy, the MD simulation technique was
adopted under the Finnis-Sinclair Embedded Atom Method (FS-EAM) potential32. The open source code, LAMMPS, has
been used to perform the MD simulations. The simulations were carried out using a constant number of particles under the isothermal-isobaric (NPT) ensemble. The simulated system consisted of 32000 atoms in a cubic unit cell of the B2 structure with periodic boundary conditions. The number of Cu and Zr atoms was adjusted with a number of Ti atoms
according to the atomic percentage defined by the stoichiometry
of the alloy under study. First, the alloy was minimized at 0 K and then relaxed at 300 K by 1 ns. Subsequently, the system was heated to 2300 K at a heating rate of 5 K/ps and kept at this temperature by 1 ns in order to allow the liquid stabilization. After that, the system was cooled to 2000 K and then quenched to 200 K with the cooling rates of 0.5, 5 and 50 K/ps. The MD timestep selected for the simulation was 2 fs. The structural evolution of the system was evaluated through a temperature-volume curve, viscosity, total and partial radial distribution function. The Short Range Order (SRO) or atomic clusters were analyzed at 800, 700 and 300 K using the Voronoi tessellation method implemented
in the open source package OVITO 2.633.
The interactions between Cu, Zr and Ti considered the generalized form of FS-EAM potentials developed by Finnis and Sinclair32,34. In the FS-EAM potential, the total energy
Etot of an atom i is given by34:
(1)
where the sum is over all atoms shorter than a cutoff
distance. The key features of this formula are the pair-interaction term ∅, and the embedding function F. The parameter F depends non-linearly on the contributions of
the neighboring atoms to the local electron density ρ. In this
form, the pair-interaction and electron density functions are
different from each combination of central atom type (α) and neighbor type (β), whereas the embedding functions are specific to the species of each neighbor β, and the central atom α, respectively.
3. Results and Discussion
3.1 Experimental results
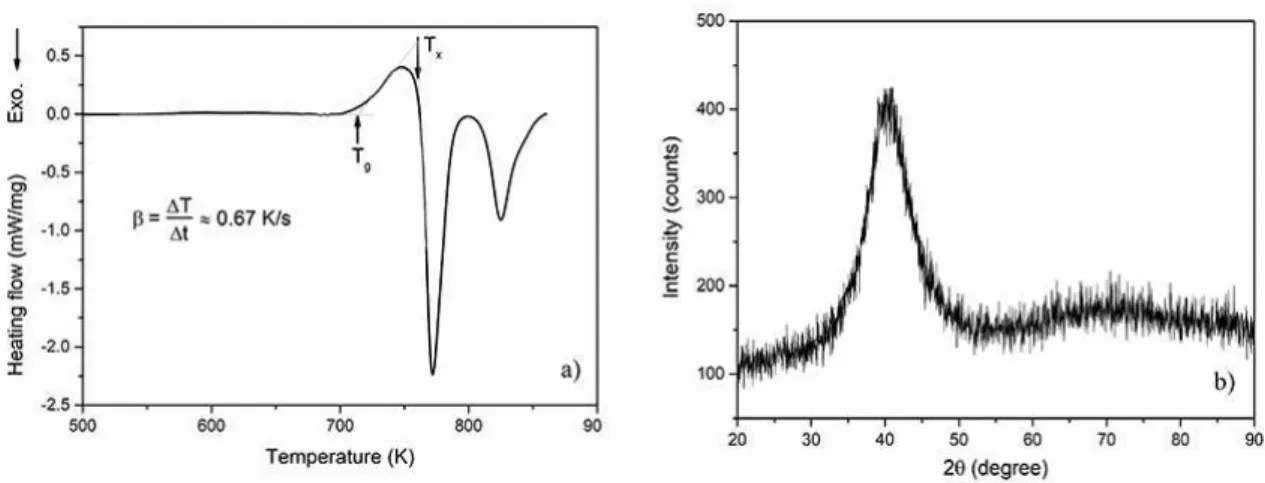
After the experimental quenching, melt-spun ribbons with about 3 mm width, 30 µm average thickness and some meter length were produced. Figure 1(a) displays the DSC curve of the amorphous ribbon carried out at a heating rate of 0.67 K/s. The thermogram starts with a straight line, then it shows a clear endothermic peak that is characteristic of glass transition (Tg = 715 K); followed by an exothermic event (at Tx = 762 K) corresponding to the onset of crystallization transition. The supercooled liquid region of this alloy corresponds to 46 K. Figure 1(b) presents the
E
F
r
r
2
1
ij
ij
tot
i j
i j
t
z
=
a ab+
ab=
=
Y
Y
XRD pattern of the amorphous ribbon. A large halo, typical of the amorphous structure without evidence of crystalline peaks, can be noted. The halo center of Cu60.0Zr32.5Ti7.5 alloy
is located at 2θ values of 40.40 degrees.
From the experimental results, it is observed that the studied alloy is completely amorphous. Thus, to get a better understanding about its GFA, the MD simulation was performed
at different cooling rates. These high cooling rates produce
essentially the same glassy structure. Probably the main
differences are the amount of free volume (less relaxed state)35
and the amount of icosahedral-like clusters36 and a higher
energetic state, which is more prone to present relaxation.
3.2 Simulated glass forming results
Figure 2 displays the evolution of Total Energy-Temperature (TE-T) curves of Cu60.0Zr32.5Ti7.5 alloy during heating-up and cooling-down steps to determine the phase transition temperatures. The melting temperature during the heating step and the glass transition temperatures during the cooling-down phase can be noted.
During the heating-up at a constant rate, the temperature increases from 300 to 2300 K, and the volume expands linearly until the onset temperature where the volume increases rapidly. This point indicates the beginning of the solid-liquid phase transition at a solidus temperature (Ts). The abrupt transition lasts until the liquidus temperature (Tl), beyond this temperature the relationship between volume and temperature becomes again linear. The following values 1498 K and 1565 K were obtained for Ts and Tl . MD was capable of modeling the correct behavior of this material as found in experimental studies, although the values of melting
temperature were not identical. Indeed, the experimental
temperature (Tl ≈ 1190 K)37 was smaller than the simulated one by almost 350 K. This difference can be explained by
the assumptions of simulation that consider a perfect crystal,
without surface effects or even defects. Moreover, when the
surface is suppressed by periodic boundary conditions, the
Figure 1. a) Experimental DSC thermogram of melt-spun ribbon obtained at a heating rate of 40 K/min. b) XRD for the same alloy with a halo near 40º
system can be superheated to temperatures higher than the equilibrium melting point at a higher heating rate.
During the cooling-down, the volume of the system decreases continuously as a function of temperature due to the high undercooling condition of liquid, avoiding the nucleation and growth of crystals. At glass transition temperature, the material becomes rigid and behaves like a solid, while preserving the amorphous atomic arrangement. The glass transition temperature, in this case, was determined
as the intersection of two straight lines, with different slopes
in the TE-T curve (Figure 2). This fact is similar to the second order thermodynamics phase transition. However, since Tg is dependent on the cooling rates, the kinetic is also
affected. Therefore, the higher cooling rate leads to higher
Tg value because the atoms have less time to relax, as shown in Figure 2. Cooling curves with the higher Tg temperature occur at cooling rates higher than 50 K/ps, for the present alloy. Also, the curves obtained at the cooling rates of 5 and 0.5 K/ps present only a small variation, indicating similar
behavior at different cooling rates. Nevertheless, some differences still exist, such as in the Tg value that is related to the cluster distribution and possibly to the level of free volume. Moreover, the change of Tg as a result of cooling rates usually does not exceed 5 K. For the cooling rate of 0.5 K/ps, the value obtained by this method to Tg was 705 K as observed in the inset of Figure 2.
According to the free-volume theory38, excess
free-volume in liquid can be trapped into the glassy state when quenching the liquid into a glass. The free-volume depends on the cooling rate. The sample cooled at 0.5 K/ps shows a relatively lower volume and energy, which indicates a more
closely packed structure in the final amorphous state. The
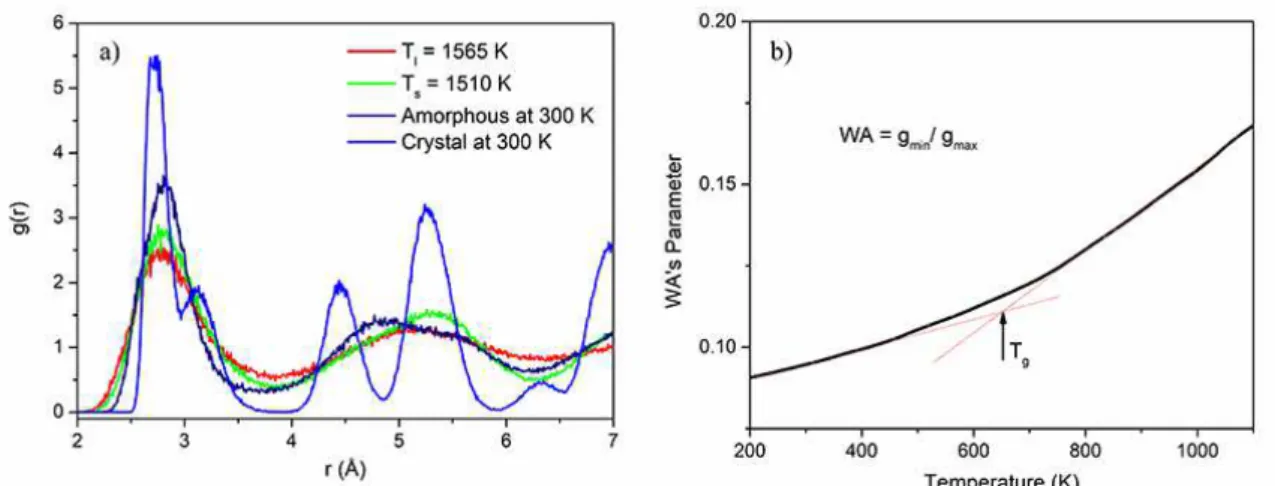
Figure 3. a) Total RDF curves obtained during heating to determine the liquidus and solidus temperatures and, during cooling-down at a cooling rate of 5 K/ps for the Cu60.0Zr32.5Ti7.5 alloy. b) WA parameter vs temperature obtained during the cooling down step.
Figure 2. Total Energy-Temperature curves for Cu60.0Zr32.5Ti7.5
alloy obtained at a heating rate of 5 K/ps and cooling rates of 0.5
and 5 K/ps respectively. In the inset, the curve of cooling down at
5 K/ps is depicted.
MD allows the obtaining of different properties of
materials. However, in several cases, it is necessary to
determine one physical parameter through different methods
to ensure a more reliable result. Comparing the values of Tg obtained experimentally and by MD, through the total
energy-temperature (TE-T) curve, a difference of less than
2 % can be noted: 715 K by experimental against 705 K of
TE-T curve. This small difference allows the evaluation of
Tg through the well-known Wendt-Abraham (WA) parameter (WA = gmin/gmax)39. In this relation, g
min represents the value of g(r) at the first minimum and gmax the value at the first
maximum of total Radial Distribution Function (RDF) or g(r) curve.
Figure 3(a) exhibits the plots of total RDF vs r(Å) curves
for different temperatures. The first RDF peak indicates the
average distance between the nearest neighboring atoms and
the unlike atoms, in this case the pair Cu−Zr. Also, the height of the first peak of g(r) increases when the liquid is cooling
down from 2300 to 300 K, which is evidence of the increase
in SRO in the first coordination shell of the supercooled
liquid. Figure 3(b) displays the WA parameter against temperature. The Tg was determined as the intersection point of two straight lines. The WA parameter emphasizes the local character of g(r)40. Hence, it is very useful for comparisons
among structures since it informs the precise estimation of Tg. Still, the 0.5 K/ps rate is closer to the experimental one; in the present study the 5 K/ps cooling rate was used to determine Tg. This rate presents fewer data points, allowing an easier analysis. The value obtained to Tg was 660 ±
50 K. This high uncertain value is due to the difficulty in
choosing a correct line at slow cooling rates However, its value is in good agreement with the others within a range of 50 K. Reduced glass-transition temperature (Trg) can be evaluated by dividing the glass transition temperature by liquidus temperature as Trg=Tg/Tl.
Several studies showed that GFA is related to the SRO
and the evolution of the shear viscosity (η) as a function of
temperature (T)41. It was proposed that the GFA is related to
the concentration of icosahedral polyhedron4,42. Nonetheless,
that assumption is not completely true because the fraction of icosahedral polyhedron inside the supercooled liquid and the amorphous phase also depends on the global alloy composition.
Figure 4 depicts the Angell plot (log(η) vs. 1/T curve)
for the Cu60.0Zr32.5Ti7.5 alloy in the temperature range of 1350 to 800 K. The liquid presents a relatively modest increase in viscosity when it is cooled from 1350 K to Tl. Still, further rapid cooling produces a supercooled liquid whose viscosity increases faster with decreasing temperature until it reaches Tg. In this work, the shear viscosity was calculated using
the Green-Kubo (GK) method43,44 at temperatures above
Tg from the simulated data obtained during the cooling process under a cooling rate of 5 K/ps. The viscosities
were evaluated at different temperatures higher than glass transition and were fitted using the Vogel-Fulcher-Tamman
(VFT) relationship45. The fragility was determined by using
log
m
d
T
T
d
g
T Tg
h
=
=
R
T Y
W
Figure 4. log(η) vs 1000/T curve for the Cu60.0Zr32.5Ti7.5 alloy. Fitting
was performed with the VFT equation. The dots are the simulated
conditions and line the fitting.
Figure 5. Schematic representation of evolution of cluster distribution at temperatures: a) 800, b) 700 and c) 300 K for Cu60.0Zr32.5Ti7.5 alloy.
Figure 6. Distribution of Icos, DIcos and FCC Voronoi polyhedron in the Cu60.0Zr32.5Ti7.5 amorphous alloy at 300 K. Colorful spheres: Cu-purple, Zr-green and Ti-blue.
(2)
According to the concept proposed by Angell46, the liquids can be classified within the "strong" and "fragile"
extremes using Tg as a scaling parameter36,47. The fragility
is a quantitative description of diverse kinetic behaviors,
and it quantifies the viscosity dependence on temperature.
Values of m for a metallic glass range from 15 to 20 showing a near fragile behavior.
3.3 Voronoi tessellation analysis
To establish the relationship between the atomic structures and the viscosity evolution, the local atomic structures
and their evolutions during cooling were analyzed. In the
Voronoi tessellation method, the index <n3,n4,n5,n6> are used; where ni represents the number of i-edged (i = 3,4,5,6,. . .) polygons that form a Voronoi polyhedron48-55. According
to Voronoi analysis, <0,0,12,0> is the perfect icosahedral
cluster (Icos). The index <0,2,8,2>, <0,2,8,1>, <0,3,6,3>,
<0,1,10,2>, <1,0,9,3>, <0,3,6,2>, <0,4,4,3> and <0,4,4,4>
are characteristic clusters of distorted icosahedral (DIcos)
Figure 7. Effect of temperature and strain rate on stress-strain
curves of Cu60.0Zr32.5Ti7.5 alloy.
<0,4,4,7> are associated with distorted FCC (Face Centered Cube) polyhedrons whereas the <0,12,0,0> corresponds to the perfect FCC. The index <0,6,0,8>, <0,3,6,1>, <0,2,8,4> and <0,5,4,4> correspond to the BCC (Body Centered Cube)-like cluster52-54.
We have calculated the Cu, Zr and Ti centered Voronoi index at three temperatures. The selected temperatures for the analysis are 50 K above and below the glass transition determined by the energy-temperature curve, respectively. The last temperature was the room temperature considered as being 300 K. Figure 5 gives the distribution of the 15 main clusters present in the Cu60.0Zr32.5Al7.5 alloy at 800,
700 and 300 K. It is possible to observe that in 800 K
(Figure 5(a)), when the material is in the undercooled liquid regime, just a few percent (33 %) of the atoms are building the Voronoi polyhedral. The presence of Cu-centered
Icosahedron polyhedron is about 2 %. Zr and Ti centered
were not observed. Below Tg, the material is in amorphous
solid state and changes its atomic configuration as shown
in Figure 5(b). At this temperature there are 54 % of the atoms building the Voronoi polyhedra, and the population
of DIcos is predominant. Furthermore, the Icos population increases one percent from 800 to 700 K. Its evolution in
cluster population continued slowly until reaching the room
temperature, where the DIcos population increased slightly and the Icos polyhedron reached its maximum population
of 4 % of the total Voronoi polyhedra (see Figure 5(c)). From the previous analysis, it was possible to track the evolution of clusters during quenching. However, to get a better understanding on the amorphous structure, not just the quantitative evaluation of polyhedra was considered but also its distribution inside the sample. To perform this analysis, only the most representative categories termed as
Icos (Icosahedral clusters), DIcos (Distorted Icosahedral
clusters) and FCC (Face Centered Cubic packing) polyhedron
were considered. Figure 6 displays the central atom of Icos, DIcos and FCC Voronoi polyhedra distributed inside the
amorphous phase at 300 K. In this result, Icos polyhedron
presents a homogeneous distribution with a great fraction of Cu-centered followed by a minor quantity of Zr-centered.
Ti-centered Icos polyhedrons were not observed. Under the
same conditions, there is a great population of Zr-centered
DIcos polyhedron with a minor fraction of Cu-centered and
just a very small fraction of Ti-centered clusters. On the other hand, the population of Zr and Cu-centered FCC-like
polyhedra is larger than DIcos and Icos. A greater fraction
of Ti-centered polyhedron was observed.
3.4 Simulated mechanical behavior
Figure 7 displays the tensile tests that were performed at two strain rates of 1x10⁹ and 1x10¹⁰ s-1 at 300 and 400 K. In the curves, the stress increases linearly with strain up to
0.05, indicating the range of elastic behavior of Cu60.0Zr32.5Ti7.5
glassy alloy. The temperature has weak influence on the deformation behavior. The strain rate, nevertheless, affects
strongly the tensile curve at 300 K. The Young modulus derived from the stress-strain slope at elastic region is about 48.8 GPa. At 300 K, as a function of the strain rate, there is a reduction of approximately 25 % in the ultimate strength at 1x10⁹ s-1 when compared to 1x10¹⁰ s-1. The elastic modulus
remained constant regardless of the strain rate. Moreover, it
is possible to observe a homogeneous flow stress beyond a
strain of 0.15 of about 1.5 GPa at temperatures of 300 and 400 K obtained at the strain rate of 1x10¹⁰ s-1. This value
decreases to about 1 GPa at rate of 1x10⁹ s-1. Experimentally,
it is known that depending on the temperature, the applied strain rate and the glass condition, local mechanistic events can be distributed homogeneously or inhomogeneously in time and space56. It is worth noting that in MD simulation
the sample size is usually small. Also the use of periodic
boundary conditions can affect the deformation mode, which
can be kept homogeneous for large deformations.
We also analyzed the evolution of the metallic glass structures as a function of strain, especially the evolution
of the Icos and DIcos polyhedron. As the strain increases
within the elastic deformation range, there is no change in the icosahedron fraction. Even beyond the elastic limit,
the change in Icos fraction is negligible. Agrawal57 found
a decrease in the icosahedral polyhedron population in the Cu60Zr35Ti5 alloy, contrary to our results. The stress-strain curves of Cu60.0Zr32.5Ti7.5 reveal that the deformation reaches the plastic regime. However, a stress drop (serrations) related to generation of shear bands in a monolithic amorphous alloy58 was not observed likely because of the homogeneous
deformation59. It is worthy to note that the shear bands mechanism
were proposed as the dominant plastic deformation mode in bulk MGs23,59. Moreover, the average thickness of the shear
bands are in 10 to 20 nm range29,57, and the thickness used in
this study is smaller than those values, similar to previous studies60. In addition, a recent study reported that even in a
Thus, despite the small chemical difference between
the alloys, especially in Zr and Ti contents, the mechanical
behavior is different and, consequently, the lack of shear bands in the current study is expected. It is worth noting
that the shear bands are normally present in the experimental tensile testing of metallic glasses, but their presence depends on joint factors such as strain rate and temperature for each alloy. Furthermore, it is well known that any localization of the strain beyond the atomic-scale occurs in homogeneous deformation. Following the Spaepen model, bulk metallic glass can be homogeneously deformed at room temperature under slow strain rate61. Nonetheless, recent works have
observed homogeneous deformation at room temperature under high stress54,62-65 Also, the observation of continuous plastic flow during atomic force microscopy indentation without
discontinuous events such as pop-in on the Pt57.5Cu14.7Ni5.3P22.5 metallic glass suggest that the inhomogeneous plastically deformation is in the range of micrometers scale.
4. Conclusions
In the current study, the melting and quenching processes
were simulated to produce an amorphous structure using
Molecular Dynamics simulations at different cooling rates.
A tenfold increase in the cooling rate had no apparent
effect on the short-range order of the final amorphous
state of Cu60.0Zr32.5Ti7.5 alloy. However, lower cooling rates led to a denser packing as well as a smaller volume and potential energy, while higher cooling rates produced a more free-volume of the amorphous structure.
The Voronoi tessellation analyses showed that the icosahedra-like structures formed around Cu and Zr
atoms. A significant amount of icosahedra-like structures
improved the glass forming ability by forming denser and more stable local clusters. Based on the simulated stress-strain curve, the Young modulus was determined as being approximate 49 GPa. Homogeneous deformation has been observed. Hence, the deformation mechanism of shear bands, typical of amorphous alloys, is probably not present in the investigated alloy.
5. Acknowledgments
The authors are thankful to the Brazilian financial supports
agencies CNPq-Brazil and FAPERJ - Rio de Janeiro.
6. References
1. Duwez P. A typical example of metastability: Metallic glasses.
Journal of Vacuum Science & Technology B. 1983;1(2):218-221.
2. Cheng YQ, Ma E. Atomic-level structure and structure-property relationship in metallic glasses. Progress in Materials Science. 2011;56(4):379-473.
3. Marx D. Theoretical chemistry in the 21st century: The "virtual
lab". In: Proceedings of the Idea - Finding Symposium: Frankfurt
Institute for Advanced Studies; 2003 Apr 15-17; Frankfurt,
Germany. p. 139-153.
4. Sheng HW, Luo WK, Alamgir FM, Bai JM, Ma E. Atomic packing and short-to-medium-range order in metallic glasses.
Nature. 2006;439(7075): 419-425.
5. Johnson WL. Bulk Glass-Forming Metallic Alloys: Science and Technology. MRS Bulletin. 1999;24(10):42-56.
6. Hays CC, Schroers J, Johnson WL. Vitrification and determination
of the crystallization time scales of the bulk-metallic-glass-forming liquid Zr58.5 Nb2.8 Cu15.6 Ni12.8 Al10.3. Applied Physics
Letters. 2001;79(11):1605-1607.
7. Zhang Y, Zhao DQ, Wei BC, Wen P, Pan MX, Wang WH. Formation and properties of Zr48Nb8Fe8Cu12Be24 bulk metallic glass. Journal of Materials Research. 2001;16(6):1675-1679.
8. Inoue A, Takeuchi A, Shen B. Formation and Functional Properties
of Fe-Based Bulk Glassy Alloys. Materials Transactions. 2001;42(6):970-978.
9. Griesche A, Macht MP, Garandet JP, Frohberg G. Diffusion
and viscosity in molten Pd40Ni40P20 and Pd40Cu30Ni10P20 alloys.
Journal of Non-Crystalline Solids. 2004;336(3):173-178.
10. Lu ZP, Goh TT, Li Y, Ng SC. Glass formation in La-based
La-Al-Ni-Cu-(Co) alloys by Bridgman solidification and their
glass forming ability. Acta Materialia. 1999;47(7):2215-2224.
11. Fan GJ, Löser W, Roth S, Eckert J, Schultz L. Glass-forming ability and magnetic properties of Nd70-xFe20Al10Cox alloys.
Journal of Materials Research. 2000;15(7):1556-1563.
12. Park ES, Ryu CW, Kim WT, Kim DH. A novel parameter to describe the glass-forming ability of alloys. Journal of Applied Physics. 2015;118(6):064902.
13. Wang D, Li Y, Sun BB, Sui ML, Lu K, Ma E. Bulk metallic glass formation in the binary Cu-Zr system. Applied Physics
Letters. 2004;84(20):4029-4031.
14. Yu CY, Liu XJ, Lu J, Zheng GP, Liu CT. First-principles prediction
and experimental verification of glass-forming ability in Zr-Cu
binary metallic glasses. Scientific Reports. 2013;3:2124.
15. Pauly S, Gorantla S, Wang G, Kühn U, Eckert J. Transformation-mediated ductility in CuZr-based bulk metallic glasses. Nature
Materials. 2010;9(6):473-477.
16. Yedla N, Srinivas M, Ghosh S, Majumdar B. Effect of
nano-crystallization on the plasticity in Cu-Zr amorphous binary alloys. Intermetallics. 2010;18(12):2419-2424.
17. Qin C, Zhang W, Kimura H, Asami K, Inoue A. New
Cu-Zr-Al-Nb Bulk Glassy Alloys with High Corrosion Resistance.
Materials Transactions. 2004;45(6):1958-1961.
18. Tam MK, Pang SJ, Shek CH. Effects of niobium on thermal
stability and corrosion behavior of glassy Cu-Zr-Al-Nb alloys.
Journal of Physics and Chemistry of Solids.
2006;67(4):762-766.
19. Inoue A, Zhang W, Zhang T, Kurosaka K. High-strength
20. Lee PY, Cheng YM, Chen JY, Hu CJ. Formation and Corrosion Behavior of Mechanically-Alloyed Cu-Zr-Ti Bulk Metallic Glasses. Metals. 2017;7(4):148.
21. Suryanarayana C, Inoue A. Bulk Metallic Glasses. Boca Raton: CRC Press; 2011.
22. Schuh CA, Hufnagel TC, Ramamurty U. Mechanical behavior of amorphous alloys. Acta Materialia. 2007;55(12):4067-4109.
23. Greer AL, Cheng YQ, Ma E. Shear bands in metallic glasses.
Materials Science and Engineering: R: Reports.
2013;74(4):71-132.
24. Argon AS. Plastic deformation in metallic glasses. Acta Metallurgica. 1979;27(1):47-58.
25. Falk ML, Langer JS. Dynamics and viscoplastic deformation in amorphous solids. Physical Review E. 1998;57(6):7192-7205.
26. Schuh CA, Lund AC. Atomistic basis for the plastic yield criterion of metallic glass. Nature Materials. 2003;2(7):449-452.
27. Yedla N, Pal S, Kumar A. Mechanical Behaviour of Cu-Zr-Al Glassy Nano-Wires. Journal of Computational and Theoretical
Nanoscience. 2015;12(10):2332-2338.
28. Yedla N, Ghosh S. Nature of atomic trajectories and convective
flow during plastic deformation of amorphous Cu50Zr50 alloy
at room temperature-classical molecular dynamics studies.
Intermetallics. 2017;80:40-47.
29. Li QK, Li M. Assessing the critical sizes for shear band formation in metallic glasses from molecular dynamics simulation. Applied
Physics Letters. 2007;91(23):231905.
30. Caron A, Bennewitz R. Lower nanometer-scale size limit for the deformation of a metallic glass by shear transformations revealed by quantitative AFM indentation. Beilstein Journal
of Nanotechnology. 2015;6:1721-1732.
31. Plimpton S. Computational limits of classical molecular dynamics simulations. Computational Materials Science. 1995;4(4):361-364.
32. Finnis MW, Sinclair JE. A simple empirical N-body potential for transition metals. Philosophical Magazine A. 1984;50(1):45-55.
33. Stukowski A. Visualization and analysis of atomistic simulation
data with OVITO-The Open Visualization Tool. Modelling
and Simulation in Materials Science and Engineering.
2009;18(1):015012.
34. Ward L, Agrawal A, Flores KM, Windl W. Rapid Production of Accurate Embedded-Atom Method Potentials for Metal Alloys. arXiv. 2012;1209.0619v1.
35. Raghavan R, Murali P, Ramamurty U. Influence of Cooling Rate
on the Enthalpy Relaxation and Fragility of a Metallic Glass.
Metallurgical and Materials Transactions A. 2008;39(7):1573-1577.
36. Hu YC, Li FX, Li MZ, Bai HY, Wang WH. Five-fold symmetry as indicator of dynamic arrest in metallic glass-forming liquids.
Nature Communications. 2015;6:8310.
37. Ge L, Hui X, Wang ER, Chen GL, Arroyave R, Liu ZK. Prediction of the glass forming ability in Cu-Zr binary and Cu-Zr-Ti ternary alloys. Intermetallics. 2008;16(1):27-33.
38. Cohen MH, Grest GS. Liquid-glass transition, a free-volume approach. Physical Review B. 1976;20(3):1077.
39. Wendt H, Abraham FF. Empirical Criterion for the Glass Transition Region Based on Monte Carlo Simulations. Physical
Review Letters. 1978;41(18):1244.
40. Shrivastava A, Khandpekar M, Dometti SG, Mohape M, Deshmukh V. Molecular dynamics study of the structural and dynamical properties of binary Cu50Zr50 bulk metallic glass.
Advances in Applied Science Research. 2015;6(7):74-80.
41. Zhang Y, Mattern N, Eckert J. Study of direct relationship between atomic structures and glass forming abilities of Cu100-x Zrx (0<x<10) liquids by molecular dynamics simulations.
Journal of Applied Physics. 2012;111(5):053520.
42. Luo WK, Sheng HW, Alamgir FM, Bai JM, He JH, Ma E.
Icosahedral short-range order in amorphous alloys. Physical
Review Letters. 2004;92(14):145502.
43. Green MS. Markoff Random Processes and the Statistical Mechanics of Time-Dependent Phenomena. II. Irreversible Processes in fluids. The Journal of Chemical Physics. 1954;22(3):398-413.
44. Kubo R. Statistical-Mechanical Theory of Irreversible Processes. I. General Theory and Simple Applications to Magnetic and
Conduction Problems. Journal of the Physical Society of Japan. 1957;12(6):570-586.
45. Böhmer R, Ngai K, Angell CA, Plazek D. Nonexponential relaxations in strong and fragile glass formers. The Journal of
Chemical Physics. 1993;99(5):4201-4209.
46. Angell CA. Formation of Glasses from Liquids and Biopolymers.
Science. 1995;267(5206):1924-1935.
47. Angell CA. Perspective on the glass transition. Journal of
Physics and Chemistry of Solids. 1988;49(8):863-871.
48. Finney JL. Random packings and the structure of simple
liquids. I. The geometry of random close packing. Proceedings
of the Royal Society of London A: Mathematical, Physical and
Engineering Sciences. 1970;319(1539):479-493.
49. Tanemura M, Ogawa T, Ogita N. A new algorithm for three-dimensional Voronoi tessellation. Journal of Computational
Physics. 1983;51(2):191-207.
50. Aurenhammer F. Voronoi diagrams-a survey of a fundamental geometric data structure. ACM Computing Surveys (CSUR). 1991;23(3):345-405.
51. Brostow W, Chybicki M, Laskowski R, Rybicki J. Voronoi polyhedra and Delaunay simplexes in the structural analysis of molecular-dynamics-simulated materials. Physical Review B. 1998;57(21):13448-13458.
52. Cape JN, Finney JL, Woodcock LV. An analysis of crystallization by homogeneous nucleation in a 4000-atom soft-sphere model.
The Journal of Chemical Physics. 1981;75(5):2366-2373.
53. Yamamoto R, Doyama M. The polyhedron and cavity analyses of a structural model of amorphous iron. Journal of Physics F:
Metal Physics. 1979;9(4):617.
54. Tanaka M. Statistics of Voronoi Polyhedra in Rapidly Quenched
Monatomic Liquids I. Changes During Rapid-Quenching Process.
Journal of the Physical Society of Japan. 1986;55(9):3108-3116.
56. Sun BA, Wang WH. The fracture of bulk metallic glasses.
Progress in Materials Science. 2015;74:211-307.
57. Agrawal A. Computational Study of Vanadate and Bulk Metallic
Glasses. [Dissertation]. Columbus: The Ohio State University; 2012.
58. Zhang Y, Zuo TT, Tang Z, Gao MC, Dahmen KA, Liaw PK, et al. Microstructure and properties of high entropy alloys.
Progress in Materials Science. 2014;61:1-93.
59. Nieh TG, Wadsworth J. Homogeneous deformation of bulk metallic glasses. Scripta Materialia. 2006;54(3):387-392.
60. Lee M, Lee CM, Lee KR, Ma E, Lee JC. Networked interpenetrating
connections of icosahedra: Effects on shear transformations in
metallic glass. Acta Materialia. 2011;59(1):159-170.
61. Spaepen F. A microscopic mechanism for steady state
inhomogeneous flow in metallic glasses. Acta Metallurgica. 1977;25(4):407-415.
62. Zhang B, Zhao DQ, Pan MX, Wang WH, Greer AL. Amorphous metallic plastic. Physical Review Letters. 2005;94(20):205502.
63. Ke HB, Wen P, Peng HL, Wang WH, Greer AL. Homogeneous deformation of metallic glass at room temperature reveals large dilation. Scripta Materialia. 2011;64(10):966-969.
64. Zhao K, Xia XX, Bai HY, Zhao DQ, Wang WH. Room
temperature homogeneous flow in a bulk metallic glass with low
glass transition. Applied Physics Letters. 2011;98(14):141913.
65. Egami T, Iwashita T, Dmowski W. Mechanical properties of