Article
Printed in Brazil - ©2018 Sociedade Brasileira de Química
*e-mail: lucianoliao@ufg.br
HR-MAS NMR Allied to Chemometric on
Hancornia speciosa
Varieties
Differentiation
Igor S. Flores,a Andressa K. Silva,b Leonnardo C. Furquim,c Carlos F. S. Castro,d
Lazaro J. Chaves,e Rosane G. Collevattif and Luciano M. Lião*,b
aInstituto Federal de Goiás, R. São Bartolomeu, s/n, Vila Esperança,
72811-580 Luziânia-GO, Brazil
bInstituto de Química, Universidade Federal de Goiás, Av. Esperança, s/n,
Campus Samambaia, 74690-900 Goiânia-GO, Brazil
cFaculdade Objetivo, Rua 12 de Outubro, Quadra 64, Lote 02, Jardim Adriana,
75906-577 Rio Verde-GO, Brazil
dInstituto Federal de Educação, Ciência e Tecnologia Goiano, Rod. Sul Goiana, km 01,
Zona Rural, CP 66, 75901-970 Rio Verde-GO, Brazil
eEscola de Agronomia and fInstituto de Ciências Biológicas, Universidade Federal de Goiás,
Campus Samambaia, CP 131, 74690-900 Goiânia-GO, Brazil
This work describes the potential of chemometric analyses applied to 1H high-resolution magic
angle spinning nuclear magnetic resonance (1H HR-MAS NMR) data for the chemotaxonomic
investigation of Hancornia speciosa (Apocynaceae) varieties. This plant, popularly known as mangaba, has a complex morphological differentiation and thus chemical analyses can be used for their taxonomic classification. In comparison to traditional techniques, 1H HR-MAS NMR
allied with chemometrics provided a simple and low cost method for chemotaxonomy. Leaves of four varieties of H. speciosa from a common garden experiment was studied and demonstrated that H. speciosa var. speciosa differs from others due to its specific metabolic profile, and var. pubescens was discriminated based on its high phenolic compound content. The distinction between the latter variety and gardineri is important once it allows for the selection of samples with greater commercial value, once they produce the largest and heaviest fruits.
Keywords: Apocynaceae, Hancornia speciosa, chemotaxonomy, HR-MAS NMR, chemometrics/statistics
Introduction
The species Hancornia speciosa Gomes(Apocynaceae), popularly known as mangabeira or mangaba, is widely distributed throughout Brazil.1 Although it is important
in the production of latex, its fruit has also been explored for other uses, especially by the pulp, juice and ice cream industries.2,3 The species presents variation in
morphological leaf traits according to geographical origin and varieties,4 although with sympatric varieties and
individuals with intermediate phenotypes.5 H. speciosa
var. speciosa (Gomes) has small leaves with long petiole and occurs from the Northeast towards the Middle-West
and North Brazil. On the other hand, var. maximilliani (A. DC.) occurs in Southeast Brazil and also has small leaves with long petiole. The var. lundii (A. DC.) also occurs in Southeast Brazil and has medium leaves and short petiole. H. speciosa var. cuyabensis (Malme) occurs in Middle-West Brazil and has medium leaves and short petiole. The varieties gardneri (A. DC. Muell. Arg.) and
pubescens (Nees & Martius) Muell. Arg. occur in Middle-West Brazil and have large leaves and short petiole, although the last one has pubescent leaves. The species also has great variation among populations in fruit size, color and production.6 The sympatric distribution of varieties,
In folk medicine, the bark of H. speciosa is used in an infusion form for the treatment of gastric ulcers, hypertension, inflammatory diseases and stomach disturbances.7,8 In addition, the species is also used to
control diabetes, dermatitis, hepatic and pulmonary disease, tuberculosis and weight loss.9-12 Phytochemical
analyses describes cyclic polyol bornesitol and phenolic acids, such as ferulic, gallic, p-coumaric, protocatechuic, vanillic, quinic and chlorogenic acids; flavonoids, such as rutin, kaempferol di- and triglycoside; triterpenes and steroids; as well as a homologous series of B-type proanthocyanidins and their respective C-glycosylated derivatives, with a degree of polymerization ranging from 1 to 6 units of interlinked catechins.12-16 However,
to the best of our knowledge no chemical profile study has yet been performed comparing the different varieties of H. speciosa.
The metabolic profile of plants is usually characterized by techniques that separate the chemical compounds, often involving time and chemical consuming and laborious sample pre-treatment. In this context, the present work aims on the application of 1H high-resolution magic angle
spinning nuclear magnetic resonance (HR-MAS NMR) associated with chemometric analysis to provide a fast and secure way to evaluate the chemotaxonomy of H. speciosa varieties. In this way, four varieties of H. speciosa from a germplasm collection: var. speciosa, cuyabensis,
gardneri and pubescens, were analyzed. HR-MAS is generally employed as a fast tool to detect some of the major metabolites of a heterogeneous matrix (i.e., gel like systems), swollen in a specific solvent in order to improve molecular mobility. Importantly, no extraction process is necessary, thereby minimizing chemical reactions with solvent, which can occur in traditional extraction methods.17-21
Experimental
Plant materials
Fruits of H. speciosa were collected over a period of two months in the Cerrado biome, covering the states of Goiás, Tocantins, Mato Grosso, Mato Grosso do Sul, Minas Gerais, and Bahia. The prime trees, found in their respective places of occurrence, were selected based on their phytosanitary characteristics and the availability of fruits for collection. The collected fruits were then used to produce a germplasm collection at Federal University of Goiás, Goiânia City, Brazil (16°35’12”S, 49°21’14”W, elevation 730 m), to avoid environmental influence in metabolic profiling.
The collection was planted in 2005 in a completely randomized block design and consists of open-pollinated progenies from 109 plant matrices sampled in 32 populations.5 The collection has now 274 adult
individuals regarding four varieties of H. speciosa: var.
pubescens (65 individuals), var. gardineri (159), var.
speciosa (21), and var. cuyabensis (29). Then, leaf samples obtained from 70 adult individuals regarding the four varieties (Table 1) were submitted to NMR analysis.
NMR analyses
All NMR spectra were acquired on a Bruker Avance III 500 spectrometer operating at 11.75 Tesla, observing 1H
at 500.13 MHz, equipped with a 4 mm four channel (1H, 2H, 13C and 31P) HR-MAS probe. The H. speciosa leaves,
previously dried for three days at room temperature, were powdered without the addition of liquid nitrogen, avoiding water condensation after grinding, and sieved through a 1 mm mesh. The powdered leaves (12 mg) were then transferred into a 50 µL HR-MAS zirconium rotor followed by 40 µL of CD3OD (0.05% v/v tetramethylsilane (TMS))
and it was waited one hour for sample swelling. Samples were spun at 5 kHz at magic angle (54.74°) and the spectra were acquired at 25 °C in triplicate, using Carr-Purcell-Meiboom-Gill (CPMG) water presaturation (cpmgpr1d Bruker) pulse sequence ([RD(CW)-90°x-(τ-180°y-τ)n-FID])
with 128 cycles. During all RD (recycle delay) the water frequency was selectively irradiated. The delay between 180-degree pulses (τ) and number of cycles (n) were optimized varying in: 1.0, 1.5 and 2.0 ms for τ, and 128, 256 and 512 cycles for n. Receiver gain was adjusted automatically and shimming manually before each acquisition. Typically, 128 free induction decays (FID) were collected into 117 K data points distributed in a 10,000 Hz spectral width, with a relaxation delay of 3 s and an acquisition time of 6.0 s. The standard inversion-recovery approach was used for measuring longitudinal relaxation time (T1) and the recycle delay was set up to
5 times the longest T1 determined. Spectra were processed
by application of an exponential multiplication of FID by a factor of 0.4 Hz followed by Fourier transform, without zero-filling.
Chemometric analysis
The 1H NMR data were submitted to chemometric analysis
using OCTAVE software (version 4.2).22 Savitzky-Golay
normalization was also carried out to minimize discrepancies arising from the homogeneity of the magnetic field. Principal component analysis (PCA) was performed with and without selection of variables, mean-centering and auto-scaling, and evaluated based on similarity according to variety, location and family; regions concerning water suppression, deuterated solvent signal and spectral noise were removed. We also performed hierarchical analysis of clusters (HCA) to visualize the degree of similarity between samples, using the same software as above.
Results and Discussion
The pulse sequences zgcppr ([RD(CW)-90°x-90°y-90°-x
-90°-y-FID]), cpmgpr1d ([RD(CW)-90°x-(τ-180°y-τ)n-FID]),
noesygppr1d ([RD(CW)-90°-90°-tm(CW)-90°-FID])
using spoil gradient, where tm is the mixing time of 100 µs
in which the water resonance was also irradiated, were evaluated for suppression of the water hydrogen signal. The more informative spectra (i.e., presented higher signal-to-noise relationship, and lower signal overlapping) were achieved with the aid of cpmgpr1d pulse sequence. The advantage of this pulse sequence is the suppression
of broad signals typical of complex samples, as natural samples in general, generated by macromolecule due to its very fast spin relaxation. Thus, elimination of these signals provides clearer spectra with less distortion at the baseline, making spectra more informative (Figure 1). A similar case in which this pulse sequence was used and good chemotaxonomic analysis results were achieved was reported by Alcantara et al.17
Average sample spectra for each H. speciosa variety (speciosa, cuyabensis, gardineri and pubescens) were generated and overlapped in an attempt to reveal the differences in the chemical composition (Figure 2a). Analysis of this figure reveals appreciable similarities between the four varieties, with differences observed only for var. speciosa in the regions of aromatic compounds (d 6.0 to 9.0) and carbohydrates (d 3.0 to 5.0), as well as a little more pronounced at d 1.6 and 2.0. Variety speciosa shows reduced signal intensity in these regions, which indicates lower amounts of the respective compounds in this variety than in the other three. Thus, only the regions in which these signals were contained were selected for PCA analysis (Figure 2b). This result demonstrates that visual analysis of average
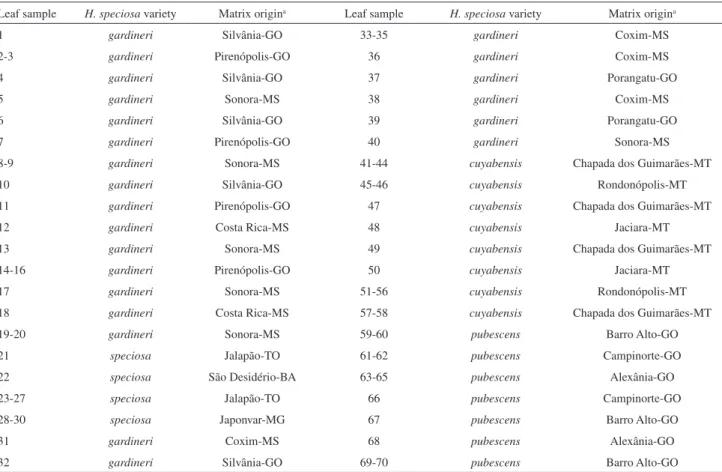
Table 1. Samples varieties from Hancornia speciosa used in this investigation
Leaf sample H. speciosa variety Matrix origina Leaf sample H. speciosa variety Matrix origina
1 gardineri Silvânia-GO 33-35 gardineri Coxim-MS
2-3 gardineri Pirenópolis-GO 36 gardineri Coxim-MS
4 gardineri Silvânia-GO 37 gardineri Porangatu-GO
5 gardineri Sonora-MS 38 gardineri Coxim-MS
6 gardineri Silvânia-GO 39 gardineri Porangatu-GO
7 gardineri Pirenópolis-GO 40 gardineri Sonora-MS
8-9 gardineri Sonora-MS 41-44 cuyabensis Chapada dos Guimarães-MT
10 gardineri Silvânia-GO 45-46 cuyabensis Rondonópolis-MT
11 gardineri Pirenópolis-GO 47 cuyabensis Chapada dos Guimarães-MT
12 gardineri Costa Rica-MS 48 cuyabensis Jaciara-MT
13 gardineri Sonora-MS 49 cuyabensis Chapada dos Guimarães-MT
14-16 gardineri Pirenópolis-GO 50 cuyabensis Jaciara-MT
17 gardineri Sonora-MS 51-56 cuyabensis Rondonópolis-MT
18 gardineri Costa Rica-MS 57-58 cuyabensis Chapada dos Guimarães-MT
19-20 gardineri Sonora-MS 59-60 pubescens Barro Alto-GO
21 speciosa Jalapão-TO 61-62 pubescens Campinorte-GO
22 speciosa São Desidério-BA 63-65 pubescens Alexânia-GO
23-27 speciosa Jalapão-TO 66 pubescens Campinorte-GO
28-30 speciosa Japonvar-MG 67 pubescens Barro Alto-GO
31 gardineri Coxim-MS 68 pubescens Alexânia-GO
32 gardineri Silvânia-GO 69-70 pubescens Barro Alto-GO
spectra can subsidize the selection of variables for pattern recognition in samples of interest, in this case
H. speciosa var. speciosa.
Among the most important components present in
H. speciosa are the phenolic compounds, which are responsible for the medicinal properties of this plant.12 For
this reason, only signals present in the region associated with these compounds were selected to identify the variety of mangaba most reflecting this characteristic. When phenolic region were selected for chemometric analysis, a polarization of samples of H. speciosa var. pubescens in relation to the other three varieties under study was observed (Figure 3). Almost all tested individuals of this variety exhibit negative scores for both PCs, particularly when considering the first components, which accounts for over eighty percent of original data variance in this region. This result emphasizes the chemical differentiation of the four mangaba varieties, with H. speciosa var. pubescens containing the highest amount of phenolic compounds.
Examination of the PC1 and PC2 loadings of
1H HR-MAS NMR data suggests that this separation occurs
due to the signals typical of aromatic compounds. These signals could be assigned to the flavonoid rutin on basis of the doublets at d7.67 (J = 2.1 Hz) and 6.90 (J = 8.5 Hz), and a double doublet at d7.64 (J = 8.5 and 2.1 Hz),24 as
well as one-bond and long-range 1H-13C correlation from
heteronuclear single quantum correlation (HSQC) and heteronuclear multiple bond correlation (HMBC) NMR experiments.
Figure 1. Representative 1H HR-MAS NMR spectra from Hancornia speciosa leaves acquired with different pulse sequences: zg30 ([RD-30°-FID]),
cpmgpr1d ([RD(CW)-90°x-(τ-180°y-τ)n-FID]), noesygppr1d ([RD(CW)-90°-90°-tm(CW)-90°-FID]).
Figure 2. (a) Average 1H HR-MAS NMR spectra of Hancornia speciosa
No clusters were observed among varieties considering carbohydrates and saturated hydrocarbon signals. However, the carbinolic hydrogen signal at d 3.5 suggests the presence of β-sitosterol, as supported by that of olefinic hydrogen at d5.3, while the presence of 3-β-O-acyl lupeol is suggested by the signals at d 1.6 and 1.7.25 On the other
hand, H.speciosa var. speciosa is distinguished by its lower contents of this compound, as can be observed in Figure 2.
Sample separation according to variety was also determined based on all 1H HR-MAS NMR spectral
information (i.e., full 1H NMR spectra) (Figure 4). H. speciosa var. pubescens is better discriminated due to chemical differentiation in the phenolic hydrogen region.
H. speciosa var. cuyabensis presents certain chemical characteristics similar to those of var. gardineri and var.
speciosa, although the latter two varieties are very different from each other.
The two sympatric varieties, H. speciosa var. gardineri and var. pubescens, can be discriminated based on their association with positive values of PC2 and negative
Figure 3. (a) 1H HR-MAS NMR spectra of four varieties of Hancornia speciosa leaves, highlighting the phenolic compounds region; (b) PCA score plots
with selection of variables (phenolics) and mean-centered data. The H. speciosa var. pubescens samples are highlighted.
Figure 4. PCA score plot (PC1 versus PC2) obtained from 1H NMR data for Hancornia speciosa varieties. The map insert shows the geographical origin
values of PC1, respectively. According to loading plots, while samples of H. speciosa var. pubescens are separated from the other varieties mainly due to their higher phenolic compound content, samples of var. gardineri are distinguished by their hydrocarbon and carbohydrate signals. Resonances at d2.6 and 2.8, in addition to lower contents of phenolic and carbohydrate compounds, are responsible for the location of the H. speciosa var. speciosa samples at positive PC1 and negative PC2 scores. Finally, the var. cuyabensis samples are located near the origin of the two components.
HCA analyses were then performed using all
1H HR-MAS NMR spectral information, based on
previously smoothed and normalized data. PCA data were
Figure 5. HCA plot obtained from 1H HR-MAS NMR spectral data for Hancornia speciosa varieties (similarity index: 0.377).
Figure 6. PCA score plot (PC1 versus PC2) obtained from 1H HR-MAS NMR data for Hancornia speciosa varieties. Prime samples were collected in six
Brazilian states, as represented by the different colors.
not employed, with the k-means method used for distance calculation. Taking information for all compound classes into account, the major distances were observed between
H. speciosa var. speciosa and var. pubescens (Figure 5). On the other hand, H. speciosa var. cuyabensis and var.
gardineri showed to have more similarity.
Conclusions
This work shows that the chemotaxonomic differentiation of Hancornia speciosa varieties is possible on the basis of chemometric analyses of 1H HR-MAS NMR spectral data. H. speciosa shows high levels of phenotypic variation among populations in leaf and fruit characters which make it difficult to identify individual varieties, thus our study may contribute to the identification of varieties, which is highly important for breeding programs and genetic resources conservation. H. speciosa var. speciosa variety is distinct from the three others under study because it exhibits higher chemical differentiation, while var. pubescens can be identified based on its higher levels of phenolic compounds. Perfect distinction between the latter variety and var.
gardineri is important once they are sympatric and it would enable the selection of samples with greater commercial value.Moreover, the results showed the influence of plant origin in plant chemical composition. The difference in chemical composition was not due to environment because it used leaf samples from a common garden experiment, thus all variation might be due to genetic differentiation or maternal effect in varieties.
Acknowledgments
This work was supported by grants to the research network GENPAC10 (CNPq/MCT/CAPES/FAPEG project No. 564717/2010-0, 563624/2010-8), the network Rede Cerrado PPBio (CNPq project No. 457406/2012-7) and the network Rede Pró-Centro-Oeste (MCTI/CNPq/FNDCT project No. 407181/2013-0). The authors are also grateful to FINEP, FAPEG, CNPq and CAPES for the continuous financial support and scholarships.
References
1. Lorenzi, H.; Árvores Brasileiras: Manual de Identificação de Plantas Nativas do Brasil, 1a ed.; Plantarum: Nova Odessa,
1992.
2. Soares, F. P.; Paiva, R.; Alvarenga, A. A.; Nogueira, R. C.; Emrich, E. B.; Martinotto, C.; Ciênc. Agrotec. 2007, 31, 1048.
3. da Rosa, M. E. C.; Naves, R. V.; de Oliveira Júnior, J. P.; Pesq. Agropec. Trop. 2005, 35, 65.
4. Monachino, J.; Lilloa 1945, 11, 19.
5. Collevatti, R. G.; Olivatti, A. M.; Telles, M. P. C.; Chaves, L. J.; Tree Genet. Genomes 2016, 12, 74.
6. Ganga, R. M. D.; Ferreira, G. A.; Chaves, L. J.; Naves, R. V.; Nascimento, J. L.; Rev. Bras. Frutic. 2010, 32, 101.
7. Almeida, S. P.; Proença, C. E. B.; Sano, S. M.; Ribeiro, J. F.; Cerrado: Espécies Vegetais Úteis; EMBRAPA: Planaltina, DF, 1998.
8. Silva, G. C.; Braga, F. C.; Lemos, V. S.; Cortes, S. F.; Phytomedicine 2016, 23, 214.
9. Hirschmann, G. S.; Arias, A. R.; J. Ethnopharmacol. 1990, 29,
159.
10. Pott, A.; Pott, V. J.; Plantas do Pantanal; EMBRAPA: Planaltina, DF,1994.
11. Mors, W. B.; Rizzini, C. T.; Pereira, N. A.; Medicinal Plants of Brazil (Medicinal Plants of the World); DeFilipps, R. A., ed.; Reference Publications: Michigan, 2000.
12. Pereira, A. C.; Pereira, A. B. D.; Moreira, C. C. L.; Botion, L. M.; Lemos, V. S.; Braga, F. C.; Cortes, S. F.; J. Ethnopharmacol.
2015, 161, 30.
13. Endringer, D. C.; Pezzuto, J. M.; Braga, F. C.; Phytomedicine
2009, 16, 1064.
14. Neves, J. S.; Franchin, M.; Rosalen, P. L.; Omar, N. F.; dos Santos, M. A.; Paschoal, J. A. R.; Novaes, P. D.; J. Ethnopharmacol. 2016, 183, 151.
15. Gomes, E. B.; Ramalho, S. R.; Gualberto, N. C.; Miranda, R. C. M.; Nigam, N.; Norain, N.; J. Anal. Sci., Methods Instrum.
2013,3, article ID 37131.
16. Rodrigues, C. M.; Rinaldo, D.; dos Santos, L. C.; Montoro, P.; Piacente, S.; Pizza, C.; Hiruma-Lima, C. A.; Brito, A. R. M. S.; Vilegas, W.; Rapid Commun. Mass Spectrom. 2007, 21, 1907.
17. Alcantara, G. B.; Honda, N. K.; Ferreira, M. M. C.; Ferreira, A. G.; Anal. Chim. Acta 2007, 595, 3.
18. Lião, L. M.; Choze, R.; Cavalcante, P. P. A.; Santos, S. C.; Ferri, P. H.; Ferreira, A. G.; Quim. Nova 2010, 33, 634.
19. Santos, A. D. C.; Fonseca, F. A.; Lião, L. M.; Alcantara, G. B.; Barison, A.; Trends Anal. Chem. 2015, 73, 10.
20. Choze, R.; Alcantara, G. B.; Alves-Filho, E. G.; Silva, L. M. A.; Faria, J. C.; Lião, L. M.; Food Chem. 2013, 141, 2841.
21. Santos, A. D. C.; Fonseca, F. A.; Dutra, L. M.; Santos, M. F. C.; Menezes, L. R. A.; Campos, F. R.; Nagata, N.; Ayub, R.; Barison, A.; Food Chem. 2018, 239, 511.
22. https://octave.en.softonic.com/?ex=DSK-309.0, accessed in August 2017.
23. Boelens, H. F. M.; Eilers, P. H. C.; Hankemeler, T.; Anal. Chem.
2005, 77, 7998.
24. Buszewski, B.; Kawka, S.; Suprynowicz, Z.; Wolski, T.; J. Pharm. Biomed. Anal. 1993, 11, 211.
25. Carvalho, M. G.; Velloso, C. R. X.; Braz-Filho, R.; Costa, W. F.; J. Braz. Chem. Soc. 2001,12, 556.
Submitted: August 9, 2017 Published online: October 25, 2017
![Figure 1. Representative 1 H HR-MAS NMR spectra from Hancornia speciosa leaves acquired with different pulse sequences: zg30 ([RD-30°-FID]), cpmgpr1d ([RD(CW)-90° x -(τ-180° y -τ) n -FID]), noesygppr1d ([RD(CW)-90°-90°-t m (CW)-90°-FID]).](https://thumb-eu.123doks.com/thumbv2/123dok_br/16169526.707655/4.892.188.732.104.540/figure-representative-hancornia-speciosa-acquired-different-sequences-noesygppr.webp)


