Educação
*e-mail: nmon@uesb.edu.br
AN APPROACH TO THE KINETICS AND THERMODYNAMICS OF ELEMENTARY CHEMICAL REACTIONS USING A STOCHASTIC MODEL
Francis Pereira Nascimento, Baraquízio Braga do Nascimento Junior,Luiz Augusto Martins Cardoso, Rodrigo Veiga Tenório de Albuquerque and Nemesio Matos Oliveira-Neto*
Departamento de Ciências e Tecnologias (DCT), Universidade Estadual do Sudoeste da Bahia, 45208-409 Jequié – BA, Brasil
Recebido em 16/11/2017; aceito em 12/04/2018; publicado na web em 22/05/2018
A mathematical model is proposed to investigate the kinetics and equilibrium of homogeneous elementary first- and second-order chemical reactions. The dynamics is defined by the Monte Carlo method (MCM), with the Metropolis update, and the Ehrenfest urn model (EUM). MCM is an important step that accesses the kinetic and thermodynamic properties of the system, while the EUM defines the orders of the reactions studied in this work. The main parameters, such as temperature, the activation energy and the steric factor, were taken into account in the calculation of the transition probabilities between the reactants and products. It is thus possible to reproduce the kinetic profiles of the reactions and to evaluate the influence of temperature and the steric factor. Furthermore, it is possible to simulate the behaviour of the system by modifying the activation energy barrier, thus simulating a catalytic process. The effect of the addition of molecules was also investigated, with the system returning to a thermodynamic equilibrium condition after partial consumption of the added reactant, as predicted by Le Chatelier’s principle. All the simulated data are in agreement with the theoretical results present in physical chemistry textbooks.
Keywords:chemical reaction;kinetics;thermodynamics; Monte Carlo method; Ehrenfest urn model.
INTRODUCTION
Since John Dewy recommended the inclusion of inquiry in the K-12 science curriculum in 1910, science education has undergone several modifications and adaptations around the world.1,2 Inquiry, from a teaching perspective, can be viewed as teaching where the students are actively, instead of passively, engaged in their learning process, with the teacher serving as a mediator. In this active learning environment, the activities and discussion are focused on the students, with more emphasis given on process skills, investigative activities of science questions, public communications and working as a member of a team. The practical activities thus represent a natural and important teaching strategy, particularly the use of computer simulations.3 Since the advent of computers, numerous efforts have been made to employ computers in the classroom. Teaching modules in chemical kinetics have used stochastic methods, such as the Monte Carlo method (MCM), to study chemical reactions.4–17
Stochastic methods offer a number of advantages. First, due to the lack of infrastructure at some school laboratories and universities, certain important topics in physical chemistry are either neglected or only treated theoretically. Another advantage of such numerical approaches is that it is not always possible to achieve the necessary high pressure and temperature regimes of some chemical reactions in the laboratory. Also, from a theoretical point of view, it is not always possible to analytically solve the system of ordinary differential equations that describe a chemical reaction due to its complexity.12,13
A simple stochastic approach based on MCM and the Ehrenfest urn model (EUM)12 is proposed here to overcome some of the difficulties associated with teaching chemistry by simulating the chemical kinetics of elementary reactions. This hybrid model takes into account the main kinetics parameters, such as temperature and activation energy, thus making it is possible to obtain features in chemical kinetics.
EXPERIMENTAL
Mathematical model
The standard MCM,18 defined via the Metropolis update, is applied. Here the transition probability functions depend on the energy barrier (activation energy), temperature and steric factor.11,12,19 Thus, when considering the elementary reaction between two species A ⇄ B, the transition probabilities, Pf and Pr, for the forward and reverse reactions are defined as follows
(1) (2) where β = (kBT)
–1, k
B is the Boltzmann constant, T is the temperature,
pfs and prs are the steric factors for the forward and the reverse reaction,
respectively, and Ea and Eb are the activation energies for the forward
and the reverse steps, respectively. For an irreversible reaction, Equation (2) is not taken into account, as Pr = 0, which is equivalent
to assuming EB → ∞. This part of the present approach, defined by
Equations (1) and (2), is quite similar to that used in the hydrogen atom ionisation problem.20,21 Since the transition probabilities are well known, the important features that are intimately related to the rate law of elementary reactions can be determined, namely the Arrhenius’ Law of kinetics.
The dimensionless temperature-related variable, θ ≡ kBT/Ea, and
dimensionless energy-related variable, Eba ≡ Eb /Ea, are defined to
simplify the calculations.Thecomputational simulations carried out in this work are thus based on the thermal energy kBT and Eb, both
of which are measured with respect to Ea.
box Ai. If the choice fails, continue to step (II). If the choice succeeds,
a uniform random number z ∈ [0,1] is generated and compared to Pf
from Equation (1). If z ≤ Pf,the molecule indexed as i is eliminated
from box Ai, and a type-B molecule is created in box Bi, which
indicates that the reaction occurred, transforming A into B. If z > Pf,
the type-A molecule remains in its original form.
(II) Try to select a type-B molecule, following the same approach employed for the type-A molecule in step (I). If the choice fails, the step ends. If the choice succeeds, a uniform random number z ∈ [0,1] is generated and compared to Pr from Equation (2). If z ≤ Pr, the
reaction occurs and B is transformed into A. If z > Pr, the type-B
molecule remains in its original form.
By running steps (I) and (II) M times, one Monte Carlo step (MCS) is defined. If the reaction is irreversible, step (II) is not performed.
For an irreversible second-order reaction, A + B → C, only Equation (1) is followed, thus representing the transition probability of the type-A and type-B molecules to overcome the energy barrier, E ≡ Ea, and then transform A and B into product C. The following
step is performed in this case.
(III) Try to select two molecules, one of each type (A and B). If at least one of them fails to be chosen during the selection, the step ends. If the choices succeed, a uniform random number z ∈ [0,1] is generated and compared to Pf from Equation (1). If z ≤ Pf the reaction
occurs and A reacts with B to form C. If z > Pf, the A and B molecules
remain unreacted. As previously mentioned above, by performing step (III) M times, one MCS is completed.
It should be noted that the simulation started with given molar fractions of the type-A and type-B molecules, χA and χB, respectively. For an arbitrary choice of θ,the dynamics of the reaction and the influence of model parameters can be studied. Unless otherwise stated, all simulations will be performed with N = 106 molecules. The influence of N will be treated at the end. The time is measured in Monte Carlo Steps (MCSs).
In the next section, the irreversible reaction, A → B, will be studied, followed by the reversible A ⇆ Breaction and finally the second-order A + B → C transformation.
RESULTS AND DISCUSSION
Irreversible reaction
The irreversible first-order reaction A → B, will be studied first. Figure 1 shows χA and χB as a function of time, in MCSs.
The simulation started with all type-A molecules, where = 1.0, = 0,0, θ = 1.0 and steric factor pfs = ps = 1.0. As can be seen, χA
decreases until these species is completely consumed, whereas χB
approaches unity. The inset figure shows the behaviour of χA on a
The effect of temperature on the rate constant is shown in Figure 2, where χA is plottedas a function of time for different temperatures.
Since θ = kBT/Ea, this behaviour can be interpreted in two different
ways.11,12 One is that the increase in θ means that the k
BT term has to
increase when using a constant activation energy. We thus explore the effect of temperature on a given system by defining a specific activation energy. However, the increase in θ can also occur by fixing kBT and decreasing Ea. Therefore, we also investigated different
systems (different Ea) with the same temperature. Considering the
set of parameters (θ values) used in Figure 2, the same relationship between the rate constant (k) and temperature, in the form of the Arrhenius’ Law, is observed
(4) where A = 0.99844 and b = 1.002 ± 0.003. This is an expected result, because the Metropolis update used to simulate the data has the same mathematical structure as the Arrhenius’ Equation, which can be seen in the comparison between Equations (1) and (4). Another important feature here is the half-life (τ1/2). Using this model, the simulation yielded11,12
(5) where c = 0.69122 ± 0.0009, which is in good agreement with the theoretical first-order behaviour that yielded an expected value of ln(2) = 0.69314… . These results thus align with the theory of chemical kinetics that is widely discussed in many elementary textbooks.19,24,25
The influence of the steric factor in the system was also addressed. This parameter was introduced to take into account the dependence of the rate constant on the mutual orientation of the reactant molecules. The effect of the steric factor on the reaction is shown in Figure 3, where χA is plotted as a function of ps for θ = 1.0.
Decreasing ps decreases k, which leads to a slower consumption rate,
thus highlighting the fact that the molecules are not able to react in all directions. This implies that there is a favourable collision orientation, from a geometric point of view, that becomes increasingly
limited. Here the case where ps = 1.0 means that all collisions are
geometrically favourable.
An important issue that deserves attention is the fact that the steric factor does not change the main aspects of the kinetics. A simulation using ps = 0.5 was thus performed to check this phenomenon.
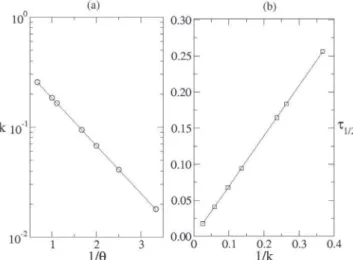
The rate constant k, on a log scale, is a function of the reciprocal of θ as shown in Figure 4(a). The solid line is the fitted function k = Ae–b′/θ, with A = 0.49881 and b′ = 0.9992 ± 0.0004. It is thus worth
noting that, within the standard error limit, follows the Arrhenius’ Law, with the only change being the pre-exponential factor A, as demonstrated in Equation (4). For other ps values, it is seen that
A ∼ ps, thus indicating that this approach is useful in dealing with the
kinetics of irreversible chemical reactions. As mentioned above, it is expected that A = ps and b′ = 1, which represent the parameters and
in Equation (4), since the transition probabilities have been defined from a mathematical structure similar to the Arrhenius’ Equation.
The half-life τ1/2 is shown as a function of 1/k in Figure 4(b). Even though k is different for other ps values, the dependence of
τ1/2 on 1/k is approximately linear, as indicated by the solid line on Figure 4(b). The fitted data yield τ1/2 ∼ c′/k, with c′ = 0.699 ± 0.001, which is in good agreement with Equation (5) which was obtained without steric factor.
This approach is applied in the kinetics of catalytic reactions by considering an energy change in the following manner: E → E + ∆E. If ∆E > 0, there is a “negative” catalysis or inhibition. Otherwise, if ∆E < 0, there is a “positive catalysis”.24 The kinetics are thus defined
by the parameter ∆Ecat≡ ∆E/Ea. The kinetic profiles of the catalytic and
non-catalytic reactions, with θ = 0.9 and no steric factor, are shown in Figure 5. As can be seen for a fixed value of θ, as the energy decreases (∆Ecat< 0), a given type-A molecule has greater chance (probability)
of overcoming the potential energy and being transformed into a type-B molecule. This analysis thus shows that by decreasing the energy barrier, the rate constant of the catalytic reaction increases in comparison to the non-catalytic one. An analogue analysis can be made for ∆Ecat> 0.
Reversible reaction
Here the reversible reactions of the type A ⇆ B are discussed, where both Equations (1) and (2) are considered. For simplicity, the steric factors are set to pf
s = p r
s = 1. Unlike the irreversible reactions, it
is necessary to define the dimensionless energy parameter, Eba≡ Eb/Ea,
which represents the reverse reaction energy barrier (rationed) to Ea.
Some results are shown in Figure 6, where Eba = 2.0 are considered,
with = 0.8 and = 0.0. The behaviours of χA and χB are shown
in Figure 6(a) for two distinct temperatures, θ = 1.0 (empty squares and circles) and θ = 1.5 (filled squares and circles).
When the system reaches thermodynamic equilibrium, χA and
χB are altered by increasing θ. The increase in the temperature from
θ = 1.0 to θ = 1.0 promotes a shift of the thermodynamic equilibrium
Figure 2. χA evolution as a function of time for different temperatures
Figure 3. The effect of the steric factor on the irreversible first-order reaction
Figure 5. The kinetic profiles of the catalytic and non-catalytic reactions
Figure 4. (a) The rate constant k, on a log scale, as a function of the reciprocal
a portion of type-A molecules and the formation of type-B molecules soon after the addition of the A reactant (∆χA = 0.2). However, the
system was shifted to a new thermodynamic equilibrium position with the new values of χA and χB. Similar to the results in Figure 6(a), these
results are in agreement with Le Chatelier’s principle, with the added reactant disturbing the thermodynamic equilibrium of the system.
Even though the equilibrium values of χA and χB before and
after adding the type-A molecules to the system are different, their ratios remain constant and equal to the thermodynamic equilibrium constant, Ke ≡ χB/χA. The thermodynamic equilibrium constant was
evaluated by measuring Ke at t ∈ [50,100] (not shown on the plot).
The simulations without extra reactant added yielded Ke = 2.720
± 0.006, whereas Ke = 2.718 ± 0.005 for the simulation with extra
type-A reactant added. These results are in agreement with the expected theoretical value of the equilibrium constant, Ke = 2.718…,
which is defined as the ratio between the kinetic constants of the forward and the reverse reactions, Ke = kf /kr. Similarly, Ke can be
defined here as the ratio between the forward and reverse transition probabilities, Ke = Pf /Pr.
Finally, the results of the simulations for the catalytic and non-catalytic reversible reactions are compared in Figure 7. Eba = 2.0,
= 0.8, = 0.0 and θ = 1.0 were considered in this case. The simulation of the catalytic reaction was accomplished by shifting the energy barrier by ∆Ecat = –0.5. It was observed that the rate constant
of the catalytic reaction was higher than the non-catalysed one. It was also observed that, regardless of the decrease in the energy barrier, the
Second-order reactions
The last examples we discuss are second-order reactions. Second-order reactions are categorised into two types, those that consist of two first-order reactants of the form A + B → C and those that consist of a single second-order reactant of the form 2A → C.19 These irreversible reactions only require Equation (1) in the mathematical model, with ps = 1, following step (III) in the experimental section. Depending
on the initial conditions of χA and χB, our model simulates the kinetic
behaviour of two second-order reactions, A + B → C, if ≠ , and 2A → C, if = .
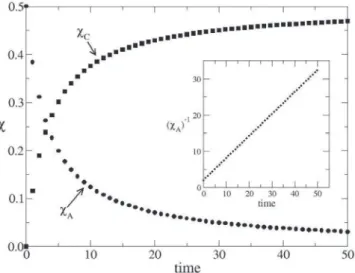
The time evolution of χA and χC for the second-order reaction,
2A → C, is shown in Figure 8. The type-B molecule has the same behaviour as that observed for the type-A molecule since = = 0.5. Thus, it is expected that the reciprocal of the molar fraction exhibits a linear behaviour with time.24,25 The inset shows the dependence of as a function of time. The data provide a
remarkable fit to , where = 2.006 ± 0.005 and
k = 0.6059 ± 0.0001, which is in good agreement with the theoretical calculation (k = 0.606530…).24,25 This kinetic characteristic is valid for other values of θ and initial molar fractions for χA and χB, with
the constraint = .
The behaviour of χA (A symbols), χB (B symbols) and χC (C
symbols) for a second-order chemical reaction, A + B → C , with the initial condition χA
0 ≠ χ
B
0, is shown in Figure 9(a). The predicted theoretical behaviour is that exhibits a linear dependence
on time as follows: . We thus carried out
simulations considering χA
0 = 0.5, χ
B
0 = 0.2, χ
C
0 = 0.0 and θ = 1.0 to investigate this situation. The simulated results are plotted in Figure 9(b), where is plotted on a log scale as a function of time. The simulated data provided an exceptional fit to , where k′ = 0.11103 + 0.00008, which was approximately equal to
Figure 6. (a) The time evolution of χA and χB for two distinct temperatures
and (b) The influence of the addition of the type-A reactant on the kinetics of the reaction
the theoretical result of .19,24,25 These initial parameters, as well as the other tested parameters, yielded results that reproduced the theoretical results.
Effect of the number of molecules (N) and the sampling (Ns) on
rate constant for a second- order reaction (2A → C)
Here we discuss how the number of the molecules (N) and the sampling (Ns) influence the results for a given rate constant and a
second-order reaction of the type 2A → C.
Figure 10 shows χA versus time for N = 102 (filled circles) and
105 (empty circles) molecules. The simulated results were obtained using = = 0.5, = 0.0, θ = 1.0 and Ns = 1. The fluctuations
on the temporal evolution of χA diminishes as N increases, and the
simulated data merge toward the expected theoretical result (straight line). As seen in Table 1, the simulated rate constant (ks) possesses
an increasingly better agreement with the theoretical one (kt) as N
increases.
The effect of multiple simulations is presented in Table 2. The data were obtained with N = 103 molecules and = = 0.5, = 0.0, θ = 1.0. As can be seen, ks approaches kt as Ns increases, evidencing
a similar effect when compared to the increase in N.
CONCLUSIONS AND PROSPECTS
A simple mathematical model has been used to investigate the equilibrium and kinetic properties of elementary homogeneous chemical reactions. The reaction dynamics between the reactants were proposed via the Monte Carlo method and the Ehrenfest urn model. The Ehrenfest urn model was used to define the order of the reaction, while the Monte Carlo method, with the Metropolis update, was used to access the main physical chemistry features as a function of activation energy, steric factor and temperature. All the basic characteristics of the reactions, such as the reaction order, the Arrhenius’ Law and Le Chatelier’s principle, were recovered with this simple model. Although the methodology presented here was only applied to first- and second-order reactions, we argue that it can be also used to study more complex (higher order) reactions.
Here we demonstrated the effectiveness of our model as a useful
Figure 8. The time evolution of χA and χC for the second-order reaction,2A → C
Figure 9. (a) The time evolution of χA, χB and χC for the second-order
reaction,A + B → C, (b) –χ on a log scale as a function of time
Figure 10. χA versus time for N = 102 (filled circles) and 105 (empty circles)
molecules
Table 1. The effect of the number of molecules N, for 1 sampling, on the rate constant value for a second-order reaction 2A → C and the percentage error of measurement between kt (theoretical rate constant) and ks (simulated rate constant)
N ks
103 0.7362 21.38
104 0.6117 0.85
105 0.6037 0.46
106 0.6059 0.09
Table 2. The effect of sampling Ns (multiple simulations, for N = 103
mo-lecules, on rate constant value for a second-order reaction 2A → C and the percentage error of measurement between kt (theoretical rate constant) and ks (simulated rate constant)
Ns ks
1 0.7362 21.38
10 0.6245 2.96
100 0.6103 0.62
used in this work, does not have at first a direct relationship with the real time. However, it is possible to propose a relationship between them, in order to use the simulations to treat real problems in chemical kinetics. One possibility would be to establish a connection between the MCS and some characteristic time of the chemical kinetics in a real problem, as proposed by López-Castilho and Souza Filho in which the step was related to the half-life time.10 Another possibility would be to propose a proportionality between the Monte Carlo step and the time between successive molecular collisions, given by the collision theory, as discussed by Oliveira-Neto et al., in the study of hydrogen atom ionization problem.20
Finally, we highlight that it is possible to develop a computational software interface with the algorithm reported here to facilitate its manipulation by users, be they teachers or students. This software development, as well as other results, are currently being undertaken. ACKNOWLEDGEMENTS
This work was partially supported by UESB, CAPES and CNPq (Brazilian Agency). Also, N. M. Oliveira-Neto thanks the ICTP (International Center for Theoretical Physics) in Trieste,Italy, where this work was partially developed.
Científica do Departamento de Química e Exatas2011, 2, 7.
12. Farias, R. R.; Cardoso, L. A. M.; Oliveira-Neto, N. M.; Junior, B. B. N.; Quim. Nova2013, 5, 729.
13. Novo, J. B. M.; Júnior, L. C. D.; Quim. Nova 2011, 34, 707. 14. Hollauer, E.; Quim. Nova 1988, 11, 186.
15. Winnischofer, H.; Araújo, M. P.; Júnior, L. C. D.; Novo, J. B. M.; Quim. Nova 2010, 33, 225.
16. Silva-Dias, L.; López-Castilho, A.; Quim. Nova 2015, 38, 1232. 17. Júnior, L. C. D.; Novo, J. B. M.; Quim. Nova 2014, 37, 361.
18. Binder, K.; Heermann, D. W.; Monte Carlo Simulations in Statistical Physics, 2nd ed., Springer-Verlag: New York, 1992.
19. Houston, P. L.; Chemical Kinetics and Reaction Dynamics, 2nd ed.,
Dover Publications, Inc.: New York, 2006.
20. Oliveira-Neto, N. M.; Curado, E. M. F.; Nobre, F. D.; Rego-Monteiro, M. A.; Physica A 2007, 374, 251.
21. Oliveira-Neto, N. M.; Curado, E. M. F.; Nobre, F. D.; Rego-Monteiro, M. A.; J. Phys. B: At., Mol. Opt. Phys.2007, 40, 1975.
22. Salinas, S. R. A.; Introdução à Física Estatística, 1st ed.; EDUSP.: São
Paulo, 1999.
23. Karlin, S.; McGregor, J.; Journal of Applied Probability1965, 2, 352. 24. Atkins, P. W.; Físico-Química, 6th ed.; LTC.: Rio de Janeiro, 1999.
25. Levine, I. N.; Físico-Química, 6th ed.; LTC-Gen.: Rio de Janeiro, 2012.