Table 1: basic characteristics of each study, based on Mahmood (2017)
WHY ADOPT THESE SCALES? A SYSTEMATIC REVIEW OF THE MOST USED SCALES ON EXPATRIATION STUDIES IN THE PAST TEN YEARS
Filipa Morão Dias Antunes
Dissertation submitted as partial requirement for the conferral of the grade of Master’s in Human Resources Management and Organizational Consulting
Supervisor:
Prof. Doutor Henrique Manuel Caetano Duarte, ISCTE Business School, Department of Human Resources and Organizational Behaviour
i
Abstract
Systematic review of scales used in the expatriation field following the PRISMA guidelines. Through multiple correspondence analysis, to disclose choices of criteria, a typology of measurement scales in the past ten years (2006-2016) in terms of psychometric properties, and other descriptive criteria, was created, with the aim of assist in operational decisions of future studies, contribute to reduce the number of new scales and allow the comparison of the existing ones, besides contributing to the overall enlargement of the expatriation field. Through multiple hierarchical regression, the psychometric properties that allowed to predict a greater number of citations (total and when comparing subsequent periods) were investigated.
This paper aims to identify the common constructs used on Expatriation, what are the most used scales to measure used constructs, changes in the use of scales on a time range, and to understand what are the tendencies in the thematic. It follows the protocol of previous peer-reviewed studies and adopts conceptual topics from prior expatriation studies.
Its contribution is both methodological, as the first systematic review of scales in this field, but also for future researchers, in the moment of decision, answering the question “why adopt these scales?”.
Keywords: measurement, psychometric properties, expatriation, expatriates, reliability,
validity.
JEL Classification System:
C81: Methodology for Collecting, Estimating, and Organizing Microeconomic Data J61: Geographic Labour Mobility
ii
Resumo
Revisão sistemática das escalas utilizadas no campo de expatriação seguindo as diretrizes PRISMA. Através de análise de correspondências múltiplas, para identificar as escolhas de critérios, foi criada uma tipologia de escalas de medição nos últimos dez anos (2006-2016) ao nível de propriedades psicométricas e de outros critérios descritivos, com o objetivo de auxiliar nas decisões operacionais de futuros estudos, contribuir para reduzir o número de novas escalas e permitir a comparação das existentes, além de contribuir para a expansão do campo da expatriação. Através de regressão hierárquica múltipla foram investigadas quais as propriedades psicométricas que permitem prever maior número de citações (totais e por comparação entre períodos subsequentes).
Este estudo tem como objetivo identificar os constructos mais comuns utilizados na Expatriação, quais são as escalas mais utilizadas para medir os constructos utilizados, e as mudanças no uso de escalas num intervalo de tempo, de forma a clarificar quais as tendências da área. Segue o protocolo de estudos anteriores, revistos por pares, e adota tópicos conceptuais de estudos passados da área de expatriação.
A contribuição deste estudo é tanto metodológica, sendo a primeira revisão sistemática de escalas neste campo, mas também para futuros investigadores, no momento da decisão, respondendo à pergunta “porquê adotar essas escalas?”.
Palavras-chave: medição, propriedades psicométricas, expatriação, expatriados,
confiabilidade, validade
JEL Classification System:
C81: Methodology for Collecting, Estimating, and Organizing Microeconomic Data J61: Geographic Labour Mobility
iii
Index
Abstract ... i Resumo ... ii Relevance... 1 Literature Review ... 5 SYSTEMATIC REVIEWS ... 5QUALITY ASSESSMENT OF SCALES ... 6
EXPATRIATES ... 7
CONSTRUCTS, MEASURES AND PSYCHOMETRY ... 11
Methodology ... 18
Results ... 44
CREATION OF THE TYPOLOGY ... 46
RELATIONSHIPS AND EXPLANATIONS ... 49
Limitations, Implications and Future Research ... 54
References ... 57
References used for Scale Assessment ... 61
Attachments ... 65 ATTACHMENT 1 ... 65 ATTACHMENT 2 ... 68 ATTACHMENT 3 ... 69 ATTACHMENT 4 ... 70 ATTACHMENT 5 ... 71 ATTACHMENT 6 ... 74 ATTACHMENT 7 ... 75 ATTACHMENT 8 ... 75 ATTACHMENT 9 ... 76 ATTACHMENT 10 ... 76 ATTACHMENT 11 ... 77
1
Relevance
Since the 1970s there has been prominent recognition in business research and talent management that the use of expatriates was significant.
In 2005, Dumont & Lemaître, in an OECD study about immigrants and expatriates had already recognised the ongoing recurrence of the topic of expatriation. They justified it with political and historical events that had allowed for an easier movement of people across countries, along with the growing globalisation of the economic activity. Moreover, with the expected and observable ageing of the population, the search for highly-qualified workers had put a higher tension on these movements.
In 2016, Cascio & Boundreau performed a content analysis and review of published research in the field of International Human Resource Management on the period of 1965 to 2014. Focused on data from the Journal of World Business it allowed the understanding of the evolution of the research on expatriation. There was little research from 1965 to 1979 (5–5.8% of published articles in the broad field of IHRM). The percentage rises to 9,1% from 1980–1984, to 14,3% in 1985–1989, drops to zero in 1990–1994, then rebounds to 31,25% in 1995–1999, stays high at 22,7% from 2000–2004, reaches a peak of 40% in 2005–2009, and then drops precipitously to 8,4% from 2010–2014.
Similarly, Dabic, Gonzalez-Loureiro and Harvey (2015) show a first peak in expatriation studies in the late 1980s and early 1990s, and a second peak in the period 2000-2007. The citations are extremely high on this second period.
Image 1: Evolution of the scientific literature on expatriates. Source: ISI-Web of Science – Social Science Citation Index (consulted on 2 April 2012), in Dabic et al. (2015).
2 By performing a search on PsycINFO (with all its databases) we obtained a general idea of the complexity of the research on Expatriation. With the lexeme ‘expatriat*’ (‘*’ was used to assure that all the possible combinations of the lexeme ‘expatriate’ (e.g.
‘expatriate’, ‘expatriates’ or ‘expatriation’), including only peer-reviewed journals with references available, from 2006 to 2016. The search yielded 2.132 articles, of which at least 20% are quantitative studies. Such a figure highlights the importance of studying the variables that compose these quantitative studies. This is one objective of the current research.
Although overall research on expatriates has continued, special issues and calls for new research directions seem to be more common nowadays. However, McNulty and Brewster (2017) argue that “there is a lack of consensus as to how expatriates should be defined which has caused problems in the international human resource management (IHRM) field”; these authors say that “there has been a sloppy and almost casual use of terminology, a failure to define terms adequately, or in many cases at all, and too many unstated assumptions about the people being researched that, collectively, has resulted in reducing understanding of the meanings of ‘expatriate’. This problem means that the measures used in empirical studies may not accurately represent the underlying concept being tested (Cappelli, 2012)”. In their study, they clarified the constructs behind the different types of expatriates. But they also state that “In order for future studies of expatriates to have their intended impact, there needs to be ‘clear agreement on the substantive definitional content’ (Suddaby, 2010, p. 348)”. Our scope starts here. How are the concepts in these researches studied? It is of major importance to understand the operationalization of the concepts.
When researchers design a study, many questions arise and choosing the right measurement scales is one of them. For this decision, researchers can consider measurement scales’ psychometric properties (e.g., validity and reliability), their acceptance by the scientific community, but also other characteristics like item parsimony and the type of rating scales.
Moreover, and specific to IHRM research, “the same construct may contain different content or manifest in different ways in different cultures” (Raghuram et al., 2017). In the domains of management, organizational psychology and human resource management, systematic reviews about concepts, topics and theoretical models are common practice (e.g., Andresen, Bergdolt, Margenfield, & Dickman, 2014; Bonache, Brewster, & Suutari, 2001; Dabic et al., 2015, McNulty & Brewster, 2017). Also,
meta-3 analysis of findings are extremely common, allowing researchers to be more precise about existing gaps, and to build studies that advance on past evidence (e.g., Hechanova, Beehr & Christiansen, 2003; Lee & Qomariyah, 2015). The same does not occur regarding construct operationalization, namely those widely used in sectional and cross-cultural studies, where few systematic reviews about measurement scales are published (for exceptions see Cyril, Smith and Renzaho, 2015; Fields, 2013), with a special focus on the medical field. The domain of expatriation studies is no exception to this absence. Thus, and to our knowledge, there are no scientific studies comparing in an extensive and systematized way the characteristics of measurement scales used in expatriation studies, its validity, reliability, and adoption. Such systematization could allow a quicker and more rational choice of measurement scales, but also a better discussion about their uses, namely in the design of expatriation studies. This is a gap that we aim to fill with the present study.
It is considered that a systematic review comparing the adoption of scales and associated constructs can contribute to the ongoing discussion of concepts and topics on the expatriation area (e.g., Bonache, et al, 2001; Dabic et al. 2015; McNulty & Brewster, 2017). Secondly, by unveiling the criteria associated with the adoption of measurement scales, this study can guide decisions about operationalization of future studies in this area. Thirdly, by discussing the stability and innovation of the adoption of some measurement scales in the past ten years (the period to be covered), we aim at contributing to reduce the need of creating new scales that have no innovation or will reduce the possibility of comparison with existing findings.
Specifically, our study aims to review systematically the scales used in the expatriation domain in order to:
- Identify the most relevant characteristics of a scale in terms of psychometric characteristics and other possible decision criteria (relevance, parsimony) – quality measures;
- classify the scales according to these criteria of quality identified;
- classify the scales according to the conceptual topics usually used in expatriation studies, but also according to sample characteristics (self-initiated, assigned expatriates, other expatriates);
- analyse the frequency of adoption of the scales in two periods (2007-2011/ 2012-2016) and detect possible tendencies. The use of two-time periods allows
4 comparing the frequency of scales’ adoption and detect possible changes and scale innovations associated with the concepts integrated in the study;
- analyse the influence of the quality measures in the frequency of adoption of the scales.
We consider that the systematization and the critical analysis of the findings presented above will allow to make a twofold contribution:
- supporting decision in future studies; in fact, researchers can use this study to support their choices while designing their own studies. By presenting a typology of the scales, we expect to help researchers with a more rational choice and keep in pace with the main purposes of their studies. To put it simply, researchers can answer more easily to the question “why adopt these scales?”
- methodologically, we aim at contributing to the discussion of what criteria can be used when choosing a scale from the existing published ones. In fact, the studies with these characteristics tend to compare the psychometric characteristics of some scales (eg. Cyril, et al, 2015; Shen & Parsons, 1997; Warmbrod, 2014). However, and as far as we know, no published study makes a systematic comparison of existing scales in a specific domain and critically examines its adoption (not only in expatriation, but also in other Human Resources domains of research), thus adding value to the field as a whole.
5
Literature Review
Systematic reviews
A huge amount of research is produced each year, often with conflicting findings. In 2016, Kepes, Bennet & McDaniel, published an article on the trustworthiness of cumulative scientific knowledge, from an Evidence-Based Management (EBMgt) perspective. The idea behind EBMgt is that it provides collective “scientific evidence and validated local facts” as the starting point for managers to make decisions (van Aken & Romme, 2012, cited by Kepes, Bennet & McDaniel, 2006).
The authors state that reviews play a fundamental role in the development, assessment, and dissemination of cumulative knowledge (Briner et al., 2009; Le et al., 2007; Rousseau & McCarthy, 2007), and for that reason they too, should be critically assessed, by the standards and guidelines available for that purpose.
Researchers, practitioners and policy-makers felt the need to synthesize such amount of data. Therefore the idea for systematic reviews originated in the 1970’s, in the health care industry, (Ungvarsky, 2017).
A systematic review is a thoughtfully organized and structured assessment of all completed research about a specific topic. It attempts to organise all empirical evidence that fits pre-defined criteria so that it can answer a specific research question. It uses explicit, systematic methods that are selected to minimize bias, thus providing more reliable findings from which conclusions can be drawn and decisions made (Ungvarsky, 2017; Chandler et al., 2017).
A systematic review ought to have the following characteristics: a clearly stated set of objectives, including the already mentioned pre-defined eligibility criteria for studies; an explicit, reproducible methodology; a systematic search that attempts to identify all studies that meet the eligibility criteria; an assessment of the validity of the findings of the included studies; and a systematic presentation, and synthesis, of the characteristics and findings of the included studies (Chandler et al., 2017).
Systematic reviews may later evolve into a meta-analysis, in which a statistical component is included, to synthetize the data earlier treated.
Performing a systematic review is less time-consuming and less expensive than conducting new studies. In addition, systematic reviews are generally more accurate than
6 any individual study, since bias is reduced, and the results can be more widely applied (Ungvarsky, 2017).
To ensure the rigor of this form of reporting, was published in 1999 a reporting guideline – QUORUM (QUality Of Reporting Meta-analysis) Statement (Moher et al., 1999). At the time, it was focused on the report of meta-analysis of clinical randomised controlled trials and resulted in a checklist and a flow diagram.
In 2005, a group of authors, clinicians and editors updated this methodology into what is now PRISMA (Preferred Reporting Items for Systematic reviews and Meta-Analyses). Similarly, the PRISMA Statement consists of a checklist and a flow diagram (attachments 1 and 2). In the checklist the essential items for a systematic review can be found, as well as a four-phase flow diagram; these resources deem to be useful when performing this activity.
Quality assessment of scales
Previous studies have used this approach to systematically examine measurement properties of scales.
In Cyril, Oldroyd & Renzaho (2013) the PRISMA guidelines were used to evaluate measures of urbanicity. Similarly to the current study, no previous research had attempted to do so. In the inclusion/exclusion criteria section some relevant characteristics stand out: published in peer-reviewed journals, full text available in English and tested for validity and reliability. The quality assessment included theoretical framework, validity and reliability and demographic characteristics. The criteria to classify them as good quality studies were: underlying theory guiding scale construction, internal consistency above 0,70, priori hypotheses confirmed, and support by dimensional structure through exploratory or confirmatory factor analysis. Tables expose the characteristics (1), methods adopted in the development (2) and ratings (3). The study’s main conclusion urges the standardisation of measures of urbanicity and the typology created aims to help with that.
Following the same methodology, Cyril, Smith & Renzaho (2015) aimed to evaluate empowerment scales in three dimensions: item development, reliability and validity, using the PRISMA statement. It clearly states the methods used, thus allowing replication. Its conclusions regarding the lack of view of the construct of empowerment as a multidimensional construct and urging the use of mixed methods, ought to be helpful for future researchers in the field.
7 Bastos et al. (2014), does not clearly state the use of PRISMA. In it, the authors addressed racial inequalities in health. The authors state that the psychometric properties of the instruments used in this field had not been done before, despite the large number of them. However, this study does share some characteristics with the PRISMA statement, namely the items included in the research also followed the three methodological steps of item development, reliability analysis and validity analysis. Nevertheless, the presentation of the results was more focused on the percentage and number of scales which resorted to a method (and it does state the method per scale) but did present a final evaluation of each scale.
In Hjermstad et al. (2011) an approximation of the PRISMA was used to investigate the used and performance of pain scales. However, it specifically compares some of the most used ones, being that one of the inclusion criteria. The study does not clearly focus on the psychometric properties of the scales but on their usability, compliance and descriptive characteristics.
A recent study by Mahmood (2017) systematically reviews scales of perceived self-efficacy information literacy. The statement is thoroughly followed from the search strategy, inclusion and exclusion criteria to the evidence of reliability and validity. The major implication of this study is the identification of “the strengths and weaknesses of IL assessment surveys reported in the literature” (Mahmood, 2017). Overall it recommends the change in mindset when it comes to measurement scales, namely the importance in its quality characteristics as to ensure valid and reliable results.
In contrast with the previous examples, this study is not directly related with the medical field, in which the PRISMA guidelines were born, proving its potential for other contexts.
Expatriates
The field of expatriation has had, throughout the years, space for many systematic reviews (e.g., Andresen, Bergdolt, Margenfield, & Dickman, 2014; Bonache, Brewster, & Suutari, 2001; Gonzalez-Loureiro, Kiessling, & Dabic et al., 2015, McNulty & Brewster, 2017), attempting to draw frameworks, definitions and common practices, as well as highlight the future areas of research within the field.
In 2015, Dabic et al. performed a bibliometric analysis on the existing literature about expatriation, over the last 40 years (1970-2012). Their main conclusions show that research “has been focused mainly on HRM, culture and career development in multinational corporations, as well as on the relationships between headquarters and
8 subsidiaries and between the different subsidiaries. (…) Virtually, all of the research has been conducted from an empirical perspective based mainly on HRM practices and theories”. There is still room for much empirically and theoretical work and construct operationalization is an absence in said reviews.
Numerous authors have tried to give clear definitions of the existent types of expatriates (Doherty et al., 2013; Andresen et al., 2014; Tharenou, 2015; Andresen, Biemann & Pattie, 2015; Przytuła, 2015 are some examples). This not only shows the lack of clarity regarding the subject but also the awareness of the authors to the problem, since by now the research is already vast on this search for the proper definitions as well (Andresen et al., 2014; Tharenou, 2015; McNulty & Brewster, 2017).
Straightforwardly, throughout this paper, with the construct clarity always in mind, we will be adapting the definitions provided by Tharenou (2015) and Andersen et al. (2014), complementing with other renown authors of the field.
Migrants experienced a geographical relocation of their dominant place of residence (Andersen et al., 2014). Assigned expatriates (AEs) are understood as professionals assigned/sent by their employer overseas, with an intended organizational purpose, for (usually) a pre-determined period of time. All costs associated with the move are of the responsibility of the employer and it often includes the move of the family as well. According to the boundary conditions established by McNulty & Brewster (2017), AEs are also non-citizens of the country to which they are moving, and this movement is associated with a legal framework that needs to be met. It is possible to make distinctions inside this category but is not as relevant for our study.
On the other hand, when it comes to Self-initiated expatriates (SIEs), the motivation to move abroad is taken by the professional, whether by applying for a job overseas, or by moving with the intention of finding a job after established (Andersen et al., 2014). In these situations, the expatriation is self-funded, for, usually, an undefined time frame. The reasons associated with the change are most commonly personal nature - professional, lifestyle, cultural and personal reasons (Tharenou, 2015).
It is also important to distinguish what is not an expatriate. Individuals working illegally in a foreign country are not considered expatriates, as well as those who, despite having a proper legal framework are not working. These individuals are “only” considered migrants (Andersen et al, 2014). Sojourners, students, retirees, travellers and tourists (McNulty & Brewster, 2017) are also not under the scope of expatriation.
9 Other studies, have specifically dedicated to stand out the differences between these types of expatriation, for example, Doherty (2013) and Doherty et al. (2013). In these articles, the authors propose, namely, a review of past researches and future suggestions, and to deepen the knowledge about these people, clarifying the construct of SIE.
This portrays, that this is a gap in the expatriation literature that the authors are trying to fill. However, it uncovers another issue. Many studies have compared self-initiated (SIEs) and assigned expatriates (AEs), however the methodology used in them is not coherent and can lead to misinterpretations. For example, Doherty (2013), in a review of studies published between 1996 and 2011 on self-initiated expatriates, concluded that the methodological approach on SIEs studies focused on in-depth interviews and case studies, snowball or convenience samples, internet/on-line surveys or a combination. According to the author, longitudinal approaches are rare, and overall, research is only happening in specific geographical regions. Andersen et al. (2014), performed a review and synthesis of the existing definitions of self-initiated, assigned expatriates and migrants, criteria-based, and develops into a typology of four different types of expatriates. Similarly, the criteria used to select the samples lacked methodological rigour:
- The period of publication of articles was larger for SIEs than for AEs;
- For AEs, only journals with a high accumulated impact factor from 2005 to 2010 of the respective journals using the ISI-index were included; for SIEs non-listed journals were included;
- Articles published in journals that included multiple articles about expatriation or migration and purposely selected journals for having the highest number of hits (AEs), while for SIEs journals in which only one article had been published and those with a low number of hits were included.
Already in 2015, Tharenou examined the methodological issues associated with research into three expatriate types (AEs, SIEs and skilled immigrants (SIs)). Based on this author, the studies of AEs present more structured research designs, increasing the possibility of replication. Also, studies of SIEs are more likely to exhibit measurement error, when compared with AEs as they assess/report less frequently the validity of the measures used. Moreover, it is identified the efforts to reduce bias from alternative explanations of the results in the studies of AEs, again increasing their quality. Overall, across 290 studies, comparing these samples, AEs studies more often used thorough research designs, stronger theoretical background, adequate measures and complete analyses, while SIs studies use new measures developed for the study and less often applied formal structured
10 analyses. In fact, the variations in research design for the 3 groups had direct implication in the quality of the journals in which they were published.
Adding to this, Farcas & Gonçalves (2016) performed a systematic analysis of self-initiated expatriate’s studies, in the period of 2012 to 2014, in which they identified 45 peer reviewed published articles, almost the same as 1997–2011 (49 articles), besides 10 literature reviews (more than twice in the previous period). The authors conclude that the topics include comparisons between SIEs, AEs and other forms of mobility, along with the conceptual clarification of what it means to be a SIEs, as well as the expansion of the countries where research has been conducted.
This leads us to believe that articles in which the sample is of AEs the methodological rigour will be higher, thus the quality of these scales will also be higher.
H1: The quality of the articles in which the sample is AEs will be higher than in of SIEs.
One of the intentions of this study is to understand if these differences have had their origins in the scales originally used, that is, if we can find differences in the quality of the scales based on its sample (especially AEs vs SIEs).
Moreover, overall, the most common topics were target of investigation by Dabic et al. (2015) in which they concluded that “around one-third of the papers used the following keywords: assignment/s, adjustment, management and international (…) the essential question: how expatriates may help improve a company’s performance”, being the most frequent subjects adjustment, management, culture, performance and training. All of these themes were, at one point or another, assessed with quantitative measures, as we will show later, and yet, we and researchers as a group, don’t know with what quality as most studies don’t operationalize the constructs being discussed.
Another important aspect in existing systematic reviews in the expatriation field is the outcomes they produced. Namely, Gonzalez-Loureiro et al. (2015) developed, from a review of articles on acculturation and forms of overseas assignments, a dictionary of descriptors and keywords, divided in five blocks of information, which allow a categorization of the most used concept in the area (Attachment 4).
Similarly, McNulty and Brewster (2017) compiled a glossary and defined boundaries to classify business expatriates, which then allowed the development of a prototype model in attachment 3. These researches will prove useful throughout our study in attempt to combine existing theory in different fields.
11
Constructs, measures and psychometry
It has been previously mentioned that construct clarity - the extent to which the definition is precise and scholars in a community agree upon it (Molloy & Ployhart, 2012) – will contribute to the impact of studies. Thus, the importance of achieving that in the field of expatriation.
According to Suddaby (2010), nowadays, the accumulation of knowledge can only occur if the researchers are able to build on past work. Thus, the ability to articulate the elements that constitute an idea is what will allow us to understand where they overlap or differ. As McNulty & Brewster (2017) state, themeasures used in empirical studies may not accurately represent the underlying concept being tested, thus the magnitude of concepts regarding expatriation. Does that mean we have too little or too few constructs?
A new construct should have a clear definition and its association, or non-association, with existing constructs should be known in order to avoid assuming that just because a scale has a different name it does (or not) reflect the same (Bono & McNamara, 2011). So we conclude it is important to reflect before starting to develop new constructs. But what if the existing ones are poorly used? Newman et al. (2016) state that “it is too common for researchers to not only fail to define their concepts and terms adequately, but that they often ignore overlaps with similar, long-established concepts”.
Bono & McNamara (2011) give the example of the inappropriate adaptation of existing measures by researchers, without providing supporting validity evidence (in an attempt to reduce the length of the surveys and therefore make them less unattractive, to obtain more answers). Also recurrent, the inappropriate application of existing measures, meaning they use existing measures to assess different constructs from the ones they were designed to.
Switzer et al. (1999) distinguish four types of measures: established measures, as those used in more than one research setting and with proof of good reliability and validity in each of these settings; modified measures have been modified to fit the research goals; hybrid measures consist in a combination of items from more than one source to assess a single construct; finally new measures are developed with a specific research goal in mind.
Developing a new instrument means conducting an additional research that will require considerable effort and time to be carried out. In general, it is only recommended to develop new instruments when there are no existing options for measuring the
12 phenomenon in question or when the existing ones have confirmed limitations (Bastos et al., 2014). On the other hand, the wrong choice of an instrument has its downside too:
✓ Lack for solid theoretical basis;
✓ Need to consider context and psychometrics;
✓ Can compromise the internal validity of the study, producing misleading results; ✓ Implications in the ability to generalize the results and to compare them;
The creation of a new measure should be seen as a last resort, after a thorough search for existing measures. In the process of developing a new measure, justifications for its development, including a description of its necessity and the unavailability of appropriate established instruments, should be provided. The steps followed in generating ideas about specific items and the constructs they identify should be explained in detail. Ideally, a large pool of potential items should be generated on the basis of focus groups or expert opinion, pilot tested, re-evaluated, and reduced to form some final draft of the measure. As part of the process of identifying a construct and creating the measure, the purpose of the measure (i.e., proposed theoretical relationships) should also be clearly described. After data using the measure are collected, researchers should extensively evaluate the measure's reliability and validity (Switzer et al, 1999).
Of course, the decision to select among various available instruments and, at the same time, respect budgetary and temporal restrictions, is one of the main challenges of research conduction. However, it is of upmost importance when designing the research question to carefully match the construct definition with operationalization, using measures with established construct validity (or providing) such evidence (Bono & McNamara, 2011), whether that means using an existing one or developing one that is new. “Research methodologies directly impact the validity and generalizability of a study” (McGrath & Brinberg, 1983, cited by Yang, Wang & Su, 2006). In a 2015 article, Phyllis Tharenou analysed methodological issues associated with research into the most common types of expatriates, being research design one of them. Research design refers to the overall strategy chosen to integrate the different components of a study in a coherent and logical way, ensuring that the research problem is effectively addressed (De Vaus, 2001). Tharenou (2015) states that rigorous research designs and credible, trustworthy results are only achievable if the conceptual component – “focused on the development of the research question: its relevance, importance, specificity, conceptual basis and match to the research design” - and methodological component – “focused on traditional scientific elements (e.g. strong research design, generalisability, lack of sampling error,
13 validity, low measurement error, sound transparent analytic methods, contextual interaction, replication) linked to produce the best available scientific evidence” - have been carefully designed and integrated (Rousseau and Barends, 2011; Briner and Walshe, 2014; Kepes et al., 2014, cited by Tharenou, 2015). As stated “Researchers need to ensure that the selected design and analysis match the research question and enable robust, replicable results (…) The research design needs to display specifically applicable features: for survey studies: high-quality validated, usually multi-item measures with low error and using longitudinal designs with more than self-report data” (Tharenou, 2015). Psychometrics refers to the properties of an instrument as it functions within a specific context (Switzer et al, 1999). Slaney, Storey & Barnes (2011) ensure that the concern for psychometry has never been greater than in recent years, given the growing number of instruments available. However, the authors underline that “it would seem, despite decades of work within theoretical psychometrics and the development and advancement of a large body of both theory and method, the practices of researchers are often quite ill-specified, misguided, and/or inconsistent when it comes to evaluating the psychometric properties of the measures they employ in their research” (Slaney, Storey & Barnes, 2011). This means, another focal point in this field is data analysis since “the psychometric properties of the measures, (…) need to be gauged for quality. To ensure sound analyses, the researcher needs to clearly and fully describe the sample’s characteristics, and to increase internal validity, apply control variables in mean-variance analyses to deal with sample attributes and reduce alternative explanations for the results” (Tharenou, 2015).
Highlighting, from Streiner & Kottner’s (2014) work, the main aspects to consider when evaluating scales developed by others are:
• Regarding the scale(s) or instruments: number of items (and if they are reverse scored); sub-scales, and items in it; the scoring format; response alternatives; • Sample: inclusion and exclusion criteria;
• Sample size: dependent on the research design and the purpose;
• Results: to report the internal consistency of scales (the usual statistic is Cronbach’s alpha); all estimates should be accompanied by their respective confidence intervals.
Preliminary item data should be analysed through Exploratory factor analysis (EFA), a statistical method used to uncover the underlying structure of a relatively large set of
14 variables. Then follows Confirmatory factor analysis (CFA) to verify the factor structure identified by the initial EFA (if not verified, re-administration or other actions may be required). Once the final factor structure has been confirmed, the internal reliability of the scales should be assessed (Robinson, 2018).
The two primary concerns of psychometric evaluation are reliability and validity. Reliability of a measure refers to the its ability to detect the true score rather than measurement error (caused by imprecision in measurement). A perfectly reliable instrument would detect only the true score. The concept of reliability focuses on two considerations:
1. Items belonging to a scale assess a single construct;
2. Scales measuring a single construct produce consistent estimates of that construct across multiple measurements;
The first consideration is usually labelled “internal-consistency reliability” and is most commonly assessed with Cronbach's alpha. Alpha ranges from 0.00 to 1.00, with higher scores indicating greater internal consistency. Alpha is sensitive to the number of items in a scale and typically increases as the number of items increases. It has been suggested that a good standard for the latter two situations is to obtain reliability coefficients of 0.50-0.80 (Switzer et al, 1999). The second reliability consideration, consistency across multiple measurements, has several variations, including test-retest, and assumes that many human attributes are relatively stable in the short term. Thus, reliable instruments should produce consistent estimations of such attributes across multiple measurements administered in relatively close temporal proximity. Thus, test-retest reliability is obtained by reassessing individuals, with the same measure, a second time, after the initial measurement (Switzer et al, 1999).
Validity is most often defined as the extent to which an instrument measures what it was intended to measure (Anastasi 1982). Validity can be assessed by examining the methods used to determine content validity (if items measure the constructs of interest), structural validity (degree to which the scores on the scales reflect the dimensionality of the construct), internal construct validity (if relationships between scales are consistent with the hypothesis) and external construct validity (whether scales converge with and discriminate scores on other measures in the hypothesized way) (Mokkink et al., 2010 cited by Cyril et al, 2015).
Another common measure is the Coefficient of Variation (CV). It measures the variability of a series of numbers independently of the unit of measurement used to obtained them,
15 (Salkind, 2010). The standard formulation of the CV is the ratio of the standard deviation to the mean. The CV aims to describe the dispersion of a variable in a way that does not depend on its measurement unit. The higher the CV, the greater the dispersion in the variable (UCLA: Statistical Consulting Group).
On the other hand, Kepes, Bennet & McDaniel (2016) highlight that in the moment of evaluating published scientific evidence, we should consider not only traditional scientific factors such as validity, reliability, and generalizability, as well as contextual factors such as quality, importance, and relevance (Briner et al., 2009; Greenhalgh, 1997; Guyatt et al., 1995; Jelley et al., 2012; Straus et al., 2011). Guidelines, standards, and checklists can facilitate the critical appraisal.
Parsimony is another feature under the scope of psychometry. In general, parsimony is the principle that the simplest explanation that can explain the data is to be preferred, i.e. the simplest model/theory with the least assumptions and variables but with greatest explanatory power. We will be referring to parsimony as the total number of items included in the measures.
Hinkin et al. (1997) highlight that even though there are no rules regarding number of items for a scale, some heuristics exist to simplify the process. A measure ought to be comprised of the minimum number of items that adequately assess the domain of interest, i.e. be parsimonious (Thurstone, 1947 cited by Robinson, 2018), whilst minimizing response biases caused by boredom or fatigue. A minimum of three items per scale is usually recommended, as it will most likely generate better results in confirmatory factor analysis (Marsh, Hau, Balla, & Grayson, 1998 cited by Robinson, 2018). However, frequently in research, some items may not have a statistical correspondence and must be deleted (Robinson, 2018). So at least twice as many items should be generated than will be needed for the final scales (Hinkin et al, 1997).
Our aim with this research is to create a typology, strongly supported by previously validated scientific evidence, that can be of assistance for researchers in the field of expatriation. It includes not only previous typologies, as well as psychometric information. Bailey (1994) highlights some of the advantages of classification, which can be understood as the process of grouping by similarity. Firstly, it allows an exhaustive description of data in a format in which the researcher can, for example, quickly identify “a particular type score on a particular dimension and which types are contiguous to a particular type” (Bailey, 1994). Also, identifies differences and similarities, which will then allow comparison, and most of all it reduces complexity.
16 As later stated we will be retrieving information from both the article in which an expatriation scale in published, as well as its original publication, thus we will be looking at both the characteristics of the original scale (previously presented) as well as one of its outcomes – citations. Citations are continuously referred to as performance indicators in research evaluation. The basic assumption is that number of citations can be regarded as a measure of scientific quality or impact (Aksnes, 2005). Frequently cited papers are assumed to be more useful than publications less cited, thus, the number of citations may be regarded as a measure of the article’s usefulness, impact, or influence (Aksnes, 2005). Authors use citations because they believe the item they are highlighting is relevant and wish to draw readers attention to it, whether to criticise it, build on it or enhance their argument (Ahmed et al. 2004).
However, citation studies are controversial. Issues such as “the inadequate coverage of ISI suite of citation indexes, and the fact that citations are given for a variety of reasons, including: paying homage to pioneers in the field - typically characterised by citations to papers many years old (the focus of this paper); giving credit to related work; when a standard methodology or piece of equipment has been used, cite the reference to it rather than describe it in detail; background to the topic; correcting or criticising the previous paper; corroboration for one’s ideas or claims; drawing attention to previous work that is not well known, and ought to be” are the source of many studies (eg Macroberts & Macroberts, 1989; Moed, 2002; Warner, 2000). A more interesting criticism to our study is that citation counting implies a strict view on numbers, without contemplating more subjective criteria such as “quality” and “influence” (Ahmed et al. 2004).
From Aksnes (2005) work some general numbers stand out: - recent papers are more cited than older ones (Price, 1965);
- most articles are cited relatively constantly from year to year following a general pattern of rise and fall;
- articles with more than 15 years old are hardly cited at all (Oppenheim & Renn, 1978);
- a maximum of citations is reached about three years after publication (Van Raan, 1993).
Is of our interest in this study not only to understand the impact of citations as a whole, but especially, throughout time.
Some phenomena help to better understand this relationship. To begin, the importance of a contribution cannot always be recognized immediately. Citations can only be
17 considered at a specific time, while contributions can only be properly assessed after some time has passed. Also, when a paper is cited in many subsequent papers, its visibility increases and by consequence its chances of getting even more citations. Moreover, an article may first be cited for its content, however, when it is widely known and has obtained many citations other heuristics will rise. Another temporal effect is the phenomenon of “obliteration by incorporation”, that is, basic knowledge is no longer cited (Aksnes, 2005).
Taking this into consideration as well as the research presented, we propose the following:
H2: The number of citations of a scale is positively related to its quality. H3: The citation in the last five-year period is dependent on the citation that occurred
in the previous five-year period.
H4: The scales that were published before will be more used than the most recently published.
18
Methodology
In the health care field, rigor is of the upmost importance. Systematic reviews are frequent because they guarantee this, due to their methodological accuracy. The PRISMA approach was developed in an international committee with vast experience, to ensure that researchers from all over the world, from different fields, follow the same steps when conducting a systematic review. The PRISMA Statement consists of a checklist and a flow diagram (attachments 1 and 2).
Cyril et al. (2015) and Hjermstad et al. (2011) are examples of the use of such approach in systematic reviews. Despite the underlying topic being very distinct, the current research uses the same approach and objectives of said studies.
For example, in the case of Cyril et al. (2015) “the aim of this study was to evaluate the measurement properties of quantitative empowerment scales and their applicability in health promotion programs”. A clear parallel can be established with the present study. In literal terms, the aim of this study is to evaluate the measurement properties of quantitative expatriation scales, develop a typology of use and their applicability in future research in the area.
The guidelines followed allow the replication of the methods used as to validate them. As such the method goes as following:
I. Search Strategy
II. Inclusion and exclusion criteria
III. Data extraction and quality assessment
In a first stage, a list of articles was extracted from ISI Web of Knowledge, according to selected keywords based on McNulty & Brewster (2017): expatriates, expatriation, migrants, international mobility, overseas personnel, overseas executives, overseas assignments, international assignees, international assignments, international mobile professionals, international managers, international personnel, foreign managers, foreign workers and self-initiated movers.
This search resulted in 6211 records. To begin, three criteria were identified:
1. The study had to be of quantitative nature;
2. Expatriation related (migrants not included, yet still verified at a second stage); 3. Study published between 2007 and 2016.
19 Were excluded qualitative studies, studies that were not focused on expatriation, studies not published in range specified, among others.
The screening of these records was done by reading the titles and abstracts that were extracted from the search. This analysis was done in agreement between two judges. When in doubt the study would go through for further analysis.
Afterwards, an in-depth reading of the “methodology/measures” chapter of the articles was done as to ensure our scope still stood. The type of document (article, book, chapter) was not limited as long as it would be assessible to the judges.
The flow chart in Image 2 represents the process of screening, selection, exclusion and inclusion of the studies.
The articles that fulfilled our scope were downloaded, as to be assessed for eligibility. At this stage 5811 records were excluded for not belonging to the scope of the research. Thus 90 full-text articles were included – our Scale Used Studies (SUS). These studies contained quantitative scales, were related to the topic of expatriation and had been published between the years of 2007 and 2016.
Every scale from those 90 SUS was listed as to obtain its original author.
Sometimes authors use entire scales from the literature, sometimes they gather two or more and they can also create their own. All cases were assessed.
In this process some information was extracted from the studies, namely: • Construct;
• Dimension (if applicable); • Number of used items; • Definition;
• Scale designation;
• Sample (assigned expatriates, self-initiated, other);
• Sample N; • Cronbach alfa; • Mean;
• Standard deviation; • Lowest & highest scores;
• Original paper authors, original paper year, original journal.
From those 90 SUS, 260 records were obtained to be assessed as Original Scale
Development Studies (OSDS), that is, these were articles that had originated scales that
20 Regarding the eligibility of these OSDS, a new criterion emerged. We would only work with articles that had been used at least once besides the moment of publication, as lower that that would have little significance.
From the 260 records, 176 records were excluded because they had only been used at the moment of publication or once besides the original publication.
Also, 4 texts were not available in English, thus also excluded, as the authors were not comfortable with other foreign language, and to allow future investigation.
Moreover, 26 articles were not included in this research because their original text was not available. In some cases, these articles were several decades old, were originally from books or had been, for example, unpublished doctoral thesis, which obviously hindered their acquisition.
This led us to a final number of 54 records included in qualitative synthesis, which translated into 64 original scales, as previously explained one article can be can contain more than one scale.
Again, some information was extracted from these scales: • Original paper authors;
• Original paper year;
• Original journal where it was published;
• Type (organizational characteristics, individual characteristics, expatriation process, other);
• Number of dimensions;
• Number of items (originally) in the used dimension; • Rating (likert, frequency, semantic, continuous).
274 citations of the original scales were obtained from those 64 original scales. More
21 Image 2 – PRISMA Flowchart
To analyze and decompose those 64 OSDS, we used previous validated studies.
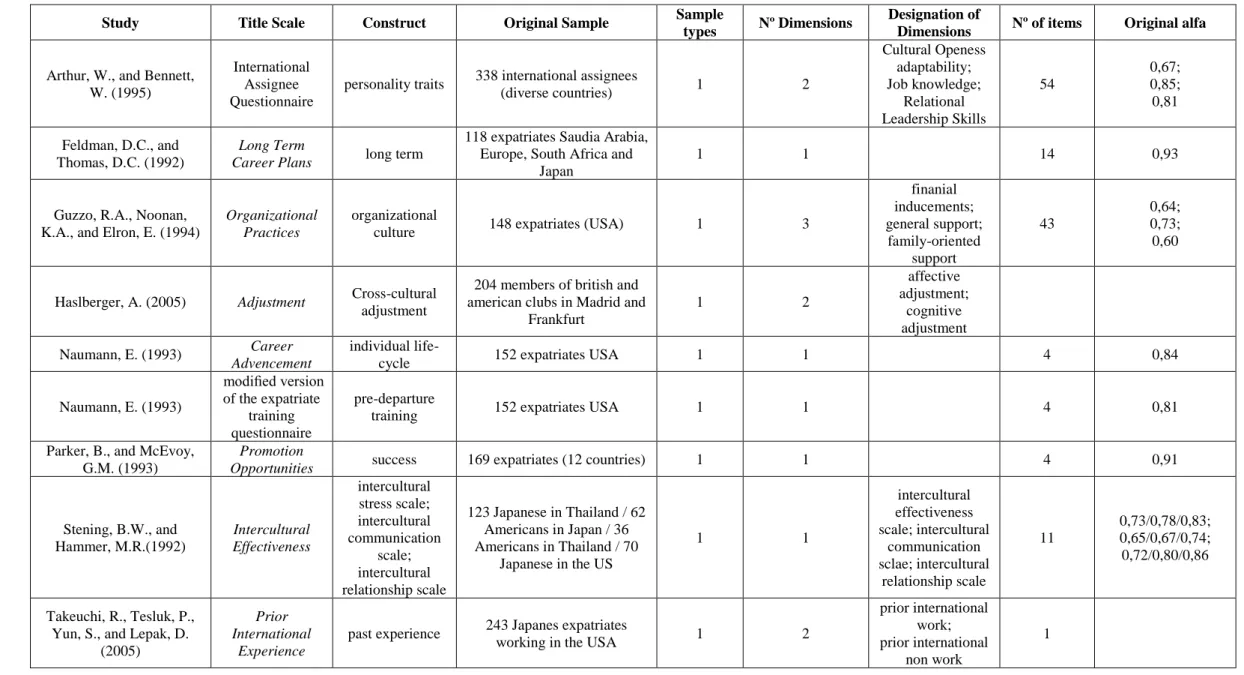
The basic characteristics of each study can be found on Table 1, which is based on Mahmood (2017) systematic review of self-efficacy scales of students’ information literacy skills. This table contains the author and year when the scale was published, the title of the scale – when this variable didn’t exist we created our own, in these cases in can be found in italic -, the construct, based on Gonzalez-Loureiro et al. (2015) dictionary of descriptors and keywords about acculturation and overseas assignments, the original sample, including nationality (in some cases it was inferred from the country of origin of the authors), the number and designation of its dimensions (if applicable) and items of the scale, and finally its original alpha (between samples “/” was used for separation and “;”, between dimension).
The purpose of this table is too allow a fast identification of similar studies, therefore it is sorted in alphabetically order, by this variable.
Table 1: basic characteristics of each study, based on Mahmood (2017)
Study Title Scale Construct Original Sample Sample
types Nº Dimensions
Designation of
Dimensions Nº of items Original alfa
Arthur, W., and Bennett, W. (1995)
International Assignee Questionnaire
personality traits 338 international assignees
(diverse countries) 1 2 Cultural Openess adaptability; Job knowledge; Relational Leadership Skills 54 0,67; 0,85; 0,81 Feldman, D.C., and Thomas, D.C. (1992) Long Term
Career Plans long term
118 expatriates Saudia Arabia, Europe, South Africa and
Japan
1 1 14 0,93
Guzzo, R.A., Noonan, K.A., and Elron, E. (1994)
Organizational Practices
organizational
culture 148 expatriates (USA) 1 3
finanial inducements; general support; family-oriented support 43 0,64; 0,73; 0,60
Haslberger, A. (2005) Adjustment Cross-cultural adjustment
204 members of british and american clubs in Madrid and
Frankfurt 1 2 affective adjustment; cognitive adjustment Naumann, E. (1993) Career Advencement individual
life-cycle 152 expatriates USA 1 1 4 0,84
Naumann, E. (1993) modified version of the expatriate training questionnaire pre-departure
training 152 expatriates USA 1 1 4 0,81
Parker, B., and McEvoy, G.M. (1993)
Promotion
Opportunities success 169 expatriates (12 countries) 1 1 4 0,91
Stening, B.W., and Hammer, M.R.(1992) Intercultural Effectiveness intercultural stress scale; intercultural communication scale; intercultural relationship scale 123 Japanese in Thailand / 62 Americans in Japan / 36 Americans in Thailand / 70 Japanese in the US 1 1 intercultural effectiveness scale; intercultural communication sclae; intercultural relationship scale 11 0,73/0,78/0,83; 0,65/0,67/0,74; 0,72/0,80/0,86 Takeuchi, R., Tesluk, P., Yun, S., and Lepak, D.
(2005)
Prior International
Experience
past experience 243 Japanes expatriates
working in the USA 1 2
prior international work; prior international
non work
23
Takeuchi, R., Yun, S., and Russell, J.E.A.(2002) Intention to return early permature termination 170 Japanese expatriates working in the US with
spouses
1 1 3 0,81
Takeuchi, R., Yun, S., and Russell, J.E.A.(2002) Language Proficency pre-departure training 170 Japanese expatriates working in the US with
spouses
1 1 5 0,97
Dickmann, M., and Mills,
T. (2010)(2010) Career Capital
individual life-cycle
348 people who moved to
london 3 16 Adler(1986) Interest in an international career seeking
opportunities 1129 MBA students USA 4 1 36 0,85
Amatea, E.S., Cross, E.G., Clark, J.E., and Bobby,
C.L(1986) Life Role Salience Scales commitement to assignment & family context 434 undergraduate student USA 4 2 Marital role commitment; Occupational role commitment 15 0,49; 0,58
Ang, S., van Dyne, L., Koh, C., and Ng, K.Y(2007) Cultural Intellingence cultural intelligence 235 undergraduates USA / 358 undergraduates Singapore 4 4 Behavioural; Cognitive; Metacognitive; Motivational 20 0,82/0,87; 0,8/0,88; 0,76/0,70; 0,79/0,75 Baruch, Y., Budhwar, P.
S., & Khatri, N. (2007)
Academic
Satisfaction satisfaction 949 students UK and USA 4 1 6 0,9
Baruch, Y., Budhwar, P.
S., & Khatri, N. (2007) Adjustment
Cross-cultural
adjustment 949 students UK and USA 4 1 3 0,78
Baruch, Y., Budhwar, P.
S., & Khatri, N. (2007) Family Contact family context 949 students UK and USA 4 1 4 0,77
Baruch, Y., Budhwar, P. S., & Khatri, N. (2007)
Labour Market
Perceptions contextual factors 949 students UK and USA 4 2
Home labour market perception; Host labour market perception 5 0,7; 0,73 Briscoe, J.P., Hall, D.T., and DeMuth, R.F. (2006) Boundaryless Caree; Values-driven scale individual
life-cycle 561 MBA students USA 4 2
Boundaryless career; Protean career 13 0,87; 0,70 Button, S.B., Mathieu, J.E., and Zajac,
D.M.(1996)
Goal Orientation
individual
competencies 409 undergraduates USA 4 2
Learning goal orientation; Performance goal orientation 16 0,85: 0,77
24
Cable, D.M., and DeRue,
D.S.(2002) Person-job fit managerial resourcefulness 215 employees / 225 MBAs USA 4 2 demands ability; needs ability 3 0,91/0,92 Cleveland, M., Laroche, M., and Papadopoulos, N.(2009) Cosmopolitan Cosmopolitan 2015 respondents in eight countries (snowball initially
students)
4 1 6 0,86
Dreher, G.F., and Ash,
R.A. (1990) Mentoring
organizational competencies
320 business graduates working at least 35h/week
USA
4 1 18 0,95
Greenland, K., and Brown,
R. (1999) Categorization separation
125 british and 111 Japanese
students 4 3 interpersonal categorization; intergroup categorization; superordinate group categorization 11 0,59; 0,72; 0,64
Mael, F., and Ashforth, B.E(1992) Organization Identification organiz(s)ational (dynamic) competencies
297 all male college students
USA 4 1 6 0,87
Mael, F., and Ashforth, B.E(1992) perceived organizational prestige measure organiz(s)ational (dynamic) competencies
297 all male college students
USA 4 1 8 0,77
Mol, S.T., Born, M., Willemsen, M.E., van der Molen, H.T., and Derous,
E. (2009) Expatriation Willingness motivation 299 master students Netherlands 4 1 7 0,87 Mol, S.T., Born, M., Willemsen, M.E., van der Molen, H.T., and Derous,
E. (2009)
Language Ability pre-departure training
299 master students
Netherlands 4 1 1 one item
Porter, L.W., Steers, R.M., Mowday, R.T., and Boulian, R.V.(1974) Organizational Commitment Commitment to the organization 60 psychiatric technician trainees USA 4 1 15 .82 to .93 across the four time periods.
Rousseau, D.M.(1990)
Psycological Contract Fullfilment
feeling 224 MBA students who had
accepted job offers (USA) 4 2
relational psycological contract fullfillment; transactional psycological 11
25
contract fullfillment Russell, D., Peplau, L.A.,
and Cutrona, C.E.(1980)
Revised UCLA
loneliness scale maladjustment
162 students /237 students USA 4 2 emotional loneliness; social loneliness 20 0,94 / 0,94
Saucier, G.(1984) Mini-markers personality traits
489 college students / 132 community-college students /
320 college students / 316 peers / 205 students / 187 college students (USA)
4 4 extraversion; agreeacleness; conscientiousness; emotional stability; intellect, openess or imagintation 40
Van der Zee, K.I., and Van Oudenhoven, J.P. (2000)
Emotional
Stability Harmony
84 students / 173 students Netherland, American,
Belgian, German, and Moroccan 4 4 emotional stability; flexibility; open mindedness; social initiative 91 0,7; 0,85; 0,75; 0,87
Van Dyne, L., Ang, S., and Koh, C.(2008)
Cultural Intellingence
cultural
intelligence 576 students Singapore 4 4
behaviour; cognitive; metacognitive; motivational 20 0,83; 0,85; 0,71; 0,75 Ong, A.S.J., and Ward,
C.(2005) Social Support
organiz(s)ational
support 426 international participants 5 2
emotional social support; instrumental social
support
18 0,93
Shaffer, M.A., and
Harrison, D.A(2001) Adjustment
Cross-cultural adjustment 221 expatriate spouses (37 countries) 8 3 cultural adjustment; interactional adjustment; personal adjustment 12 0,89; 0,88; 0,92 (expta) / 0,89 (spouse)
Black, J.S(1988) Adjustment Cross-cultural
adjustment 67 expatriate managers USA 9 3
general adjustment; interactional adjustment; work adjustment 11 0,78; 0,83; 0,80
Black, J.S(1988) Pre departure knowledge
pre-departure
26
Manev, I.M., and
Stevenson, W.B(2001) Social Network social networking 203 managers (41 counties) 9 2
expressive ties; intrumental ties 4 0,752; 0,734 Greenhaus, J. H., Parasuraman, S., & Wormley, W. M.(1990) Career Satisfaction satisfaction 828 manager-supervisor pairs USA 10 1 5 0,88 Kraimer, M.L., and Wayne, S.J.(2004) POS organiz(s)ational support 230 expatriate/supervisor dyads (USA) 10 3 adjustment; career; finance 14 0,87; 0,88; 0,92 Kraimer, M.L., and
Wayne, S.J.(2004) Performance Performance
230 expatriate/supervisor dyads (USA) 10 2 contextual; task 9 0,84; 0,86 Kraimer, M.L., Wayne, S.J., and Jaworski, R.A.(2001)
Performance Performance 213 expatriate/supervisor
dyads (USA) 10 2 contextual; task 6 0,81; 0,81 Moorman, R.H.(1991) Procedural Justice organizational competencies
225 employee and managers
dyads USA 10 2 formal processes; interactional justice 13 0,93; 0,94 Wayne, S.J., Shore, L.M.,
and Liden, R.C. (1997) Turnover
premature
termination 252 leader-member dyad USA 10 1 5 0,89
Clugston, M., Howell, J.P.,
and Dorfman, P.W.(2000) Collectivism socio-cultural
156 employees public agency
USA 11 1 6 0,77
Eisenberger, R., Huntington, R., Hutchinson, S., and Sowa,
D. (1986)
survey of POS organiz(s)ational
support 361 employees USA 11 1 36 0,97
Hackman, J.R., and Oldham, G.R. (1975)
Job diagnostic
survey giving task help 658 employees (USA) 11 2
Attitudes task;
Job autonomy 75
0,59; 0,66 Heneman, H.G., and
Schwab, D.P(1985) Compensation Compensation 1980 nurses (USA) 11 3
benefits ; pay level; raises 18 0,95; 0,95; 0,81 Hom, P.W., and Griffeth,
R.W. (1981)
Turnover Intentions
premature
termination 244 nurses USA 11 3 6 0,96
Miller, V.D., Allen, M., Casey, M.K., and Johnson,
J.R.(2000) Organization Identification Questionnaire organiz(s)ational (dynamic) competencies
113 white collars / 110 blue
collars / 86 blue collar USA 11 1 12 0,95/0,95/0,88
Mitchell, T.R., Holtom, B.C., Lee, T.W., Sablynski, C.J., and Erez,
M(2001) Organizational Embededness organiz(s)ational (dynamic) competencies
177 grocery syore workers /
232 hospital employees USA 11 6
links on job; fit off job; sacrifice on job;
links off job;
27
fit on job; sacrifice off job Morrison, E.W.(1993) Role Info job
characteristics 240 accountants (USA) 11 3 5
Netemeyer, R.G., Boles, J.S., and McMurrian, R.
(1996)
Work-Family
Conflict family context
182 teachers and administrators / 162 small business owners / 186 salespeople (USA) 11 6 Behaviour FW; Strain FW; Time FW; Behaviour WF; Strain WF; Time WF 21 0,86/0,83/0,89; 0,88/0,89/0,88
Nijssen, E.J., and Douglas,
S.P.(2008) Foreign Contacts socialization 191 consumers Netherlands 11 1 3
Paterson, J.M., Green, A., and Cary, J.(2002)
Organizational Justice
organizational competencies
143 trade union workers / 81 trade union workers /13 trade union workers (New Zeland,
Australia) 11 2 interactional justice; procedural justice 23 0,91 /0,94/0,95; 0,93/0,94/0,95 Rizzo, J.R., House, R.J.,
and Lirtzman, S.I.(1970) Role Ambiguity
job characteristics
199 central office and main plant personnel / 91 reserach
and engineering personnel (USA)
11 1 15 0,780/0,808
Rizzo, J.R., House, R.J.,
and Lirtzman, S.I.(1970) Role Conflict role conflict
199 central office and main plant personnel / 91 reserach
and engineering personnel (USA)
11 1 15 0,816/0,820
Chen, C.C., Choi, J., and
Chi, S.C. (2002) Compensation Compensation 161 local chinese employees 12 3
Compensation advantage; compensation disparity; perceived compensation fairness 5 0,91; 0,95; '---
Bae, J., Chen, S. and
Lawler, J.J(1998) HRM strategy stretegy
138 and 52 individuals with principal responsibility for HRM, in a random sample of
firms in Korea and Taiwan
13 4 Employee influence; HR flow; Reward Systems; work systems 37 0,74/0,73; 0,88/0,72; 0,73/0,73; 0,71/0,62 Harvey, M.G.(1995) Intercultural Communication Training pre-departure
training 118 SHRM members (USA) 13 2
Home intercultural communication
training;
28 target intercultural communication training Morris, M.H., Davis, D.L., and Allen, J.W(1994) Corporate Entreperneurship Entrepreneurial orientation
252 marketing managers USA / 225 marketing, R&D, administration South Africa/
25 HR managers Portugal 13 1 12 0,59/0,70/0,69 Carlson, D.S., Kacmar, K.M., and Williams, L.J.(2000) Work-Family
Conflict-Scale family context
225 full time workers
(snowball) USA 14 6 Behaviour FW; Strain FW; Time FW; Behaviour WF; Strain WF; Time WF 18 0,85; 0,78; 0,87; 0,85; 0,79; 0,87
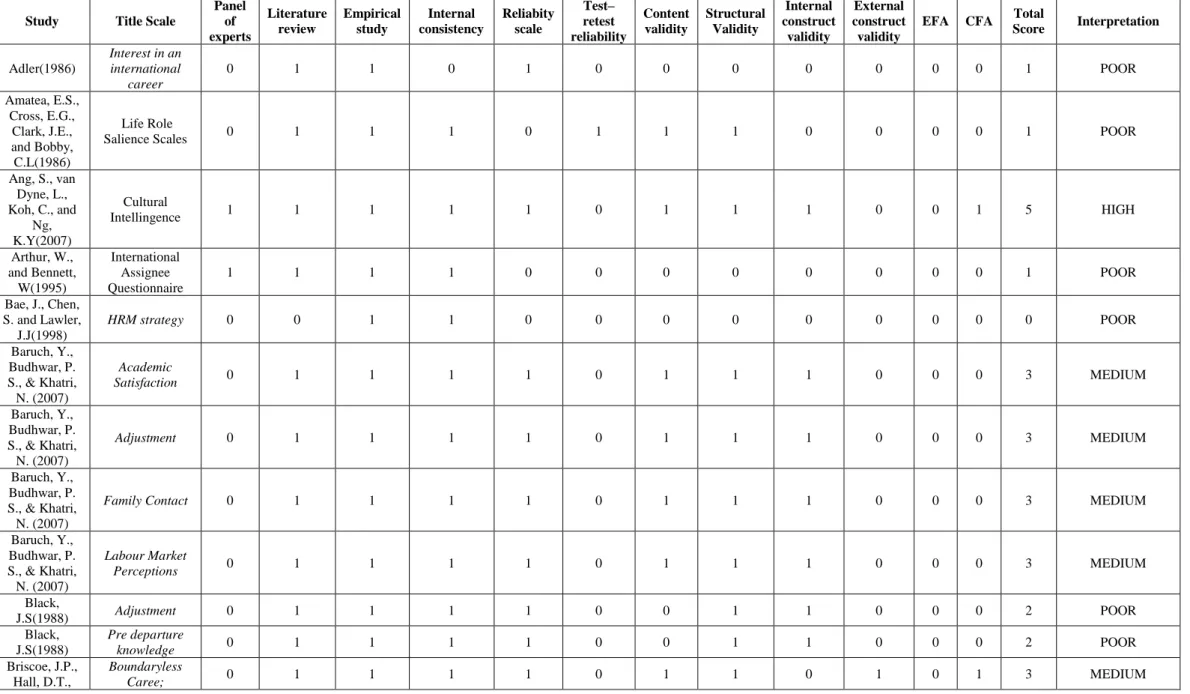
29 For further detail about each of the scales Table 2 was prepared. In it the psychometric characteristics of the scale can be found. The structure was based on Cyril, Smith & Renzaho (2015) evaluation of the methodological quality of empowerment measures. It includes three broad dimensions: item development, reliability and validity. Except if indicated otherwise “1” stands for reported/performed/existent, and “0” for not reported/ not performed/nonexistent.
Item development assessed if a panel of experts had been included, if literature review had been performed and if it could be considered an empirical study. Regarding reliability, it was evaluated if internal consistency and test-retest had been reported. In the case of reliability, it was only considered valid if the alpha was above 0,70 in all dimensions and all samples.
Finally, validity was intended to gage if content validity, structural, internal construct validity (predictive) and external construct validity had been included in the original studies.
Cyril, Smith & Renzaho (2015) definitions of said constructs were used, namely, content validity (if items measure the constructs of interest), structural validity (degree to which the scores on the scales reflect the dimensionality of the construct), internal construct validity (if relationships between scales are consistent with the hypothesis) and external construct validity (whether scales converge with and discriminate scores on other measures in the hypothesized way) )Mokkink et al, 2010).
The performance of exploratory and confirmatory analysis was also checked.
The six main variables were used to qualify the scales: panel of experts, reliability content validity, internal construct validity (predictive), exploratory and confirmatory analysis. Scores range from 0 to 6 and the classification goes as follows: less than 2 criteria met Poor quality; 3 to 4 Medium quality; 5 or more High quality.
Table 2: psychometric characteristics of the scale, based on Cyril, Smith & Renzaho (2015) Study Title Scale
Panel of experts Literature review Empirical study Internal consistency Reliabity scale Test– retest reliability Content validity Structural Validity Internal construct validity External construct validity
EFA CFA Total
Score Interpretation Adler(1986) Interest in an international career 0 1 1 0 1 0 0 0 0 0 0 0 1 POOR Amatea, E.S., Cross, E.G., Clark, J.E., and Bobby, C.L(1986) Life Role
Salience Scales 0 1 1 1 0 1 1 1 0 0 0 0 1 POOR
Ang, S., van Dyne, L., Koh, C., and Ng, K.Y(2007) Cultural Intellingence 1 1 1 1 1 0 1 1 1 0 0 1 5 HIGH Arthur, W., and Bennett, W(1995) International Assignee Questionnaire 1 1 1 1 0 0 0 0 0 0 0 0 1 POOR Bae, J., Chen, S. and Lawler, J.J(1998) HRM strategy 0 0 1 1 0 0 0 0 0 0 0 0 0 POOR Baruch, Y., Budhwar, P. S., & Khatri, N. (2007) Academic Satisfaction 0 1 1 1 1 0 1 1 1 0 0 0 3 MEDIUM Baruch, Y., Budhwar, P. S., & Khatri, N. (2007) Adjustment 0 1 1 1 1 0 1 1 1 0 0 0 3 MEDIUM Baruch, Y., Budhwar, P. S., & Khatri, N. (2007)
Family Contact 0 1 1 1 1 0 1 1 1 0 0 0 3 MEDIUM
Baruch, Y., Budhwar, P. S., & Khatri, N. (2007) Labour Market Perceptions 0 1 1 1 1 0 1 1 1 0 0 0 3 MEDIUM Black, J.S(1988) Adjustment 0 1 1 1 1 0 0 1 1 0 0 0 2 POOR Black, J.S(1988) Pre departure knowledge 0 1 1 1 1 0 0 1 1 0 0 0 2 POOR Briscoe, J.P., Hall, D.T., Boundaryless Caree; 0 1 1 1 1 0 1 1 0 1 0 1 3 MEDIUM