High quality silicon ribbons for solar cells
152
0
0
Texto
(2)
(3) . UNIVERSIDADE DE LISBOA FACULDADE DE CIÊNCIAS. High Quality Silicon Ribbons for Solar Cells. Doutoramento em Sistemas Sustentáveis de Energia. José Mário da Costa Pó. Tese orientada por: Professor Doutor Jorge Maia Alves. Júri: Presidente: ● Doutor João C. C. Catalão Fernandes Vogais: ● Doutor Roberto Carlos Marçal Gamboa ● Doutor António Jorge Duarte de Castro Silvestre ● Doutor João Manuel de Almeida Serra ● Doutor Miguel Centeno da Costa Ferreira Brito ● Doutor Jorge Augusto Mendes de Maia Alves. Documento especialmente elaborado para a obtenção do grau de doutor Fundação para a Ciência e a Tecnologia, SFRH/BD/51746/2011. 2017.
(4) . .
(5) Acknowledgements To pursue this work a large spectrum of disciplines was involved: from numerical simulation and modelling to experimental work in the fields of applied physics and chemistry, mechanical prototyping, and power electronics. Carrying such a multidisciplinary approach was fundamental to achieve the results here shown during the 4 years of research. However, none of this work was possible without the contribution of several individuals and entities, which I would like to acknowledge. Firstly and foremost, I would like to express my gratitude to my supervisor Prof. Jorge Maia Alves. I thank you for inviting me to work on this thesis, for your guidance, good judgement, ideas and friendship throughout its development. Even though your time was limited, you’ve accompanied me throughout this work always with tranquility and a smile. The work here presented was done in collaboration with a start‐up company SDSIL – Investigação e Desenvolvimento de Soluções Solares, Lda., which had the purpose of making a transition of the SDS process from a laboratory scale to a pilot industrial scale. I would like to acknowledge the SDSIL team great contribution, in particular to Professor António Vallêra, who I appreciate for his scientific council and creativity, for his input in most of the systems conceived during this dissertation, and also for his enthusiasm during the entire process. I also thank Dr. Pedro Sousa, who helped me during the crystallization furnace assembly in several technical matters, as well as during the residual stress measurements. I’m very grateful to Professor Miguel (Sr.) Centeno Brito, ever since I joined the energy group as an undergrad student his guidance and friendship has been a fundamental seed for my professional and personal growth. I also thank his great contribution to this work in what concerns the implementation of the model for plastic deformation. Furthermore, I thank him for the opportunity to work on side projects related to the solar campus at FCUL, especially in the collaboration with Circadian Solar Ltd, as well as in project SEGSOL, in which I had the chance to supervise undergraduate research. I am thankful to the MIT Portugal Program coordinator of Sustainable Energy Systems at FCUL, Professor João Serra for handling the bureaucracy during the entire the doctoral program. I am also thankful for his help in laboratory technical matters, and for sending some of the processed samples to Professor Kakimoto from the Research Institute for Applied Mechanics, Kyushu University, Japan, whom I also thank for the X‐ray diffraction measurements which support the results of this thesis. One of the most crucial contributions to this thesis was done by Ivo Bernardo and Hélder Reis. Ivo developed the electronics part of the interconnection between the various components external to the prototype, and Hélder developed the software that controls the various components. I’m indebted to both for their contribution, and especially for their good mood during the system conception, no matter for how long we were working. 1 .
(6) I appreciate the collaboration of my colleagues with whom I shared a lively open space and accompanied me throughout this work on a daily basis. I am especially thankful to David Pêra, for all the helpful discussions in the matter of computer simulation with Solidworks, and to Ivo Costa for all his help and insight in the laboratory. Besides their important inputs to this work I am also grateful for their friendship. To Sara Freitas with whom I had the pleasure to share some of my side projects and achieved gratifying results. I would like to thank Prof. Killian Lobato for sharing his insight in photoluminescence imaging as well as for setting up the system which allowed the photoluminescence measurements here presented. I also thank Dr. José Silva, for all the helpful discussions that enlightened some of the results here presented and for his unconditional smile. To Mr. Carlos Martins from CMVB – Criação de Protótipos, who followed the technical designs and manufactured with great precision most of the aluminum components used for the furnace parts, I would like to address my appreciation for his work. In the same way I am thankful to Ricardo Pereira from the FCUL workshop, for his work in several furnace parts, whose patience and skill was constantly tested by the designs proposed, especially during the developed of the furnace translation system. I would like to acknowledge Telmo Nunes from the Center of Electronic Microscopy, FCUL, for his indispensable contribution in SEM measurements and metallization of components by sputtering. Some of the results here presented were done by microscopic observation, which was only possible with the good will of Prof. Olinda Conde for facilitating the access to the equipment. The SDS room suffered several alterations during this work, which were done effectively, for that I am especially grateful to José Fernandes and the faculty technical services for their work. Due to the nature of the work pursued, this dissertation was accompanied by a considerable amount of failures which were better copped with the support of my friends and family. I am thankful that I have met some brilliant individuals with whom I had the privilege to make music. For all the joy and moments that accompanied me during the development of this thesis I am grateful to the 24 Robbers Swing band. I would also like to particularly thank my brüder Tinis whom I am deeply grateful to share my burdens with, Dr. Bilhas for some of the helpful discussions regarding this work and life in general, and Luzia for all the entropy. I am also most deeply thankful to my parents who always supported my decisions and made it possible that I followed my path. Lastly, I would like to acknowledge the funding I received from FCT – Fundação para a Ciência e Tecnologia, under the doctoral grant SFRH/BD/51746/2011 and the MIT Portugal Program on Sustainable Energy Systems. Thanks to all! . 2 .
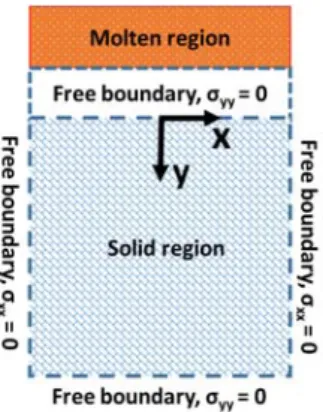
(7) Abstract Solar Photovoltaic (PV) is one of the most promising solutions for electrical energy production in a sustainable way. Currently the PV market is dominated by crystalline silicon solar cells, and the dissemination of this technology in a global scale has been strongly limited by the high cost of the devices. Si Ribbon technologies have the advantage of dramatically increase the material yield over the traditional Si growth techniques by eliminating kerf losses. However, poor electrical performance due to the high defect density resulting from both impurity content and dislocations generated by the heterogeneous temperature field during crystal growth have been in the past a limitation for this type of technologies. The Silicon over Dust Substrate (SDS) process has the potential to reduce material consumption and achieve higher purity substrates than conventional ribbon processes. However it is still limited by the high defect density generated by thermal stresses that occur during crystallization by Zone Melting Crystallization (ZMC). The aim of this work was firstly to develop a new ZMC furnace concept that permitted improving the performance and size of the Si ribbon grown via ZMC, and secondly to develop a numerical model to understand the thermal stresses and dislocation dynamics during the growth for the conditions obtained with the developed furnace concept. The furnace was also envisioned to crystallize SDS pre‐ribbons produced via CVD for a pilot industrial scale. To develop the new ZMC apparatus a numerical‐experimental approach was pursued, in which Computational Fluid Dynamics Finite Element Analysis (CFD‐FEA) was performed in a 3D Computational Aided Design (CAD) environment. The final ZMC furnace CAD model was then subjected to CFD‐FEA under different thermal conditions, and a study was conveyed to estimate the ribbon thermal stresses and dislocation density during crystal growth by ZMC. Furthermore, the Hassen‐Alexander‐Sumino (HAS) model was used to compute the final dislocation density profile of the ribbon. The final ZMC concept includes as main innovations the possibility to control the temperature gradients in the heating and cooling regions, the use of diode laser bars to produce the floating molten zone with width >50mm, and a translation system to transport the sample that allows continuous operation at high temperatures with low impurity sources. With this furnace the ribbon crystallization area was effectively upsized, reaching processed samples with areas of about 55x95cm2, with no cracking behavior, and no buckling. However, the characterization of the recrystallized test samples revealed that the dislocation density is still in the range of 105 #/cm2, which is explained by the numerical model results. The model estimates that stresses in the region adjacent to the molten zone of the ribbon are still considerably higher than the yield stress, where dislocations multiply and reach their maximum very rapidly, requiring further smoothing of the temperature profile. An agreement was found between both modelled and measured results in what concerns the dislocation densities profiles, since the same trend in their distribution is verified. Additionally, both measured and modelled dislocation densities are in the range of 105 #/cm2, with . 3 .
(8) a slight offset that can be traced back to the model approximations, or the experienced heterogeneous laser power distribution not contemplated in the CFD‐FEA. Keyworks: Photovoltaic, Silicon Ribbon, Zone molten crystallization, Thermal stress, Dislocation density . 4 . .
(9) Resumo A energia solar fotovoltaica (PV) representa uma das soluções mais promissoras para produção de energia elétrica de forma sustentável. Atualmente o mercado PV é dominado por células solares baseadas em silício cristalino, e a disseminação desta tecnologia numa escala global tem sido fortemente limitada pelo custo elevado dos dispositivos. As tecnologias de produção de substratos para produção de células solares directamente na forma de fitas de Si têm a vantagem de aumentar dramaticamente o rendimento do material face às técnicas tradicionais de crescimento de Si através da eliminação das perdas devidas ao corte. No entanto, o fraco desempenho elétrico devido à alta densidade de defeitos resultante de impurezas incorporadas, bem como das deslocações criadas pelo campo de temperaturas heterogéneo durante a fase de crescimento têm sido no passado um factor limitante para este tipo de tecnologias. O processo Silicon over Dust Substrate (SDS) tem o potencial de reduzir o consumo de material e de obter substratos de pureza mais elevada do que os processos de fitas convencionais, estando no entanto ainda limitado pela alta densidade de defeitos gerada pelas tensões de origem térmica que ocorrem durante a fase de cristalização a partir de zona fundida Elétrica (Zone Melting Crystallization – ZMC). Esta tese teve como objetivo desenvolver um novo conceito de forno de crescimento por ZMC que possibilite melhorar o desempenho e tamanho das fitas de Si crescidas por ZMC, bem como o desenvolvimento de um modelo numérico para compreender as tensões de origem térmica e a dinâmica de criação de deslocações durante a fase de crescimento para as condições obtidas neste novo forno. O forno também foi desenvolvido de maneira a poder ser utilizado na cristalização de pré‐fitas SDS para uma escala piloto industrial. O desenvolvimento do novo sistema de ZMC foi feito com base no método numérico‐experimental, em que se recorreu a ferramentas de computação de dinâmica de fluidos por análise de elementos finitos (Computational Fluid Dynamics Finite Element Analysis – CFD‐FEA) num ambiente 3D de desenho técnico assistido por computador (Computational Aided Design – CAD). O desenho CAD final do forno foi sujeito a simulações para diferentes condições térmicas, com as quais se estimaram as tensões de origem térmicas na fita e a densidade de deslocações durante o processo de crescimento por ZMC. O modelo Hassen‐Alexander‐Sumino (HAS) foi utilizado para calcular o perfil final da densidade de deslocações da fita. O forno para crescimento de fitas por ZMC desenvolvido inclui, como inovações principais, a possibilidade de controlar os gradientes de temperatura nas zonas de aquecimento e arrefecimento, o uso de barras de díodos laser para produzir uma zona fundida flutuante com largura superior a 50mm, e um sistema de translação para transportar a fita que permite uma operação contínua a altas temperaturas com reduzidas fontes de contaminação. Com este forno a área de cristalização foi efetivamente aumentada, alcançando‐se amostras processadas com áreas aproximadas a 55x95cm2, sem quebras nem curvatura. Contudo, a caracterização das amostras revelou que a densidade de deslocações está na ordem de 105 #/cm2, valor que é explicado pelos . 5 .
(10) resultados do modelo. O modelo estima que as tensões na região adjacente à zona fundida são consideravelmente mais altas que a tensão de limite elástico onde as deslocações se multiplicam e atingem o valor máximo a uma taxa muito rápida, sendo necessário no futuro utilizar um perfil térmico com mais suave. Foi encontrada uma correlação entre os resultados do modelo e os resultados experimentais relativamente ao perfil de densidade de deslocações, tendo em conta que a mesma tendência é observada. Adicionalmente, os resultados estão na mesma ordem de grandeza, existindo no entanto um ligeiro afastamento que pode estar relacionado com as aproximações do modelo ou com a radiação heterogénea proveniente do sistema de laser que não é contemplado nas simulações. Palavras‐chave: Fotovoltaico, Fita de silício, Zona fundida, Tensões térmicas, Densidade de deslocações . 6 . .
(11) Contents 1 . 2 . Introduction ................................................................................................................................ 9 1.1 . Background and overview ................................................................................................... 9 . 1.2 . Alternative silicon growth methods for solar cell applications ......................................... 14 . 1.2.1 . Gaseous phase growth .............................................................................................. 15 . 1.2.2 . Liquid phase growth .................................................................................................. 15 . 1.2.3 . Silicon on Dust Substrate process ............................................................................. 18 . 1.3 . Zone Melting Crystallization .............................................................................................. 19 . 1.4 . Summary ........................................................................................................................... 22 . 1.5 . Thesis outline .................................................................................................................... 22 . 1.6 . References ......................................................................................................................... 23 . Prototype Crystallization Furnace: Design, Development and Modelling ................................ 27 2.1 . 2.1.1 . Stress and strain notions ........................................................................................... 27 . 2.1.2 . Thermo‐mechanical properties of crystalline silicon ................................................ 30 . 2.2 . Prototype ZMC furnace definition .................................................................................... 33 . 2.2.1 . Computational‐experimental approach .................................................................... 33 . 2.2.2 . Concept and Parameters definition .......................................................................... 36 . 2.2.3 . Components design and development ..................................................................... 44 . 2.3 . ZMC Furnace components development and testing ....................................................... 63 . 2.3.1 . Chiller and components cooling ................................................................................ 64 . 2.3.2 . Furnace atmosphere ................................................................................................. 65 . 2.3.3 . Temperature control ................................................................................................. 66 . 2.3.4 . Laser system and molten zone formation ................................................................. 70 . 2.3.5 . Ribbon movement ..................................................................................................... 74 . 2.3.6 . Furnace Experiment Studio ....................................................................................... 77 . 2.4 . 3 . Thermo‐mechanical considerations .................................................................................. 27 . Furnace and ribbon simulation ......................................................................................... 78 . 2.4.1 . CFD‐FEA validation .................................................................................................... 79 . 2.4.2 . Thermal stress analysis.............................................................................................. 81 . 2.4.3 . Dislocation density modelling ................................................................................... 87 . 2.5 . Conclusions........................................................................................................................ 96 . 2.6 . References ......................................................................................................................... 97 . ZMC Furnace characterization ................................................................................................ 103 7 .
(12) 3.1 . Samples and preparation methods ................................................................................. 103 . 3.2 . Characterization techniques ........................................................................................... 104 . 3.2.1 . Thickness variation measurement .......................................................................... 104 . 3.2.2 . Lifetime measurement ............................................................................................ 105 . 3.2.3 . Residual Stress measurement ................................................................................. 107 . 3.2.4 . Dislocation density measurement .......................................................................... 112 . 3.3 . Sample processing and experimental results .................................................................. 115 . 3.3.1 . Initial tests ............................................................................................................... 115 . 3.3.2 . Molten zone formation and laser stimulation ........................................................ 118 . 3.3.3 . Temperature gradient ............................................................................................. 122 . 3.3.4 . Crystallization velocity ............................................................................................. 128 . 3.4 . Comparison: Experimental vs Modelled results ............................................................. 133 . 3.5 . Conclusions...................................................................................................................... 134 . 3.6 . References ....................................................................................................................... 135 . 4 . Final conclusions and future work .......................................................................................... 139 . 5 . List of Acronyms ...................................................................................................................... 141 . 6 . Figures List ............................................................................................................................... 142 . 7 . Tables list ................................................................................................................................. 148 . . . 8 . .
(13) 1 Introduction Forced by many factors, a shift in energy resources consumption is currently taking place on a global scale. The deployment of sufficient energy alternatives in a worldwide scale to avoid environmental and economic crisis is a challenging task. Of the many presented solutions, Solar Photovoltaic (PV) conversion is one of the most promising solutions for electrical energy production in a sustainable way. Solar PV technologies use the sunlight to generate electricity, thus presenting an enormous potential for a clean way of producing electrical energy, with a vast amount of resource well distributed worldwide. The development of alternative industrial processes to produce low cost PV devices with high performance and low material consumption is a major goal of the PV industry. To realize this goal new technical concepts and novelties, for different routes and processes, have to be continuously developed. This work aims to develop a novel method to produce high quality low cost silicon substrates for solar cell applications. In this chapter, an overview of the history of the solar PV industry and its most significant developments are presented. The most relevant solar cell principles are introduced, and silicon wafer production chain is described. Focus on the costs involved in the different steps of the production chain of silicon substrates for solar cell applications is also given, and some of the alternatives described. . 1.1 Background and overview It is well know that the principle by which PV devices operate is the absorption of photons and the generation of electron‐hole pairs. This conversion of light into electricity can be efficiently done in a p‐n junction produced in an appropriate semiconductor material. A great variety of semiconductor materials exists, the most used material for electronic devices is Silicon (Si), which is also the material that is most for the production of solar cells for terrestrial applications. The existence of a well‐developed microelectronics industry, and the correspondent advanced knowledge about Silicon properties and production methods, has a strong contribution to this fact, however due to Si abundance in the Earth’s crust, and its favourable energy band gap for solar photovoltaic conversion, Si is the most attractive semiconductor material to incorporate in PV devices [1.1]. The band gap energy of the semiconductor is one of the most important characteristics that define its maximum possible efficiency in PV conversion applications. This is due to the fact that the process of photon absorption in a semiconductor consists in the excitation of an electron from the valence band into the conduction band, leaving a hole in the valence band, and thus forming an electron‐ hole pair. The energy of the band gap, or energy gap (EG), of a semiconductor is the energy difference between the top of the valence band (EV) and the bottom of the conduction band (EC) [1.2]. In principle only photons with energy equal or greater than EG of the semiconductor may generate . 9 .
(14) electron‐hole pairs. Additionally, if the photon energy is greater than EG, the excessive energy received is lost and thermalized, releasing heat into the semiconductor lattice. As photons with less energy than EG of the semiconductor are not absorbed, they do not generate an electron‐hole pair, and therefore are not involved in the energy conversion process. The energy of a photon is given by, . λ. (1.1). where, h is Planck’s constant 4.135×10‐15eV.s, c the speed of light in vacuum 2.998×10⁸m/s, and λ is the wavelength in nm. We conclude that, if λG is the wavelength of a photon with energy EG, equal to the semiconductor band‐gap, only photons with λ< λG, are absorbed. For crystalline Silicon, at 300K, EG=1.12eV, and thus, λG = 1107nm [1.3]. Considering a polychromatic photon flux density characterized by a distribution function ф(λ), the fraction of power density that can be absorbed (Pabs) by a semiconductor of band gap EG is thus, . Φ λ. λ. Φ λ. (1.2). λ. and the fraction that can be converted into useful energy through the electron‐hole pair generation process is, . Φ λ. Φ λ. (1.3). λ. The results obtained using equations 1.2 and 1.3 are clearly dependent on the distribution function Φ (λ). Standard Test Conditions (STC) is used as a reference for the comparison and rating of PV devices: 1000W/m2 of broadband irradiance, with a spectral distribution according to the Air Mass (AM) 1.5 global spectrum, and a device temperature of 25˚C. Applying STC distribution function AM1.5 to equations 1.2 and 1.3, it is thus possible to determine the upper limit values of the useful, non‐absorbed and thermalized energy fractions that can be expected using a given semiconductor material characterized by an energy gap EG. These results are presented in Fig. 1.1 for a crystalline Si semiconductor, leading to the conclusion that if silicon is used as an absorber, one may expect that approximately 50% of the incoming solar power may be efficiently absorbed and be used to convert it into electricity, the other half being lost due to spectral mismatch. 38% will be lost by inefficient absorption and is thus thermalized, and the remaining 13% of the energy fraction will pass through the semiconductor without being absorbed. . 10 .
(15) Figure 1.1 Thermalized, useful, and non‐absorbed fractions of the AM1.5 spectral distribution for a crystalline Silicon semiconductor, calculations considering EG=1.12eV. . The figure plotted above represents an estimative of the optimal absorption considering the effect of Si energy band gap alone. Reflectivity on the semiconductor surface also has a part to play in the device losses which is not accounted. Furthermore, for the conversion of the absorbed fraction, other important mechanisms for the operation of a solar cell that contribute to decrease solar cells performance, such as the electrical and recombination losses. The efficiency limit for energy conversion of a semiconductor p‐n junction Si PV cell, taking into consideration all the known operating mechanisms, has been determined to be around 30% [1.4‐1.6]. If thermalization and non‐ absorption losses are overcome, by mechanisms such as photon up and down conversion, the theoretical energy conversion limit for a Si junction solar cell under non‐concentrated sunlight could go up to 47.6% and 38.6% for up and down conversion respectively [1.7‐1.9]. Important developments have been made to improve Si solar cells performance in the past. In Fig. 1.2 is shown the chronological overview of the world record evolution for laboratory cell efficiencies, for different technology families (Si based and others), which is continuously updated and compiled by the National Renewable Energy Laboratory (NREL). The most efficient silicon single junction solar cells ever made present 21.3% and 25.3% efficiency, for multi‐crystalline (mc), and single crystalline substrates respectively. Also, Si solar cells using hetero structures (HIT) technology, have reached an efficiency of 26.6%. . 11 .
(16) Figure 1.2 Evolution of the world record efficiencies of various types of laboratory cells [1.10] . In the early years of solar cell technology the only viable use of these devices was for space applications, such as satellites, where the high cost of the device was not an issue. This paradigm started changing after the first oil crises in the 70’s. The interest in Solar PV technologies as a terrestrial power source grew substantially, and led to a rapid growth of the solar cell industry and the development of a technological competition, as can be seen in Fig. 1.2. Some solar cell technologies emerged as potential cost reduction players, such as thin films. Nevertheless, the dominant process to make solar cells for terrestrial applications was, still is, and probably will be at least in a near future, a crystalline silicon wafer based processes. In Fig. 1.3 the evolution of global solar production breakdown by technology is presented for the latest years, showing that crystalline silicon PV technology currently holds a dominant worldwide market share. . 12 .
(17) . Figure 1.3 PV Market Share by cell technology [1.11] Most of the current available commercial solar cells use boron‐doped mono‐crystalline or multi‐ crystalline silicon wafers (c‐Si or mc‐Si). Silicon is thus the dominant semiconductor material for PV applications. In fact, in the early years of this technology, silicon wafers for solar cells were produced using the left overs of the microelectronic industry, since the Si grade quality required for solar cells is not as demanding as microelectronics. In its raw form, silicon exists as sand and quartz (SiO2). To be useful for semiconductor applications it must go under a very energy intensive and time consuming process. It must be refined to a very high purity level, and, for efficient devices, it must be in a crystalline form. Firstly, silicon in silicate or oxide form is reduced with the use of carbon electrodes at temperatures above 1900 ºC [1.12]. The resulting material melted and refined, resulting in the metallurgic silicon, with a purity of 98‐ 99% [1.12]. To further purify it, the metallurgic silicon reacts with HCl to form SiH4 and SiHCl3 gases. From these gases, using either the Siemens process by Chemical Vapor Deposition (CVD), or Fluidized Bed Reactor process, poly silicon is obtained with a purity of 99.9999% [1.12]. Finally, in the standard industry, this material is crystallized in a mono‐ or multi‐crystalline block or ingot. In recent years, the advances in the PV industry were strongly compromised by the availability of poly silicon [1.13]. From 1996 to 2007, the PV market exploded, with a growth rate of about 30% to 35% per year [1.14]. This strong demand increase drove the problem of poly silicon material shortage for silicon solar cells applications that is clearly reflected in the PV technology learning curve (see Fig. 1.4), that presents an anomalous increase in prices observed in the PV module at approximately 10 GW cumulative PV production. This PV module price increase, that was due to a shortage in the availability of poly silicon, marks an important shift in the PV industry, since it corresponds to the period when it was clearly understood that the PV industry could not depend anymore on the leftovers of the microelectronic industry, and that a production line of the so‐called Solar Grade Silicon (SGS) was needed [1.13], which led to further decrease in PV module price (see Fig 1.4). The data in Fig. 1.4 also shows that, since 1976, the module price per watt peak (Wp – output power under STC) fell 2 orders of magnitude with the increase in the production volume. . 13 .
(18) Figure 1.4 Learning curve for PV modules for the mid 1970’s to 2013 [1.15] . The disaggregated costs of the solar PV modules and silicon wafers, are displayed in Fig. 1.5. First of all it should be stressed that the highest contribution to module cost comes from the processes previous to the cell, more precisely, from the processes of transforming silicon into wafers, the base material where the remaining components of a solar cell are afterwards incorporated. The first reason for this lies in the fact that all processes that are actually most used to produce the crystalline silicon wafers, such as the Czochralski (CZ), Bridgman or the Block‐cast [1.16, 1.17], are energy intensive, because they require high temperatures (about 1500 ºC) to melt a large volume of silicon in a high purity crucible. Furthermore, these processes waste very high purity and quality material because after the process of crystallization in an ingot or block, the resulting silicon crystals must be sawed, using a saw that uses wires about the same thickness of the desired wafer thickness, and thus imposing a waste of about 50% of the material (commonly referred as kerf losses) [1.18]. . Figure 1.5 Cost distribution of the solar module and silicon wafers fabrication [1.17] . . 1.2 Alternative silicon growth methods for solar cell applications One of the pertinent solutions towards achieving a low cost/Wp, is finding an optimal way of eliminating material loss, while reducing the high amount of energy used in the crystallization process, without compromising the quality of the base material for the solar cell. To achieve this, . 14 .
(19) alternatives that short‐circuit the ingot and wafering path, have been presented, such as thin films, silicon ribbons and foils [1.19]. In this section, some alternative paths to produce and grow Si substrate materials for solar cells are presented, with a special focus on ribbon processes, and in particular the Silicon over Dust Substrate process. . 1.2.1 Gaseous phase growth The substrate material for the solar cell can be grown directly from silane or chlorosilane gases in a detachable or low‐cost substrate. For such procedure, Chemical Vapor Deposition (CVD) is used for depositing silicon on a substrate at high temperatures. Using a gaseous mixture of H2 and the precursor SiH4 or SiH, which is thermally decomposed at the hot surface of the substrate, Si layers of a few microns, 5 to 50 m, are deposited on a substrate that is prepared so that the deposited film is releasable onto a carrier substrate [1.20], see Fig. 1.6. Such technique is applied to produce thin films with an amorphous structure for solar cells. The amorphous structure presents a limitation towards the fabrication of efficient solar cells. Furthermore, using a substrate to support the film growth presents a source of contamination which either limits the film quality or increases costs by using substrates of high purity. . Figure 1.6 Gas‐phase wafer growth by CVD onto a releasable substrate [1.20] . 1.2.2 Liquid phase growth Growing substrates for solar cells from the melt directly into a planar form represents one of the paths to significant reduce the cost per Wp. Such processes achieve a crystalline structure by growing the crystal from the melt in a ribbon form, which is more suited for solar cell applications. The ribbon growth processes can be divided into either vertical or horizontal growth depending on the crystal pulling direction. The most mature methods of growing ribbons vertically are Edge‐. 15 .
(20) defined film‐fed growth (EFG) and String Ribbon (SR), and Ribbon Growth on a Substrate (RGS) for horizontal growth. The RGS technique (Fig. 1.7D) allows the fastest growth rates among these techniques, 600cm/min, consequently the throughput is also high 7500cm2/min [1.22]. However, it has the main limitation of using a substrate to support the crystal growth, and crystals produced with this technique also exhibit high carbon concentrations [1.21], which compromises quality. The most mature method of growing ribbons vertically is the EFG, a process that has already reached an industrial phase, achieving a total module production above 20 MWp [1.23]. However, the production of solar modules by Schott Solar using this technique ceased in 2009. As shown in Fig. 1.7A, in this method the lower part of the meniscus is formed and shaped by a graphite die, through which an octagonal silicon pipe is directly pulled from the melt at rates approximate to 1.7cm/min, which is then cut into slices. Due to the use of the graphite die a high carbon contamination is also seen in the resulting ribbons [1.23]. Other technique of growing ribbons vertically that reached an industrial stage is String Ribbon [1.24]. Companies such as Evergreen Solar and Solivo A. G. produced modules using cells made from substrates obtained by a SR process. For this method a slightly different approach than EFG is used as may be seen in Figure 1.7B: strings that are fed through the molten Si and provide edge support of the growing ribbon, which are used to pull the ribbon from the melt [1.25]. Si substrates obtained using SR method can be grown at 1 to 2 cm/min and exhibit low oxygen concentration, but still high carbon concentrations [1.25]. Another interesting vertical ribbon growth method is the Ribbon of a Sacrificial Template (RST) [1.26]. This method combines two of the previous concepts, the vertical growth direction is combined with the use of a substrate (Fig. 1.7D), which allows faster vertical growth rates, but carries the disadvantages of the vertical and horizontal techniques in terms of contamination. . 16 .
(21) Figure 1.7 Ribbon growth techniques schematics: (A) Edge‐defined film fed growth; (B) String Ribbon growth; (C) Ribbon growth on a substrate; (D) Ribbon on a Sacrificial Template growth schematics adapted from [1.28] . In Table 1, an estimation of the amount of Si feedstock that is used to fabricate 1Wp in gSi/Wp is shown for each ribbon growth method (RST process was not considered). Since the referred ribbon techniques grow crystals with a mc‐Si structure [1.27] techniques are compared with mc‐Si ingot values. It can be seen that a significant reduction in the Si feedstock per Wp produced is achieved when using Si ribbon growth processes. Table 1.1 Silicon feedstock usage per produced Wp, adapted from [1.28] . Material . Thickness [μm] . η [%] . gSi/Wp . mc-Si ingot . ~250 . 15 . 10.5 . EFG . 300 . 16 . 4.4 . SR . 300 . 16 . 4.4 . RGS . 300 . 13 . 5.4 . . 17 .
(22) Nevertheless, in ribbon growth processes, depending on the conditions, different crystallographic defect concentrations and distributions may be obtained. Also, grain size decreases in general with increasing ribbon pulling speed. One of the major drawbacks with ribbon silicon materials is their high defect density and generally higher contaminants concentration compared to directionally solidify multi‐crystalline silicon wafers [1.28]. Efforts are being made towards reduction of these impurities in ribbon growth technologies, which the works of G. Hanh extensively report. . 1.2.3 Silicon on Dust Substrate process The Silicon on Dust Substrate (SDS) process, developed at Instituto Dom Luiz, Faculdade de Ciências, Universidade de Lisboa, is a new approach to grow silicon ribbons for solar cells directly from a gaseous feedstock [1.29–1.32]. This process has been developed in the last decade on a laboratorial level and is presently meeting the challenge of industrialization. In this process, a self‐supporting silicon sheet produced directly from a silicon gaseous feedstock by a fast CVD step using gaseous Silane (SiH4), at high rate, low temperature (approximately 800ºC) and atmospheric pressure. The SiH4 is decomposed by the follow pyrolysis reaction, . →2. (1.4). The deposition of Si occurs on top of a thin silicon dust layer that is placed on a quartz plate. This deposition process guaranties high homogeneous nucleation rates of silicon nano‐particles with high purity, and at low temperatures, making it a relatively low costs. The resulting film has a nano‐ porous structure, which, after being detached from the dust layer, is self‐sustaining with thicknesses ranging from 300 to 400 µm. The remaining detached silicon dust acts as a sacrificial layer that can then be reused as bed for a new deposition. The CVD is done at atmospheric pressure and at low temperatures, which permits a fast deposition process. The drawback is that the resulting Si sheet is porous Si and as a very low nano‐crystalline quality, which is unsuitable for solar cell applications. Therefore, the porous sheet (designated as pre‐ribbon) must go through a crystallization process by float zone melting. Here an onsite doping step can be done by spraying the pre‐ribbon with boric acid [1.33]. After the crystallization process, the resulting sheet has multicrystalline structure that is suitable for use as a substrate for a solar cell (designated as ribbon). In Fig. 1.8, the SDS process flowchart is shown. . 18 .
(23) Figure 1.8 Silicon over Dust Substrate process schematics adapted from [1.32] This flowchart highlights the SDS process advantages. Firstly, the used substrate is made of high purity silicon produced inside the reactor, and therefore minimizes the sources of impurity from foreign materials and cost associated with the use of high purity substrates, such as quartz, that are usually employed in other Si film growth techniques. Furthermore, it has a low energy budget, since the fast CVD is performed at atmospheric pressure and low temperature. Lastly, the final Si ribbon is of high quality, since the crystallization process is made by float zone crystallization with in situ doping without any contact with foreign materials. On the SDS laboratorial proof of concept phase the CVD system worked on a continuous mode, with a deposition rate of about 20 μm/min, and constant advance speed of 10 mm/min. However, the first solar cells made using the produced substrates exhibited a 7.6% efficiency [1.34]. Most recent developments with a new CVD furnace foresee to obtain solar cells with 14% [1.35] efficiency, a value still low to obtain devices with a suitable cost/Wp. Also, the current crystallization system works only in batch mode. Further concept improvement and research are needed if a fully operational industrial pilot system is to be reached. From the similar techniques used to grow silicon ribbons for solar cells, it is known that, apart from impurity content, the main factor limiting the substrate quality is the high crystallographic defect density, namely dislocations, which are produced due to high thermal gradients during crystalline growth. A new zone melting crystallization furnace that allows minimizing the temperature field inhomogeneity during the crystal growth process, may unlock the potential of the SDS technique to produce low cost silicon sheets for solar cells with enough quality to produce high efficient devices. . 1.3 Zone Melting Crystallization In 1950, the Zone Melting Crystallization (ZMC) technique was introduced as a technique to produce crystalline thin films. This technique was patented by Leitz [1.36], and was used for both refining and purification processes. The basic principle, which was also applied in the present work, is quite simple: a localized molten zone is created by a focused energy beam and a scan is performed along . 19 .
Imagem
![Figure 1.3 PV Market Share by cell technology [1.11]](https://thumb-eu.123doks.com/thumbv2/123dok_br/19248823.974875/17.892.242.656.162.382/figure-pv-market-share-by-cell-technology.webp)

![Figure 2.3 Yield stress for single crystal Si as a function of temperature [2.9]](https://thumb-eu.123doks.com/thumbv2/123dok_br/19248823.974875/35.892.264.633.164.359/figure-yield-stress-for-single-crystal-function-temperature.webp)
+7
![Table 2.1 Kanthal A‐1 data [2.24]](https://thumb-eu.123doks.com/thumbv2/123dok_br/19248823.974875/52.892.151.746.404.498/table-kanthal-a-data.webp)
![Figure 2.47 Difference materials reflectance as a function of wavelength [2.54]](https://thumb-eu.123doks.com/thumbv2/123dok_br/19248823.974875/76.892.190.701.154.319/figure-difference-materials-reflectance-as-function-of-wavelength.webp)
Documentos relacionados
A infestação da praga foi medida mediante a contagem de castanhas com orificio de saída do adulto, aberto pela larva no final do seu desenvolvimento, na parte distal da castanha,
No seguimento da elaboração de um projeto de investigação a decorrer no âmbito do 2º ciclo em Psicologia Clínica na qualidade de aluna, Alexandra Lobo, sob orientação
Os dados obtidos revelaram diferença significativa entre os dois cultivares, sendo que as variáveis número de pencas por cacho e número de frutos por pencas foram maiores para
Separação de uma amostra de folhas de cada um dos ramos das duas classes para determinação posterior em laboratório do teor de humidade. Pesagem das amostras
Finally, correlating the diffusion behaviour of phage nanoparticles from tracking results (Figure 4 ) to the images obtained after drying of phage suspensions (Figure 6
Abstraindo os contextos institucionais a que essas narrativas pudessem remeter, e considerando so o seu aspecto formal, ou antes sua materia fantastica e sua estrutura (as
My own students at the Escola Superior de Educação are studying to become teachers of Portuguese and English. Although some of them will specialize in one of the two
Relembrando, em sentido lato define-se simbolismo como “um modo de representação indirecta e figurada de uma ideia, de um conflito, de um desejo inconsciente; neste sentido,
