Received October 2, 2008 and accepted July 29, 2009. Corresponding author: [email protected]
Typology and characterization of goat milk production systems in the
Cariris Paraibanos
1Roberto Germano Costa2, Hélio Luiz Beretta Dal Monte3, Edgard Cavalcanti Pimenta Filho4,
Evandro Vasconcelos Holanda Júnior5, George Rodrigo Beltrão da Cruz2, Marcos Paulo
Carrera Menezes2
1Financiado pelo BNB/Capes.
2Departamento de Agropecuária, CCHSA, Campus III, Universidade Federal da Paraíba.
3Departamento de Ciências Sociais Aplicadas, CCHSA, Campus III, Universidade Federal da Paraíba. 4Departamento de Zootecnia, CCA, Campus II, Universidade Federal da Paraíba.
5Empresa Brasileira de Pesquisa Agropecuária – EMBRAPA, Sobral - CE.
ABSTRACT -This work was aimed to identify the typology and the characteristics of the goat milk production systems. Seventy rural properties were researched. Multivariate data analysis with cluster formation techinique was used, and also the identification of five different groups of production systems. The production systems were classified through technical and economical efficiency, ranking groups 1 and 2 as high technological level, groups 3 and 4 as medium level, and the group 5 as low level. The high technological level systems used practices of more rational handling with larger technological employment becoming better specialized. These systems present the largest revenues of milk and unitary net profit. Medium technological production systems adopt technological recommendations and look for alternatives of handling practices. Production system 1 adopts intensive sanitary practices for the farmyard facilities and stables, but this does not happen in the production system 2. Vermifuge is applied three times a year in system 1 while in the system 2 it is applied twice a year. The producers of the systems 1 and 2 obtain more financial resources through official credit lines, and the producers of the group 2 are more punctual on the pay off deadlines.
Key Words: cluster, goat milk, handling, production system, typology
Tipologia e caracterização de sistemas de produção de leite caprino nos
Cariris Paraibanos
RESUMO -Objetivou-se identificar a tipologia e as características dos sistemas de produção de leite de cabra. Foram pesquisadas 70 propriedades agrárias. A técnica utilizada foi análise multivariada com a formação de cluster, com
identificação de cinco diferentes grupos de sistemas de produção. Os sistemas de produção foram tipificados pela eficiência técnica e econômica, como grupos 1 e 2, considerados de nível tecnológico alto, grupos 3 e 4, de nível médio, e grupo 5, de nível baixo. Os sistemas de nível tecnológico alto adotam práticas de manejo mais racionais com maior emprego tecnológico e são os mais especializados. Esses sistemas conferem as maiores receitas de leite e lucro líquido unitário. Os sistemas de produção de nível tecnológico médio adotam recomendações tecnológicas e buscam alternativas de práticas de manejo. Produtores do sistema de produção 1 utilizam práticas sanitárias intensivas das instalações de apriscos e currais para práticas mais alternadas realizadas no sistema de produção 2. O número de aplicações de vermífugo no sistema 1 é de três vezes ao ano, enquanto no sistema produtivo 2 é de duas aplicações. Os produtores dos sistemas 1 e 2 são os que mais captam recursos monetários por linha de crédito oficial, e os do grupo 2 os que mais se apresentaram com o financiamento quitado ou em dia.
Palavras-chave: agrupamento, leite caprino, manejo, sistema de produção, tipologia www.sbz.org.br
Introduction
The semi-arid region of northeastern Brazil, due to its environmental conditions , has increasingly focused on the livestock activity. Thus, the goat raising activity has become a great economic opportunity, because
engaged in direct partnership with the milk processing industry in the same region.
The results presented by Costa et al. (2008) in a research conducted in Cariri Paraibano region, revealed that the goat raising activity has been basically exploited in 96% of the researched properties, in which 47% of the animals were for milk production and 49% for meat.
Another aspect revealed by the authors and, not less significant, shows a trend for replacing the other activities by the goat milk production, in the group made up by producers that own smaller areas since the demand for this product has been consolidated relatively fast in the region. It was also observed in the group formed by producers who own bigger herds, a large concentration of activities for goat and cattle milk production.
According to Holanda Jr. (2001), production systems guide the productive activity by setting a group of practices and following an interaction among the following component factors: climate, soil, plant, animal, financial management, market, technological resources, and social aspects.
In the semi-arid region of Paraíba, the goat milk activity presents significant number of land units in different production systems with different traits which have not been fully disclosed, but that are necessary to demonstrate concretely in which technological and economic level these business are. The aim of this work was to identify the typology and specifically the characteristics of production systems that guide the dairy goat activity in the Cariri regions in the state of Paraiba, Brazil.
Material and Methods
This work was conducted in the Western and Eastern Cariri micro regions, made up by a 11,235 km2 surface,
including thirty municipalities. From all municipalities, eleven were selected: eight municipalities in the Western Cariri micro region and three belonging to the Eastern Cariri micro region. The selection procedure was carried out according to the organization and participation of municipalities to the Milk Program of the state of Paraiba which represents a model of shared management of the goat raising activity (Galvão & Lima, 2006). The sample includes seventy milk producers (or production units) from the selected municipalities, which corresponds to 10% of the universe of producers included in the Milk Program.
The survey of primary data for identification of the agricultural inventory was conducted through questionnaires, direct interview of producers which started in January 2006. Follow ups were made every 2 months until
December of the same year with the help from Rural Development Agents (ADRs/SEBRAE).
The questionnaires with the primary surveys were filled out as the following: 1) in the inventory field -immobilization in land, forage, grazing, grasses, vehicles, machinery and equipments, production and traction animals, buildings and improvements, 2) expense month reports - workforce, food, medicines, transportation, fuel, electricity, telephone, taxes and fees, technical support and maintenance, 3) income month reports - goat milk, animals sold, skin, manure.
The survey of secondary data came from questionnaires, developed and applied by ADRs/SEBRAE, being filled out by the following records: general information, feed management information, reproductive management, health management and rural credit. Secondary data related to milk production of each producer selected were also obtained from dairy plants.
The methodology used in this study was based on Bourbouze (1995) and Alvarez Funes & Paz Motola (1997), proceeding the following phases: (1) selection of samples and construction of the database, treatment of information and statistic processing, including the review and selection of variables for the analysis of types, application of multivariate statistical techniques (multiple correspondence and grouping), analysis of discrepancy and tables of contingencies. A questionnaire was designed based on Falagán (1988); it included 216 questions grouped into the following sections: social-economical factors, production line, animal base, land base, infrastructure, facilities and machinery, flock composition, breeding and feeding, hygiene, production and marketing. Field data were inserted into a spreadsheet and the statistical analyses in a statistical package.
For the formation of the homogeneous groups, the first step to take was the previous selection of variables to be retained, trying to choose those that best explain the variation of the studied phenomenon (Fortes, 1981; Carrieri et al., 1995; Ward, 1990). In this work, the selection of variables was based on researches on the production systems in semi-arid region of northeastern Brazil (Tourrand et al., 1993; Souza Neto et al., 1995; Caron & Hubert, 2003; Holanda Jr., 2004), trying to search for differentiating among systems regarded to the technology adopted in the production.
production: participation of milk in the income activity; (c) Dependence on the use of concentrate in the feed: participation of expenditures with concentrate on effective operational cost that are the direct costs in dairy activities; (d) Total technical efficiency of the production system: daily production per goat; (e) Economic efficiency: profit per liter of milk.
In order to make the groups for the study, it is also necessary to choose the number of desired groups, the distance measurement, and the aggregation criterion of elements of the observation set (Sampaio, 1993). The number of groups was selected considering the cubic clustering criterion (CCC) and the Percentage of explanation of the variance (R2), as described in Khattree & Naik (2000).
A non-hierarchical multivariate method on the k-means and proc fastclus method, according to Khattree & Naik (2000) was used to set the groups. By using the selected variables, the procedure for the formation of homogeneous groups (cluster) was applied, based on the principles of Khattree & Naik (2000). First, the selection of the initial values is performed, which will act as an initial average of groups using a hierarchical procedure. In this study, the averages of the groups formed by a grouping based on the Ward (1990) method was used for the production systems formation. This technique is useful in situations of complex agglomeration and it can identify homogeneous groups of irregular shapes, unequal sizes and different dispersion levels. Through this technique, a group is viewed as a high-density region in space separated by low-density regions between them. Later, the grouping method was used, and then it was held a canonical discriminate analysis to identify factors to explain the groups formed, by using the Statistical Package SAS System for Windows V8.
Resulting from this methodological sequence, it was identified 5 (Five) homogeneous groups corresponding to the production systems used by the region producers in terms of technology levels: high (1 and 2 groups), average (3 and 4), and low (group 5).
Results and Discussion
Milk producers were joined making up five different production system groups, derived from the composition of the sample for an equivalent distribution to each production system, with 17% of producers to group 1; 23% to group 2; 27% to group 3; 23% to group 4; and 10% to group 5.
It should be specified that the defined order of the groups totally matches the different levels of access, implementation of technologies and economic indicators, found in production systems through the management practices.
The results obtained (Table 1) for variable specialization, which shows the ratio of the milk income in relation to the gain with the activity, are higher for groups 1 and 2, with a higher technological level, thus indicating that the higher percentage of income in milk activities that belongs to both of them comes exclusively from the milk production.
The productivity variable, which represents the amount of daily liters of milk per animal, also approaches the groups 1 and 2 with the greatest results. Expenses with concentrate, which relatively represent a portion of the effective operational cost, were higher for groups 1, 2 and 3, in which it can be noticed that the percentage achieved reveals that the cost of concentrate exceed more than half of the effective operational cost.
The daily production achieved in liters of milk per herd/ day, reached greater averages for those groups that use higher technological level (1 e 2). In relation to the variable net profit per liter of milk, it was obtained higher levels for groups 1 and 2, while group 5 presented a negative net profit, with a value of R$ 0.21/L.
By transferring the analysis (Table 2), it is clearly seen the projection of results which allows to rate the production systems that were allocated by hierarchical order according to the technology levels and greatness of values achieved. According to the described methodology, the operational variables are indicators of the technical and economic efficiency of systems. Thus, the results show that the production systems 1 and 2 obtained the highest absolute and relative values, which classifies them as high technological level, followed by systems 3 and 4 as intermediate level and system 5 as low level.
Systems rated as of high technological level, which represent 40% of all producers investigated, and considering the positive effects presented, have led us to think that investments are strategically and exclusively aimed at the dairy activity. The findings show that the high-technology systems (1 and 2) extract income from milk are on average 87.61 and 85.85%, respectively, being therefore the most specialized ones.
By comparing the results between high-technology systems, it could be noticed a higher expense percentage with concentrate for system 2; however, system 1, which showed lowest expense, was the one showing the best production, productivity and profit results. Thus, considering the allocation of production factors in production system 1, a greater technical-economic efficiency could be indeed observed, and the system stands out.
Niznikowski et al. (2006), when studying the typology of production systems in Central and Eastern Europe,
found a new tendency toward the market, in which goats began to be kept in an intensive system throughout the year in order to increase the milk production. This type of system caused a significant difference allowing a specialized production combined with the milk processing.
The comparison between intermediate technological level systems (3 and 4), with an approximation of incomes extracted from the dairy activity also shows through the results that the largest expenditures with concentrate were found in system 3, considering the resources available to
Grupo Variable Number of producers Mean Standard error Minimum Maximum
Specialization1 (%) 1 2 87.61 3.49 80.40 94.11
Productivity2 (L/dia) 1 2 1.03 0.31 0.45 1.35
1 Expense/Concentrate3 (%) 1 2 55.27 6.67 47.34 66.79
Production4 (L) 1 2 53.33 16.10 37.17 94.99
Unitary net profit5 (R$/L) 1 2 0.33 0.12 0.12 0.47
Specialization1 (%) 1 6 85.85 2.03 82.95 89.96
Productivity2 (L/dia) 1 6 0.93 0.50 0.36 2.47
2 Expense/Concentrate3(%) 1 6 63.24 5.09 55.09 75.03
Production4 (L) 1 6 24.56 5.97 15.03 34.62
Unitary net profit5 (R$/L) 1 6 0.27 0.17 -0.14 0.63
Specialization 1 (%) 1 9 75.42 3.63 68.60 81.61
Productivity2 (L/dia) 1 9 0.62 0.17 0.33 0.88
3 Expense/concentrate3 (%) 1 9 58.55 4.54 52.62 70.31
Production4 (L) 1 9 12.22 3.38 6.64 18.09
Unitary net profit5 (R$/L) 1 9 0.20 0.13 -0.01 0.39
Specialization1 (%) 1 6 78.99 5.50 67.76 85.60
Productivity2 (L/dia) 1 6 0.53 0.25 0.21 1.28
4 Expense/concentrate3 (%) 1 6 39.09 6.53 25.14 50.01
Production4 (L) 1 6 21.58 7.03 9.41 34.35
Unitary net profit5 (R$/L) 1 6 0.12 0,18 -0.30 0.34
Specialization1 (%) 7 52.91 8.27 40.40 60.51
Productivity2 (L/dia) 7 0.18 0,08 0.06 0.25
5 Expense/Concentrate3 (%) 7 9.66 11.66 0.00 25.62
Production4 ( (L) 7 6.14 1.67 3.66 8.18
Unitary net profit5 (R$/L) 7 -0.21 0.33 -0.77 0.09 1 Specialization: revenue of the milk/revenue of the activity; 2 Productivity: liters/goat/day; 3 Expense/Concentrate: relationship of expense withconcentrate in relation to the EOC; 4 Production: liters/flock/day; 5 Unitary net profit: profit for liter of milk produced; EOC - effective operational cost.
Table 1 - Averages of specialization (%), productivity and net profit per goat milk production system
Variable Technological level
High Intermediate Low
More specialized Less specialized Not specialized
Group 1 Group 2 Group 3 Group 4 Group 5
Number of producers (%) 1 7 2 3 2 7 2 3 1 0
Specialization1 (%) 87.61 85.85 75.42 78.99 52.91
Productivity (L/day) 1.03 0.93 0.62 0.53 0.18
Expense with concentrate3 (%) 55.22 63.24 58.55 39.09 9.66
Production4/property (L/day) 53.33 24.56 12.22 21.58 6.14
Size of production (L/day) 37 – 95 15 – 35 6 – 18 9 – 35 3 – 8
Unitary cost (R$/L) 0.67 0.73 0.80 0.88 1.21
Unitary net profit5 (R$/L) 0.33 0.27 0.20 0.12 (0.21)
Producer monthly profit (R$) 535.30 201.70 74.34 78.77 (39.22)
1 Revenue of the milk/revenue of the activity; 2 Liters/goat/day; 3 Relationship of expense with concentrate in relation to the EOC; 4 Liters/flock/day; 5 Unitary net profit: Profit for liter of milk produced; EOC = effective operational cost.
the effective operational cost. However, the average milk production per farm on the daily production per flock was higher for system 4, with an average of 21.58 L/day.
These results do not guarantee that system 4 has the best economic efficiency due to the productivity reached by system 3 of 0.62 L/day, thus providing better conclusive results for both average cost and average profit. The results presented rank these systems as intermediate technological level.
With a differentiated scenario, the low-technological level system includes the lowest percentage of goat breeders involved in this research, and it is also observed by the average results that only half of the income perceived in the production units comes from the goat milk production.
The low use of protein inputs, represented by the expenditure in relation to the effective operational cost, presented redundancy in the milk volumes, and that represented the lowest results in the research, thus pointing to an overlap of the average cost to the average profit, confirming system 5 as adopting few technological resources. Nogueira & Mello (2005) confirm the precarious infrastructure and procedures in conducting the goat raising activity analyzed in the region.
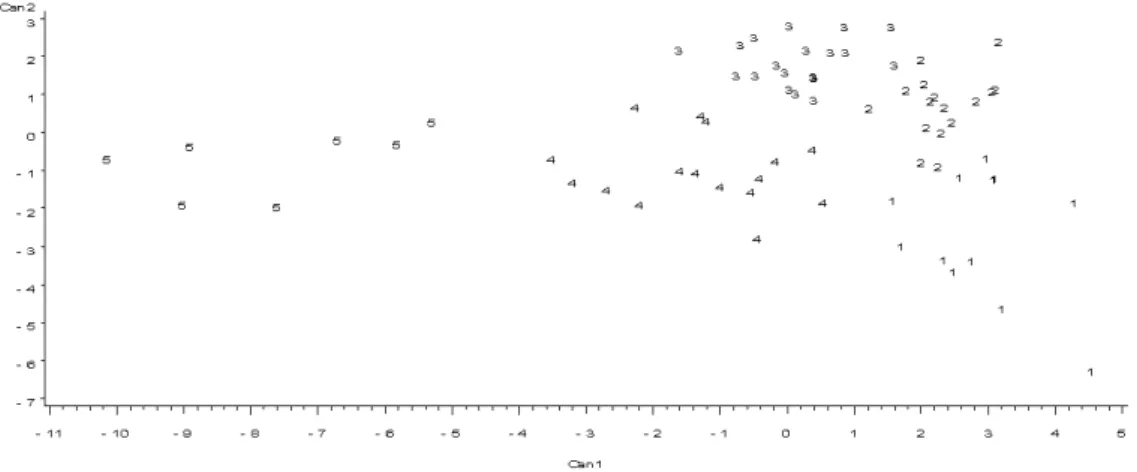
The procedure adopted for this work explained 72.50% of the variation among groups, and the groups differentiated regarded to the technical and economic efficiency and use of concentrate. It is observed (Figure 1) that groups 1 and 2 are those with the highest values for the canonical variable 1 (Can1), while groups 2 and 3 are those with the highest values for the canonical variable 2 (Can2). Can1 expresses the technical and economic efficiency, which decreases from group 1 to group 5. Can 2 expresses the use of concentrate and, groups with lower values are those that proportionately use less concentrate in the feeding of goats.
The characterization of the production systems may be seen by the frequency results of the different items (Table 3), mainly the area that shows a view of the land composition where the dairy goat activity is settled.
From the total number of producers, the system production 1 concentrates properties with area stratum over 75 ha. It appears that the land composition among high-technology systems has adverse conditions. Stratification data provided by Banco do Nordeste do Brasil and reported by Couto (2001) show that half of the
northeastern flock of goat and sheep are located in properties with less than 30 ha.
The variable condition of the producer reveals that for system 1, most farms belong to a single landowner while most producers in system 2 show the single owner condition in which a small portion show the condition of partnership (25%), a category which generally brings together members of the same family participating in the same agricultural activity unit.
The variable dominant activity demonstrates the economic base of the agricultural unit, so, where the productive activity is more concentrated. Under this reference, the results indicate that the high technological level system 1 presents 33.33% of enterprises exclusively involved with the goat raising activity. System 2, despite of presenting high technological level, presents producing units with diversified activities.
Corroborating with this analysis, both Holanda Jr. (2004) and Costa (2008) present similarities, strengthening the condition that systems with higher area stratum concentrate production in the livestock activity, use more their areas according to the activity performed, such as the collective grazing, and even occupy fodder crops. On the other hand, the systems with lower area stratum do not only exploit the livestock activity, but they also perform parallel
production activities, and in the case of the semi-arid region, they perform intermittent and subsistence crops. From the results of this work, only the production system 1 have all the producers with their own machinery and equipment for the operations which involve goat raising activity.
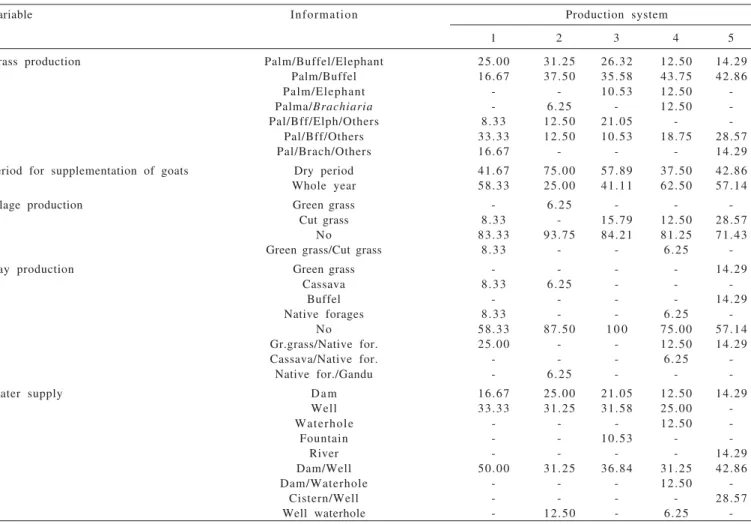
In feeding management (Table 4), the cultivated forages, palm, buffel and others are used in 33.33% of properties with high technological level, while systems of low and intermediate technological level concentrate their fodder only in palm and buffel.
By emphasizing this condition, Holanda Jr. (2006) mentions Guimarães Filho et al. (2000) showing that palm and buffel, elephant and liverseed grasses (Uruchloa mosambicensis) are grown by sheep and goat raisers in the
Brazilian Semi-arid region. These producers adopt systems called by the authors as “traditional” in insufficient areas that are small enough to not significantly influence the performance of the flock. In “improved” systems, in addition to these fodders, Leucena (L e u c a e n a leucocephala) is also cultivated in areas of size enough to
increase the productivity of the systems.
According to Rancourt et al. (2006), in France, farms are becoming specialized in cheese production. These systems, which try to be self-sufficient in fodder, are usually extensive and mainly located in less favored areas. On the other hand, in farms specialized in goat milk production, the orientation is towards intensification with a very high forage consumption. The self-sufficiency in fodder is not a priority because farmers can often find themselves in more favorable conditions than those presented in the cheese system.
The all year round supplementation of goats is being adopted in the intermediate system 4 by 62.50% of producers while 75% belonging to system 2 have chosen to supplement only in the dry period. It is pointed out an attainment of adverse feeding management among the high technological level systems and intermediate level systems as well, when considering the period of the year. Morales et al. (2000), when measuring the effects of supplementation of a goat flock in terms of economic viability, used a pasture supplemented with alfalfa grass and concluded that changes in supplementation in function of the forage availability allowed the nutritional optimization of the system.
When typifying and analyzing sheep and goat production systems, Campos (2003) emphasized that in the low-technology system, the predominant feeding system is native grass throughout the year and supplemental forage in the dry season. The supplementation with concentrated is used for sheep and goats in the dry season.
While silage is not practiced in all systems, hay was used by ¼ of high-technology system producers who also use green grass and native fodder. The forage conservation has not become a present action and of permanent practice in the agricultural units in the Cariri regions of Paraiba yet, position referenced by Silva et al. (2004) apud Costa et al. (2008), fact that has led research and extension institutions to expand training courses for this purpose.
The water supply in semi-arid Paraíba, an essential condition for the milking goats, has dams and wells as its primary source for most systems.
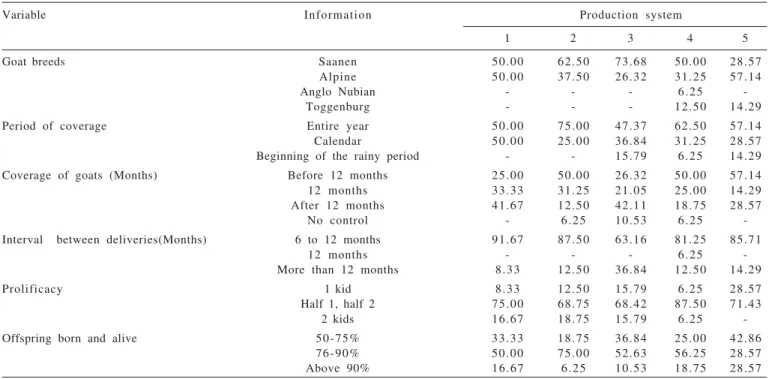
Goat breeds prevail, and Saanen followed by Alpine are the most present in high and intermediate technological
Table 3 - General information obtained by system production
Variable Information Production system
1 2 3 4 5
Area (Less than 25 ha.) 16.67 34.25 47.37 18.75 28.57
(From 25 to less than 50) 16.67 25.00 36.84 37.50 28.57 (From 50 to less than 75) 25.00 31.25 15.79 25.00
-(Above 75 ha.) 41.67 12.50 - 18.75 42.86 Condition of the producer Proprietary 1 0 0 75.00 89.47 1 0 0 85.71
Partner - 25.00 10.53 - 14.29
Dominant activity Goat 33.33 12.50 26.32 12.50 14.29
Agriculture/Goat 25.00 43.75 63.16 56.25 42.86
Cattle/Goat 16.67 6.25 - 6.25
-Goat/Sheep 16.67 - - - 14.29
Agr/Cattle/Goat - 6.25 - 6.25
-Agr/Goat/Sheep 8.33 31.25 10.53 18.75 28.57 Presence of machinery and equipments Yes 1 0 0 62.50 73.68 87.50 85.71
No - 37.50 26.32 12.50 14.29
ha = hectare.
level systems (Table 5); however, a more defined breeding stock of breed Saanen in system 3 is emphasized while in the non-specialized system 5, the alpine breed overtakes more than half of the farms.
The coverage of goats shows higher rates for this type of natural coverage in all systems, establishing the coverage season throughout the year in low and intermediate technological level systems, with emphasis on system 2, where 75% of the exploratory units have random coverage. On the other hand, it seems that for production system 1, half of the producer chose fixing a timetable for coverage, thus performing coverage season between the months of March-April and September-October.
Most coverage of goats is being held in the production systems 1 and 3 after 12 months, while the other systems, showing higher indexes, with the coverage practice after 12 months. Campos (2003) describes in his study on the characterization of systems that in level 3 the frequency
of producers who are concerned with the selection of the flock aiming at reproduction is high. However, the natural and uncontrolled coverage takes significant proportions. Regarded to the criteria used for the first coverage, more than half of goat and sheep raisers do not adopt them. It is observed that the interval between deliveries, showing high indexes for all systems, takes place in the period from 6 to 12 months. The prolificacy results present similarities among systems, where in the befallen deliveries, half is of only 1 kid, and the other half of 2 kids. The reproductive efficiency is best represented in the production system 2, where it could be observed that from the set of agricultural units aimed at this system, 75% of them reach rates from 76 to 90% of born and live offspring. A study conducted by Song et al. (2006) on Korean native goats between two productions systems - extensive and intensive, has concluded that the management of an intensive system is more efficient when
Variable Information Production system
1 2 3 4 5
Grass production Palm/Buffel/Elephant 25.00 31.25 26.32 12.50 14.29 Palm/Buffel 16.67 37.50 35.58 43.75 42.86
Palm/Elephant - - 10.53 12.50
-Palma/Brachiaria - 6.25 - 12.50
-Pal/Bff/Elph/Others 8.33 12.50 21.05 - -Pal/Bff/Others 33.33 12.50 10.53 18.75 28.57 Pal/Brach/Others 16.67 - - - 14.29 Period for supplementation of goats Dry period 41.67 75.00 57.89 37.50 42.86 Whole year 58.33 25.00 41.11 62.50 57.14
Silage production Green grass - 6.25 - -
-Cut grass 8.33 - 15.79 12.50 28.57 No 83.33 93.75 84.21 81.25 71.43 Green grass/Cut grass 8.33 - - 6.25
-Hay production Green grass - - - - 14.29
Cassava 8.33 6.25 - -
-Buffel - - - - 14.29
Native forages 8.33 - - 6.25
-No 58.33 87.50 1 0 0 75.00 57.14 Gr.grass/Native for. 25.00 - - 12.50 14.29
Cassava/Native for. - - - 6.25
-Native for./Gandu - 6.25 - -
-Water supply Dam 16.67 25.00 21.05 12.50 14.29
Well 33.33 31.25 31.58 25.00
-Waterhole - - - 12.50
-Fountain - - 10.53 -
-River - - - - 14.29
Dam/Well 50.00 31.25 36.84 31.25 42.86
Dam/Waterhole - - - 12.50
-Cistern/Well - - - - 28.57
Well waterhole - 12.50 - 6.25
-Palm/Buffel/Elephant = palm, buffel and elephant. Palma/Brachiaria = palm and Brachiaria.
Pal/Bff/Elph/Others = palm, buffel elephant and others. Pal/Bff/Others = palm, buffel and others.
Pal/Brach/Others = palm, Brachiaria and others. Gr.grass/Native for. = green grass and native forages. Cassava/Native for. = cassava and native forages. Native for./Gandu = native forages and gandu.
achieving a shorter period for the first delivery, with significant differences between the averages of 412 and 382 days, respectively. The study also shows that the average number of kids per delivery was 1.69 for the extensive system while intensive system reached 1.78, showing no significant differences.
Güney et al. (2006) in the work conducted in Northern Cyprus, with the aim of assessing the milk production of Damascus goats, their reproduction and growth performance obtained the following results: 70.2 and 80.5% for the birth rate in the years 2001 and 2002, respectively, and in the same years, 1.62 and 1.56 kids/ goat/year for the prolificacy rate. These results are in line with Mavrogenis & Hadjipanayiotou (1989).
Pereira Filho et al (2005) citing Rezende (2002) report that when goats are well managed, they can keep an index of 1 birth every 8 months and prolificacy rate from 1.5 to 1.8 kids per delivery.
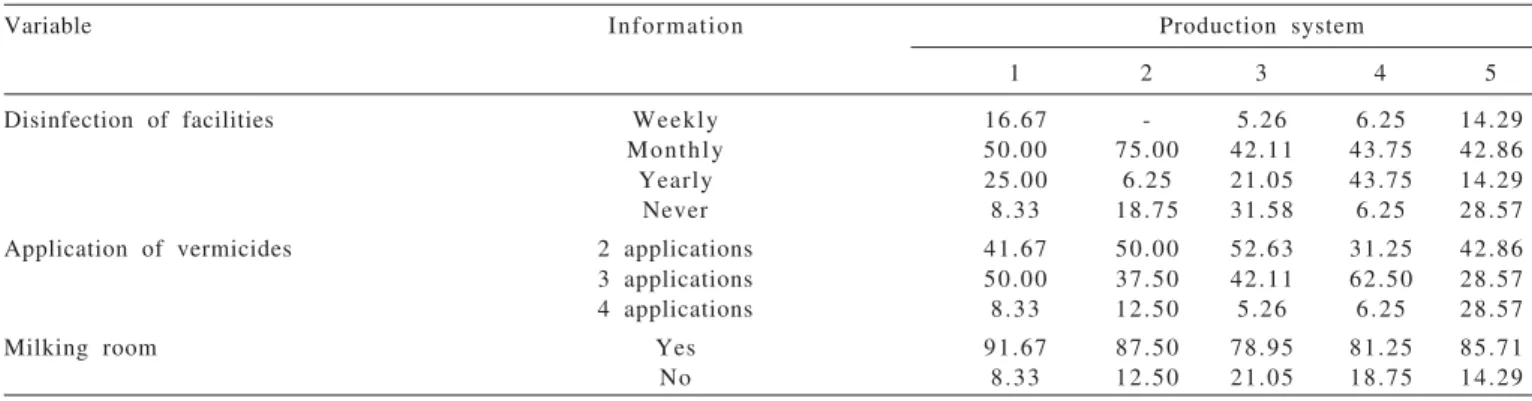
In relation to health management (Table 6), it is shown a number of producers performing disinfection in the facilities once a week (16.67%), therefore, showing assiduity in this practice, and half of producers practice it once a month. The production system 2 also shows month disinfecting practice.
The application of vermicide is less intense in production systems 2 and 3, where half of the producers perform only two annual applications. The application of vermicide becomes more intense with three annually
applications for production systems 1 and 4, including a larger portion of producers.
Among the basic structures of the dairy activity, it is more advisable for the implementation of the best milking practices the installation of the milking room. Among the high-technology systems, system 1 presents the largest percentage of the milking rooms (91.67%), since indexes for the other systems are also considered to be satisfactory. This can be explained by the fact that in recent past, the implementation of technology for the dairy goat activity has been stimulated, warning goat raisers for the need and importance of milking rooms.
Boyazoglu & Morand-Fehr (2001), making a critical review on the quality of sheep and goat milks, have determined that a hygienic and bacteriological quality policy would be of vital importance for the survival of the sector. The criteria for these parameters are outlined in the guidelines of the European Union, which rules aspects of production and milk processing of various milk types. They point out that the standards for goat and sheep milk and the limits of these parameters such as the count of somatic cell have not been definitively established yet.
According to Haelein (1999) cited by Boyazoglu & Morand Fehr (2001), the parameters that link mastitis to productivity represent safety and acceptability of the milk to the processing plants and consumers, also in terms of quality, health and hygiene.
Variable Information Production system
1 2 3 4 5
Goat breeds Saanen 50.00 62.50 73.68 50.00 28.57
Alpine 50.00 37.50 26.32 31.25 57.14
Anglo Nubian - - - 6.25
-Toggenburg - - - 12.50 14.29
Period of coverage Entire year 50.00 75.00 47.37 62.50 57.14 Calendar 50.00 25.00 36.84 31.25 28.57 Beginning of the rainy period - - 15.79 6.25 14.29 Coverage of goats (Months) Before 12 months 25.00 50.00 26.32 50.00 57.14 12 months 33.33 31.25 21.05 25.00 14.29 After 12 months 41.67 12.50 42.11 18.75 28.57
No control - 6.25 10.53 6.25
-Interval between deliveries(Months) 6 to 12 months 91.67 87.50 63.16 81.25 85.71
12 months - - - 6.25
-More than 12 months 8.33 12.50 36.84 12.50 14.29
Prolificacy 1 kid 8.33 12.50 15.79 6.25 28.57
Half 1, half 2 75.00 68.75 68.42 87.50 71.43 2 kids 16.67 18.75 15.79 6.25 -Offspring born and alive 50-75% 33.33 18.75 36.84 25.00 42.86
76-90% 50.00 75.00 52.63 56.25 28.57 Above 90% 16.67 6.25 10.53 18.75 28.57
It is observed that high technological level productive systems (1 and 2) took part on the capture of financial resources, linked to the official rural credit, benefiting most of the producers (Table 7). This condition makes us conclude that the technological level and type of production make the insertion of capitals not only necessary, but higher for the provisioning of activities, therefore, making more technological systems require more capital to their management.
Among the goals of the official funding, the credit intended for investments as the first option, which is a condition seen in all production systems due to the
indexes achieved, is the aim of producers, and the production system 1 is the one that shows a higher percentage (50%) for that purpose. The next destination of the financial resources is supplying the costs, and this condition is evidenced in intermediate technological level systems with a minimum participation for systems 3 and 4, respectively. The allocation of credit as second destination for low technological level system is to supply cost and investment of the producers.
Considering the credit destinations, it has been verified that among the goals of the investment, the purchase of goats is the option of highest percentage in all systems. It
Variable Information Production system
1 2 3 4 5
Loan Yes 66.67 62.50 42.11 56.25 42.86
No 33.33 37.50 57.89 43.75 57.14 Objective of the financing Not informed 33.33 43.75 57.89 50.00 57.14
Cost - 06.25 15.79 12.50
-Investment 50.00 25.00 15.79 25.00 28.57 Cost/Investment 08.33 25.00 10.53 12.50 14.29
Working capital 08.33 - - -
-Objective of the investment Not informed 41.67 43.75 73.68 65.50 57.14
Facilities 8.33 12.50 - 6.25
-Machine/Equipment - - 5.26 -
-Implem./Pasture - 18.75 - 6.25
-Purchase goats 33.33 18.75 10.53 18.75 42.86 Fac./Purchase goats 8.33 6.25 5.26 -
-Mach/Purchase goats 8.33 - - -
-ImpPs/Purch goats - - 5.26 6.25
-Current situation Not informed 33.33 43.75 57.89 50.00 57.14 Paid up 25.00 25.00 15.79 25.00 14.29 Renegotiated 33.33 6.25 5.26 12.50 14.29
Up to date - 25.00 10.53 12.50
-Delayed 8.33 - 5.26 -
-Under execution - - 5.26 - 14.29
Cost/Investment = cost and investment.
Machine/Equipment = machine and equipments of goats. Implem./Pasture = implementation of pasture.
Purchase goats = purchase of goats.
Fac./Purchase goats = facilities and purchase of goats. Mach/Purchase goats = machines an purchase of goats.
ImpPs/Purch Goats = implementation of pasture and purchase of goats.
Table 7 - Rural Credit according to the Production System
Variable Information Production system
1 2 3 4 5
Disinfection of facilities Weekly 16.67 - 5.26 6.25 14.29 Monthly 50.00 75.00 42.11 43.75 42.86 Yearly 25.00 6.25 21.05 43.75 14.29 Never 8.33 18.75 31.58 6.25 28.57 Application of vermicides 2 applications 41.67 50.00 52.63 31.25 42.86 3 applications 50.00 37.50 42.11 62.50 28.57 4 applications 8.33 12.50 5.26 6.25 28.57
Milking room Yes 91.67 87.50 78.95 81.25 85.71
No 8.33 12.50 21.05 18.75 14.29
must be emphasized that in high technological level systems, the investments made in the purchase of goats by system 1 are above investments of system 2. In the low technological level system, the investment is intended solely for the purchase of goat, with participation of 42.86%, with no application in detained capital.
Regarded to the relationship between financing and payment condition by the producer, high technological level systems are found in a solvency condition, therefore, able to pay off the loans which were made, standing out for the better performance in relation to the official credit for system 1. The situation described by production systems 3 and 5 deserves attention because they show the lowest percentages of producers who have paid off the official credit, presenting significant default with judicial enforcement of credit.
Peacock (2005) pointed out to the importance of credit policies, on which the growth of flocks has depended on the provision of credit, making it possible for poor producers to acquire a flock or restore it. The credit available for the exploitation of goats can be taken through many ways, from formal credit systems (private or government banks), with payment in cash, to informal systems such as Non Governmental Organizations.
Conclusions
Five different production systems are identified. Production systems 1 and 2 were the more specialized, and provides the greatest milk incomes and net profit. Production systems 3 and 4 adopt technology recommendations and the net profit obtained is compensatory. Production system 5 has limited technology, presenting negative net profit. There is an annual supplementation in production systems 1 and 4 by most of the producers, while the other systems are supplemented only during the dry period. In production system 2, 75% of the units present random coverage, while 50% from system 1 choose to set timetable. The characterization of the health management shows that the applications of vermicide in system 1 are performed three times a year, and two applications for system 2, while the exchange of the active principle is intensive in both. Systems 1 and 2 are those that most capture financial resources from the official bank credit. Producers from system 2 are those with the greatest condition for the financing to be paid off on the deadline date.
References
ALVAREZ FUNES, R.; PAZ MOTOLA, R. Metodologia asociada al diseño de propuestas para el desarrollo de la producción lechera caprina (Associated methodology for the design of proposals for development of milk goat production). Archivos de Zootecnia, v.46, p.211-224, 1997.
BOURBOUZE, A. Goat production system study methods. In: EL AICH, A.; LANDAU, S.; BORBOUZE, A. et al. (Eds.).
G o a t p r o d u c t i o n s y s t e m s i n t h e M e d i t e r r a n e a n.
Wageningen Pers, Wageningen: EAAP Publications, v.71, p.6-19, 1995.
BOYAZOGLU, J.; MORAND-FEHR, P. Mediterranean dairy sheep and goat products and their quality. A critical review. Small R u m i n a n t R e s e a rc h, v.40, n.1, p.1-11, 2001.
CARON, P.; HUBERT, B. Dinâmica de sistemas de pecuária. In: CARON, P.; SABOURIN, E. (Eds.). Camponeses do sertão: mutação das agriculturas familiares no Nordeste do Brasil. Brasília: EMBRAPA. Informação Tecnológica, 2003. p.103-122.
CARRIERI, A.P.; LIMA, J.B.; ANDRADE, J.G. et al. Práticas agrícolas e práticas administrativas na configuração de sistemas administrativas na configuração de sistemas de produção rural. Caderno de Administração Rural, v.7, n.2,
p.83-101, 1995.
CAMPOS, R.T. Tipologia dos produtores de ovinos e caprinos no estado do Ceará. Revista Econômica do Nordeste, v.34, n.1, 2003.
CASTEL, J.M.; MENA, Y.; DELGADO-PERTIÑEZ, M. et al. Characterization of semi-extensive goat production systems in Southern Spain. Small Ruminant Research, v.47, n.2,
p.133-143, 2003.
COSTA, R.G. Caracterização do sistema de produção caprino e ovino na Região Semi-árida do Estado da Paraíba – Brasil.
Archivos de Zootecnia, v.57, n.218, p.195-205, 2008. COUTO, F.A.A. Dimensionamento do mercado de carne ovina e
caprina no Brasil. In:___ A p o i o à c a d e i a p ro d u t i v a d a ovinocaprinocultura brasileira. Brasília: CNPq, 2001. p.10-15.
(Relatório final).
FORTES, N.T. Tipificação de estabelecimentos agropecuários e a p ro g r a m a ç ã o d e e x t e n s ã o r u r a l. 1 9 8 1 . 2 1 9 f . Te s e (Doutorado em Economia Rural) – Universidade Federal de Viçosa, Viçosa, MG.
FA L A G Á N , A . C a r a c t e r i z a c i ó n p ro d u c t i v a d e l a r a z a caprina Murciana-Granadina em la región de Murcia. Madri: INIA, 1988. 103p.
GALVÃO, P.F.M.; LIMA, D.N. Desenvolvimento sustentável da caprinovinocultura no Cariri Paraibano. In: ENCONTRO NACIONAL DE PRODUÇÃO DE CAPRINOS E OVINOS, 1., 2006, Campina Grande. Anais... João Pessoa, PB: SEDAP, SEBRAE, INSA, ARCO, 2006. p.312-336.
GÜNEY, O.; TORUN, O.; ÖZUYANIK, O. et al. Milk production, reproductive and growth performances of Damascus goats u n d e r n o r t h e r n C y p r u s c o n d i t i o n s . S m a l l R u m i n a n t Researc h, v.65, n.1, p.176-179, 2006.
HOLANDA JR., E.V. Sistemas de produção, enfoque sistêmico e sustentabilidade na produção leiteira. In: MADALENA, F.E.; MATOS, L.L.; HOLANDA, JR.; E.V. (Eds.) Produção d e l e i t e e s o c i e d a d e. B e l o H o r i z o n t e : F E P M V Z , 2 0 0 1 . p . 4 5 7 - 4 7 8 .
H O L A N D A J R . , E . V. S i s t e m a s d e p ro d u ç ã o d e p e q u e n o s ruminantes no semi-árido do nordeste do Brasil. Sobral: Embrapa – Caprinos, 2006. 55p.
INSTITUTO BRASILEIRO DE GEORGRAFIA E ESTATÍSTICA -IBGE. Censo agropecuário do Brasil. [2000]. Disponível em: <www.ibge.gov.br>. Acesso em: 26/2/2007.
INSTITUTO BRASILEIRO DE GEORGRAFIA E ESTATÍSTICA -IBGE. Pesquisa pecuária municipal. [2003]. Disponível em: <www.ibge.gov.br>. Acesso em: 26/2/2007.
KHATTREE, R.; NAIK, P. N. Multivariate data reduction and discrimination with SAS software. Cary: Willy Inter-science. 2000. 558p.
MORALES, A.R.; GALINA, M.A.; JIMENEZ, S. et al. Improvement of biosustainability of a goat feeding system with key supplementation. Small Ruminant Research, v.35, n.2, p.97-105, 2000.
NIZNIKOWSKI, R.; STRZELEC, E.; POPIELARCZYK, D. Economics and profitability of sheep and goat production under new support regimes and market conditions in Central and Eastern Europe. S m a l l R u m i n a n t R e s e a rc h, v.62, n.3, p.159-165, 2006.
NOGUEIRA, E.; MELLO, N.T.C. Diagnóstico sócio-econômico da caprinocultura no sudoeste paulista. Informações Econômicas, v.35, n.8, p.67-70, 2005.
PEACOCK, C. Goats – A pathway out of poverty. Small Ruminant Research, v.60, n1-2, p.179-186, 2005.
PEREIRA FILHO, J.M.; RESENDE, K.T.; TEIXEIRA, I.A.M.A. et al. Efeitos da restrição alimentar no desempenho produtivo e econômico de cabritos F1 Boer x Saanen. Revista Brasileira de Zootecnia, v.34, n.1, p.188-196, 2005.
RANCOURT, M.; FOIS, N.; LAVIN, M.P. et al. Mediterranean sheep
and goats production: An uncertain future. Small Ruminant Research, v.62, n.3, p.167-179, 2006.
SAMPAIO, I.V.B. Relatório de atividades de pós-doutorado desenvolvidas no período de 3/9/2002 a 4/3/2003. Madri: Universidade Politécnica, 1993. 123p. (Relatório de atividades. Pós-Doutorado).
SONG, H.B.; JO, I.H.; SOL, H.S. Reproductive performance of Korean native goats under natural and intensive conditions.
Small Ruminant Research, v.65, n.3, p.284-287, 2005. SOUZA NETO, J.; BACER, G.A.; SOUSA, F.B. Análise
socioeconômica da exploração de caprinos e ovinos no estado do Piauí. Pesquisa Agropecuária Brasileira, v.30, n.8, p.1017-1030, 1995.
TOURRAUND, J.F.; CARON, P.; BONNAL, P.H. P e s q u i s a s o b r e s i s t e m a s d e p r o d u ç ã o n o s e m i - á r i d o: o caso dos municípios de Tauá-Ceará. Sobral: EMBRAPA – Caprinos, 1993. 99p.