DYNAMICS OF
14C-LABELED GLUCOSE AND AMMONIUM
IN SALINE ARABLE SOILS
(1)Alma Vuelvas-Solórzano(2), Rosalina Hernández-Matehuala(2), Eloy Conde-Barajas(3), Marco L. Luna-Guido(4), Luc Dendooven(4) &
Marcela Cárdenas-Manríquez(3)
SUMMARY
Organic matter dynamics and nutrient availability in saline agricultural soils of the State of Guanajuato might provide information for remediation strategies.
14C labeled glucose with or without 200 mg kg-1 of NH
4+-N soil was added to
two clayey agricultural soils with different electrolytic conductivity (EC), i.e. 0.94 dS m-1 (low EC; LEC) and 6.72 dS m-1 (high EC; HEC), to investigate the effect
of N availability and salt content on organic material decomposition. Inorganic N dynamics and production of CO2 and 14CO2 were monitored. Approximately 60 %
of the glucose-14C added to LEC soil evolved as 14CO
2, but only 20 % in HEC soil
after the incubation period of 21 days. After one day, < 200 mg 14C was extractable
from LEC soil, but > 500 mg 14C from HEC soil. No N mineralization occurred in the
LEC and HEC soils and glucose addition reduced the concentrations of inorganic N in unamended soil and soil amended with NH4+-N. The NO2- and NO3
-concentrations were on average higher in LEC than in HEC soil, with exception of NO2- in HEC amended with NH4+-N. It was concluded that increases in soil EC
reduced mineralization of the easily decomposable C substrate and resulted in N-depleted soil.
Index terms: dynamics of inorganic N, emission of 14CO
2 and 12CO2, saline soils.
(1) Recebido para publicação em dezembro de 2007 e aprovado em abril de 2009.
(2) Laboratorio de Bioingeniería, Departamento de Ing. Bioquímica, Instituto Tecnológico de Celaya. Av. Tecnológico y García
Cubas s/n, CP 38010, Celaya Gto., México. E-mail: [email protected]
(3) Laboratorio de Bioingeniería, Departamento de Ing. Ambiental, Instituto Tecnológico de Celaya. Av. Tecnológico y García
Cubas s/n, CP. 38010, Celaya Gto., México. E-mail: [email protected]
(4) Laboratorio de Ecología de Suelos, Departamento de Biotecnología y Bioingeniería, Cinvestav, Av. Instituto Politécnico
Nacional 2508, CP 07360, México D.F. México. E-mail: [email protected]
RESUMO: DINÂMICA DE GLICOSE MARCADA COM 14C E AMÔNIO EM
SOLOS SALINOS
Os conhecimentos sobre a dinâmica da matéria orgânica e disponibilidade de nutrientes em solos salinos podem ser úteis para nortear a adoção de estratégias de recuperação e manejo. O objetivo deste trabalho foi avaliar o efeito da condutividade elétrica (EC) e presença de N inorgânico na decomposição da matéria orgânica a dois solos salinos localizados em Guanajuato (México). Nesse sentido, glicose marcada com 14C com ou sem amônio na dose de 200 mg kg-1 de N foi adicionada em dois tipos de solo com valores de condutividade elétrica de 0,94 dS m-1 (baixo EC; LEC) e 6,72 dS m-1 (alta EC; HEC). Amostras de solos foram incubadas durante 21 dias e, ao longo desse tempo, foram avaliadas as concentrações de N inorgânico e a produção de 12CO
2 e 14CO2. Após o período de incubação, aproximadamente 60 % da glicose marcada com 14C adicionado ao solo LEC evoluiu como 14CO
2, mas somente 20 % no solo HEC a evolução de 14CO
2 foi de apenas 20 %. Decorrido um dia de incubação, menos de 200 mg de 14C foram extraídos do solo LEC, ao passo que no solo HEC foram extraídos mais de 500 mg de 14C. Não ocorreu mineralização de N nos dois solos e a adição de glicose reduziu as concentrações de N inorgânico no solo controle e no solo que recebeu N-NH4+. As concentrações de NO2- e NO3- foram, em média, maiores no solo LEC do que no solo HEC, com exceção do teor de NO2-, que foi maior no HEC tratado com NH4+. O aumento da condutividade elétrica promoveu a redução da mineralização de substrato facilmente decomponível e a diminuição do teor de N no solo.
Termos de indexação: dinâmica de nitrogênio inorgânico, emissão de 12CO
2 e 14CO2, solos salinos.
INTRODUCTION
Nowadays, there is an environmental and economic need to understand the role and destiny of N in different ecosystems. Nitrogen cycling is mostly controlled by biological activity and at the same time biological processes are affected by climate and physicochemical soil characteristics. In some extreme environments, such as saline soils, the high electrolytic conductivity (EC) inhibits microbial activity and organic matter decomposition and thus affects N cycling (Johnston & Guenzi, 1963; McCormick & Wolf, 1980; Bandyopadhyay & Bandyopadhyay, 1983; Zahran, 1997; Pathak & Rao, 1998). For instance, mineralization of maize and glucose were inhibited in alkaline saline soils with EC > 10 dS m-1
and large amounts of NH4
+
and NO3
were immobilized within short periods of time, reducing N availability (Conde et al., 2005). Additionally, high concentrations of nitrite (NO2-) were accumulated in these soils when
an easily decomposable substrate plus NO3- were
added (Vega-Jarquin et al., 2003). Pathak & Rao (1998) reported that ammonification and nitrification were inhibited by high salt concentrations and that, particularly the latter, was very sensitive to the presence of salts.
High concentrations of soluble salts in soil have a negative effect on plant growth in different aspects (Aguirre, 1993; Zahran, 1997). In the first place, high concentrations of specific ions such as Na+
are toxic to plants and cause physiologic disorders. Secondly,
the presence of salts decreases water root uptake (Bohn et al., 1979; Aguirre, 1993; Pankhurts et al., 2001; Atlas & Bartha, 2002; Bernstein & Kafkafi, 1996; Haynes & Rietz, 2003). And thirdly, certain ions have a negative effect on the solubility of other ions and on microbial biomass activity, e.g., protein synthesis and respiration (Giambiagi & Lodeiro, 1989; Aguirre, 1993; Atlas & Bartha, 2002; Sardhina et al., 2003).
Plant growth and crop yields have decreased in some parts of the State of Guanajuato, Mexico, due to the excessive amounts of salts in the soil, and some parts have become uncultivable. The salt in soil increases since crops are irrigated with saline effluents and by inadequate soil practices. The Agriculture Department of the State of Guanajuato has started a project to investigate how increased salinity affects nutrient availability in the soil and how the addition of organic material might restore soil fertility. As part of this project, the effect of increased salinity on dynamics of inorganic N (NH4+, NO2-, NO3-) and
organic material were investigated. Two agricultural soils with different electrolytic conductivity (EC), i.e. 0.94 dS m-1
(low EC; LEC) and 6.72 dS m-1
(high EC; HEC) were amended with or without 14C-labeled
glucose and with or without (NH4)2SO4. The 14
MATERIALS AND METHODS
Sampling site
The sampling sites are located in Cuerámaro (HEC soil) and San Francisco del Rincón (LEC soil), State of Guanajuato, Mexico, at 1,726 and 1,804 m asl, with a mean annual temperature of 20.3 and 19.4 °C; and precipitation of 981 and 967 mm, respectively (Terrones-Rincón et al., 2000). Soils in the area originating from aluvio-coluvial deposits are clayey-loamy to clayey-sandy. The soil structure is granular in the top soil and organic matter contents range from 14 to 52 g kg-1
dry soil; EC in saturation extracts ranges from 0.9 to 6.7 dS m-1
. The cation exchange capacity (CEC) in soils ranges from 34.8 to 40.5 cmolc kg-1 dry soil while exchangeable Ca2+
from 66 to 90 mg kg-1, Mg2+ from 17 to 26 mg kg-1,
Na+
from 82 to 163 mg kg-1
, K+
from 15.6 to 19.6 mg kg-1
, and extractable P from 23 to 32 mg kg-1
. CO32- in the exchangeable saturation extract ranges
from 15 to 24 mg kg-1, Cl- from 82 to 93 mg kg-1 and
SO4
from 230 to 289 mg kg-1
(Castellanos-Ramos et al., 2000). Approximately 17 % of the study area is irrigated. The natural vegetation consists of species that can be used for cattle raising, such as
Bouteloua chasei,Muhlenbergia spp., Prosopis spp.,
Camedrioteucrium chamaedrys, Bothriochloa spp.,
Buchloe dactyloides, Aristida divaricata,Liendilla
lanuda, Bouteloua curtipendula, Acacia spp.,
Opuntia spp., and Uncaria tomentosa.
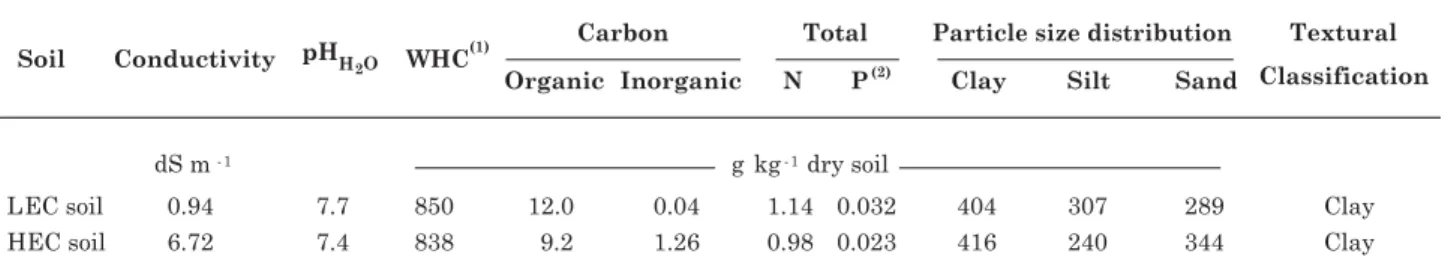
Two agricultural soils with different EC were sampled (Table 1). In each one, three plots of approximately 400 m2
were defined from which 30 soil samples were collected by augering the top 0–15 cm layer. The 30 soil samples from each plot were pooled separately and characterized for a total of six soil samples, i.e., soil from two fields and three plots.
Aerobic incubation
The soil samples were passed through a 5 mm sieve and placed in drums containing a beaker with 100 mL
distilled H2O to avoid desiccation. One contained
100 mL 1 mol L-1
NaOH solution to trap any CO2
evolved for six days.
Sixty soil sub-samples (30 g) from each field and plot were filled in 120 mL glass flasks. Fifteen sub-samples were amended with a solution containing 14
C-labeled glucose (approximately 1.48 MBq kg-1
), 15 with 14
C-labeled glucose plus (NH4)2SO4, 15 with
(NH4)2SO4 and the others were treated with an equal
amount of distilled H2O. The amount of water added
resulted in a soil moisture content of approximately 50 % WHC, and the amounts of C and N added as glucose and NH4
+
were approximately 1,000 mg kg-1
C and 200 mg kg-1 N. Three flasks were chosen at
random from each treatment. Soil was extracted (30 g) for inorganic N and 14
C with 120 mL 0.5 mol L-1
K2SO4 solution to provide zero time samples. The
samples were shaken for 30 min, filtered through Whatman No 42 paperand stored until analysis at
-20 °C (Jenkinson & Powlson, 1976).
The glass flasks were placed in 945 mL glass jars with 10 mL distilled H2O. One contained a vessel
with 20 mL 1 mol L-1
NaOH solution to trap CO2
evolved and another a vessel with 20 mL 2 % H3BO3
solution to trap volatilized NH3. The jars were sealed
airtight and stored in the dark for 21 days at 22 ± 1 °C. After 1, 3, 7 and 21 days, three jars selected at random from each treatment were opened, and the vessels containing NaOH and H3BO3 were removed. An
aliquot of 0.2 mL 1 mol L-1 NaOH solution was taken
and analyzed for 14
C activity. The remaining NaOH and H3BO3 solution was titrated with appropriate
concentrations of H2SO4 to determine CO2 and NH3
trapped, respectively. The soil was removed from the three flasks and 30 g was extracted with 120 mL 0.5 mol L-1
K2SO4 solution. The samples were shaken
for 30 min and filtered through Whatman N° 42 paper and the inorganic and organic N and 14
C were measured as described for zero time samples (Conde et al., 2005).
Chemical analysis
The pH was measured in 1:2.5 soil/H2O suspension
using a glass electrode (Thomas, 1996). Total C was determined by oxidation with potassium dichromate
Table 1. Soil characteristics
(1) WHC: water holding capacity. (2) Total P was measured by aqua regia digestion with sodium carbonate fusion (Crosland et al.,
(K2Cr2O7) and titration of excess dichromate with
(NH4)2FeSO4 (Kalembasa & Jenkinson, 1973), and
inorganic C by adding 5 mL 1 mol L-1 HCl solution to
1 g air-dried soil and trapping CO2 evolved in 20 mL
1 mol L-1
NaOH. Total N was measured by the Kjeldhal method using concentrated H2SO4, K2SO4
and HgO to digest the sample (Bremner, 1996), soil particle size distribution by the hydrometer method as described by Gee & Bauder (1986) and CEC with the barium acetate method (Jackson et al., 1986).
The NH4 +
, NO2
and NO3
in the 0.5 mol L-1
K2SO4
extracts were measured colorimetrically with an automatic Skalar San plus System (the Netherlands). The 14C in the extracts was measured with a
scintillation counter (Beckman LS6000SC, USA). The CO2 in the 1 mol L-1 NaOH was determined by
titration with 0.1 mol L-1
HCl (Jenkinson & Powlson, 1976). The WHC was measured in soil samples water-saturated in a funnel and left to stand overnight and defined by weight differences (Conde et al., 2005).
Statistical analysis
The cumulative production of 12
CO2 and 14
CO2 was
regressed on elapsed time using a linear model forced to pass through the origin, but allowing different slopes (production rates) for each treatment. This approach was supported by the theoretical considerations that no 12CO
2 and 14CO2 was produced
at time zero and a control (flask without soil) accounted for atmospheric 12CO
2 and 14CO2.
The data of soil characteristics, concentration of NH4
+
, NO2
and NO3
-, and extractable 14
C were subjected to one-way analysis of variance using PROC GLM (SAS, 1989) to test for significant differences between treatments with Tukey’s Studentized Range test. Significant differences between treatments for
12CO
2 and 14CO2 production were determined using
PROC MIXED (SAS, 1989).
RESULTS
Extractable 14C and production of 14CO 2
The CO2 production rate was significantly higher
in LEC soil amended with NH4 +
than in the unamended soil, but lower than in soil amended with
14
C labeled glucose or 14
C labeled glucose plus NH4 +
(p < 0.05) (Figure 1a, Table 2). The CO2 production
rate was significantly higher in HEC soil amended with 14C labeled glucose or NH
4+ than in the
unamended soil, but lower than in soil amended with
14C labeled glucose plus NH
4+ (p < 0.05) (Figure 1b,
Table 2). The CO2 production rate was 1.3 times and
significantly higher in LEC soil than in HEC soil (mean of all treatments) (p < 0.05).
The production of 14
CO2 was greater in LEC soil
amended with glucose than in soil amended with
glucose plus NH4+ (Figure 1c, Table 2). The
production of 14
CO2 was lower in HEC soil amended
with glucose than in soil amended with glucose plus ammonium soil (Figure 1d, Table 2). The 14
CO2
production rate was 1.4 times and significantly higher in LEC soil than in HEC soil (mean of all treatments) (p < 0.05).
The amount of extractable 14C was similar in LEC
soil amended with glucose and glucose plus NH4 +
over time (Figure 1e). A sharp drop was detected after the first day and a flattening out afterwards. Based on the concentration of 14C in the soil extracts,
approximately 150 mg C of the added glucose could not be detected one hour after its application in LEC soil and 100 mg glucose-C in HEC soil. Less than 10 mg kg-1 14C soil was measured after 21 days. The
extractable 14
C decreased more slowly in HEC soil than in LEC soil and the residual concentration of
14
C was > 68 mg kg-1 14
C in soil amended with glucose plus NH4+ after 21 days (Figure 1f). The extractable 14
C decreased faster in HEC soil amended with glucose plus NH4+ than in soil amended with glucose and the
Figure 1. Cumulative production of 12
CO20 in (a) LEC
soil and (b) HEC soil, cumulative production of
14
CO2 in (c) LEC soil and d) HEC soil and
extractable 14C in (e) LEC soil and (f) HEC soil
unamended ( ) or amended with 200 mg kg-1
NH4 +
-N dry soil ( ), 1,000 mg kg-1 14
C-labeled glucose C dry soil ( ) or with 200 mg kg-1
NH4 +
-N dry soil plus 1,000 mg kg-114
residual concentration was also higher in the latter, i.e., 245 mg kg-1
. 14
C. The amount of extractable 14
C was significantly higher in HEC than in LEC soil (mean of all treatments) (p < 0.05) (Table 2).
the maximum was lower, reached after seven days. The mean NO2- concentration was similar in LEC
and HEC soil (mean of all treatments) (p < 0.05) (Table 2).
Inorganic N
The emissions of NH3 from both soils < 4 mg kg-1
N soil and treatment had no significant effect on the mean NH3 concentrations volatilized from both the
LEC soil and HEC soils (Table 2). The mean amount of NH3 volatilized was similar for LEC soil and HEC
soil (mean of all treatments) (p < 0.05).
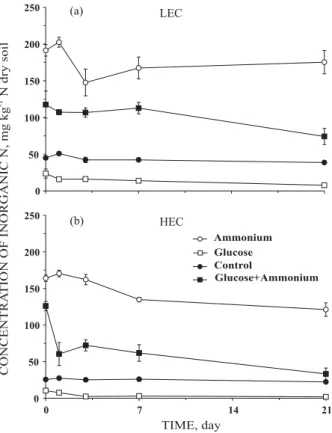
The NH4+ concentrations in the unamended LEC
soil and HEC soil remained < 4 mg kg-1
NH4 +
-N and glucose addition decreased these values < 0.2 mg kg-1
NH4 +
-N (Figure 2a,b). The concentration of NH4 +
was lower in soil amended with glucose plus NH4+ than in
soil amended with NH4 +
alone (Table 2). The mean concentrations of NH4+ were similar in both soils
(mean of all treatments) (p < 0.05).
The pattern of NO2- concentrations in the
unamended LEC soil and soil enriched with NH4+ was
similar, i.e., a small decrease over time, with concentrations < 2 mg kg-1 N (Figure 2c). The NO
2
-concentration in the glucose-amended soil also decreased over time, though the values were higher than in the unamended soil and soil enriched with NH4+. In the glucose-amended soil plus NH4+, the NO2
-concentrations increased sharply to > 7 mg kg-1
NO2
-N on day 1 and 3 and then decreased sharply to < 2 mg kg-1
NO2- N. The NO2- concentrations in the
unamended HEC soil and soil enriched with glucose showed a similar pattern, i.e. a small decrease over time, with concentrations < 2 mg kg-1
N (Figure 2d). The NO2- concentrations in the glucose-amended plus
NH4+ increased to a maximum of 5 mg NO2- N after
three days, and then decreased. In the NH4 +
-amended soil, the concentrations of NO2- showed a similar
pattern as in glucose plus NH4 +
amended soil, but
Figure 2. Concentration of NH4 +
in (a) LEC soil and (b) HEC soil, concentration of NO2- in (c) LEC
soil and (d) HEC soil and concentration of NO3
-in (e) LEC soil and (f) HEC soil. Legends to the figure are given in figure 1.
The NO3- concentration did not change
significantly over time in unamended LEC, but decreased in the glucose-amended soil (p < 0.05)
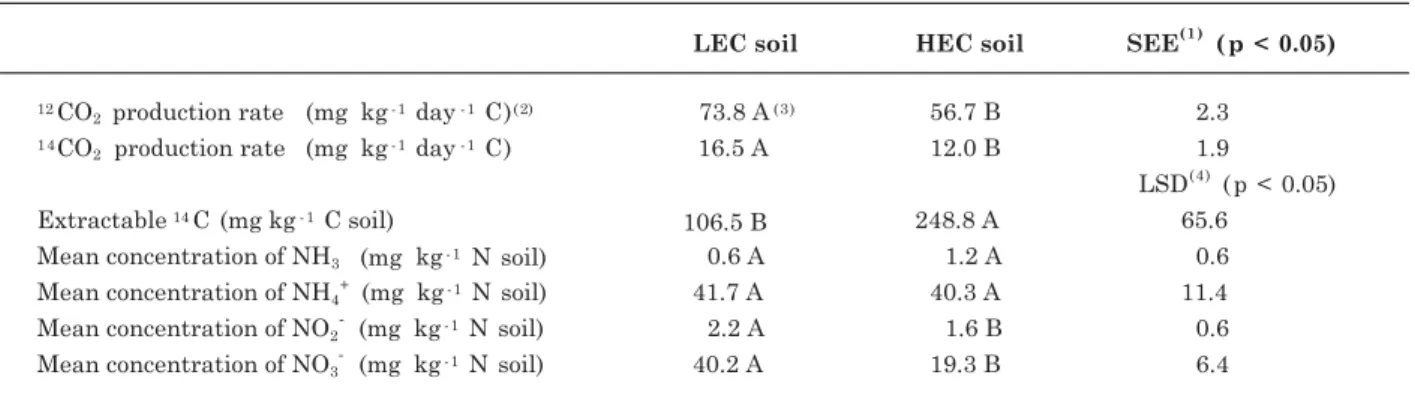
Table 2. The 12
CO2 and 14
CO2 production rate, the mean extractable 14
C (mg kg-1
C soil), mean amount of NH3
volatilized and the mean concentration of NH4 +
, NO2- and NO3- in LEC and HEC soil
(1) SEE: standard error of the estimate (p < 0.05). (2) Mean of the four treatments. (3) Values with the same letter are not
(Figure 2e). In the NH4+ plus glucose and NH4+
amended soil, NO3- increased over time with the
highest increase found in the NH4 +
amended soil. The NO3- concentration did not change significantly over
time in the unamended HEC soil, the glucose and glucose plus NH4
+
-amended soil, but increased in the NH4+-amended soil (p < 0.05) (Figure 2f). The mean
concentration of NO3- was lower in HEC soil than in
LEC soil (mean of all treatments) (p < 0.05) (Table 2).
DISCUSSION
Concentration of extractable 14C
After one day, < 200 mg 14C was extractable from
LEC, but > 500 mg 14
C from HEC soil. After one day, 20 % of the added glucose was mineralized to 14CO
2,
with an efficiency of 60 % for C (Payne, 1970), so only 53 % of the glucose was mineralized although 80 % could not be detected in the soil. Part of the 14
C-labeled glucose was taken up by the microorganisms in LEC soil without being metabolized. A similar lag was observed in HEC soil. Approximately 10 % of the added glucose was mineralized to 14
CO2, at an efficiency of
60 % for C, so only 27 % of the glucose was mineralized although 50 % could not be accounted for in HEC soil. The lag between glucose uptake and utilization for biosynthesis has often been reported (Payne & Wiebe, 1978; Bremer & van Kessel, 1990; Bremer & Kuikman, 1994). It indicates, as stated by Coody et al. (1986), that CO2 evolution is a poor indicator of
glucose uptake rates by soil microbes. The NH4
+
addition reduced the amount of extractable 14C and thus stimulated decomposition of 14
C-labeled glucose. Saline soils are often N depleted and the addition of NO3- or NH4+ to glucose-amended
soil increases CO2 production and a priming effect (as
explained below) may also be observed (Conde et al., 2005).
12CO
2 and 14CO2 production
Approximately 9.4 % of the soil organic matter C was mineralized within 21 days in LEC and 7.7 % in HEC soil. The percentage of organic C mineralized was lowest in the HEC soil. This suggests that salts decreased microbial activity. The decrease in CO2
production, however, was lower than reported by Pathak & Rao (1998), who found that when EC increased from 1.1 dS m-1 to 96.7 dS m-1, the CO
2
respiration decreased from 2.1 to 0.9 g kg-1
CO2-C in
Sesbania-amended soil after 90 days. However, they
added salts to soil (NaCl and CaCl2) to increase EC
whereas the high EC in the HEC soil was the result of a slow salt increase due to irrigation. The microorganisms in the soils used by Pathak & Rao (1998) were not adapted to high salt contents and this might have strongly inhibited their activity. Salt addition to non-saline soils would require the
adaptation of microorganisms to osmostic and/or specific ion stress and would therefore inhibit their activity more strongly.
Approximately 60 % of the glucose-14
C added to LEC soil was evolved as 14
CO2 and 50 % in LEC soil
amended with glucose plus NH4+. The percentage of
mineralized glucose-C in the LEC soil was similar to values reported in literature. Bremer & Kuikman (1994) found that approximately 60 % glucose was mineralized in a sandy loam soil and silt loam soil after 35 days when ≥ 576 mg kg-1
of glucose C soil had been added.
The amount of glucose-14
C mineralized was only 37 % in HEC soil. The higher EC in HEC than in LEC soil presumably explained the lower amount of glucose 14
C respired to 14
CO2, although the effect of
other soil characteristics on glucose decomposition can not be ruled out. Clay content has often been found to affect the decomposition of organic material fertilization (Sørensen, 1981; van Veen et al., 1985; Amato & Ladd, 1992) as does the pH (Saggar et al., 1999), but pH and clay were similar in both soils. The specific surface area of the clay, and the nature rather than the amount of the clay mineral has also been found to affect the decomposition of organic material (Saggar et al., 1996; Torn et al., 1997), but this effect is presumably more important in the long term than in short-term laboratory incubation experiments. Considering the above, it appears that EC was the factor that explained most of the reduction in mineralization of glucose added.
Compared to the unamended soil, the application of glucose increased CO2 production to 784 mg kg-1 C
in LEC soil and to 525 mg kg-1
C in HEC soil after 21 days, but the amount of 14
CO2 produced was only
660 and 374 mg kg-1
C in LEC soil and HEC soil, respectively. The accelerated decomposition of unlabeled soil organic matter following the addition of organic material has often been referred to as a “priming effect”, and has been a matter of controversy for many years (Brookes et al., 1990). However, the conditions for an apparent priming effect, such as non-uniformly labeled substrate or a great substrate addition, are absent in this experiment and the bicarbonate in the soil solution could not explain the differences either, as they were similar in both soils, i.e., 0.26 cmolc kg
-1
HCO3-. Brookes et al. (1990)
described situations where a true priming effect is mainly caused by an increased turnover of microbial cell C (after glucose addition) or by an increased decomposition of native soil organic matter (after addition of rye-grass). In the first situation, the new microbial biomass partly replaces the native, resulting in a greater production of unlabeled CO2. In the
second, the new microbial biomass is added to the already present native biomass and the increase in CO2 production results from an increased contact
Compared to the soil amended with NH4+, the
application of glucose plus NH4 +
increased the CO2
production to 364 mg kg-1
C in LEC soil and to 369 mg kg-1 C in HEC soil after 21 days, but the
amount of 14
CO2 produced was 515 and 520 mg kg -1
C for LEC soil and HEC soil, respectively. As such, the addition of NH4+ to the glucose-amended soil
induced a negative priming effect. The addition of different substances to the soils might cause not only an acceleration of mineralization or positive priming effect, but also a reduction or a negative priming effect. A negative priming effect has often been reported for N, e.g. N immobilization and a temporal N unavailability, but less often for C. It is difficult to indicate which mechanisms might contribute to a negative priming effect, but Kuzyakov et al. (2000) stated that when a negative priming effect occurs the microbial biomass switches from metabolizing soil organic matter to easily available C sources, stimulated by NH4
+
. Another possibility is that the addition of an easily decomposable substrate plus NH4+
induced the growth of an active glucose-decomposing population that inhibits the activity of a passive population decomposing soil organic matter. It might also be that the addition of NH4
+
itself inhibited microbial activity by the formation of NH3. NH3 is
toxic and known to inhibit microbial activity.
Inorganic N
The factors that normally most affect NH3
volatilization are concentrations of NH4 +
, pH and water content (Kirchmann & Witter, 1989). Both soils had similar water contents, pH and mean NH4+
concentrations so the mean amounts of NH3
volatilized were similar (Table 2).
It has often been reported that nitrification and especially oxidation of NO2- to NO3- is inhibited by
high salt concentrations (Darrah et al., 1987; Low et al., 1997; Pathak & Rao, 1998). However, in the experiment reported here the mean NH4+ and NO2
-concentrations were similar so it appeared that the nitrification process was not inhibited.
The concentration of inorganic N (sum of NH4 +
, NO2- and NO3-) decreased over time in HEC soil
amended with NH4 +
, but not in LEC soil (Figure 3). The amount of N lost through NH3 volatilization was
similar in both soils so HEC was N-depleted, but not the LEC soil. Additionally, the concentration of inorganic N in HEC amended with glucose plus NH4
+
was lower than in LEC soil, i.e. N immobilization was higher in HEC than in LEC soil.
CONCLUSIONS
1. Organic matter decomposition and N mineralization were most affected in the HEC soil.
2. In HEC soil, the addition of NH4 +
led to N immobilization.
3. NH4 +
and NO2- oxidation was not inhibited in
the HEC as it was in the LEC soil.
ACKNOWLEDGEMENTS
We thank J.M. Ceballos, M. Mercado and I. Vargas for technical assistance and L. M. Salgado for assistance with the scintillation counter. The research was funded by the Department of Biotechnology and Bioengineering, Cinvestav, Mexico City, Mexico and Fondo Sectorial de Investigación Ambiental SEMARNAT-CONACyT research Grant FOSEMARNAT-C01-424. A. V-S and R. H-M received grant-aided support from CONACyT and CONCYTEG.
LITERATURE CITED
AGUIRRE, G.A. Química de los suelos salinos y sódicos. México, Universidad Nacional Autonoma de México, 1993. 130p.
Figure 3. Concentration of inorganic N (NH4 +
, NO2
-and NO3-) in (a) LEC soil and (b) HEC soil.
AMATO, M. & LADD, J.N. Decomposition of 14C-labeled
glucose and legume material in soils: Properties influencing the accumulation of organic residue C and microbial biomass C. Soil Biol. Biochem., 24:455-464, 1992.
ATLAS, R.M. & BARTHA, R. Ecologia microbiana y microbiologia ambiental. Madrid, Pearson Educacion, 2002. 367p.
BANDYOPADHYAY, B.K. & BANDYOPADHYAY, A.K. Effect of salinity on mineralization and immobilization of nitrogen in a coastal saline soil of West Bengal. Ind. J. Agric., 27:41-50, 1983.
BERNSTEIN, N. & KAFKAFI, U. Root growth under salinity stress. In: WAISEL, Y.; ESHEL, A. & KAFKAFI, U., eds. Plant roots: The hidden half. 2.ed. New York, Marcel Dekker, 1996. p.787-805.
BOHN, H.L.; MCNEAL, B.L. & O’CONNOR, G.A. Soil chemistry. New York, Wiley-Interscience, 1979. 329p BREMER, E. & van KESSEL, C. Extractability of microbial
14C and 15N following addition of variable rates of labeled
glucose and (NH4)2SO4 to soil. Soil Biol. Biochem.,
22:707-713, 1990.
BREMER, E. & KUIKMAN, P. Microbial utilization of
14C[U]glucose in soil is affected by the amount and timing
of glucose additions. Soil Biol. Biochem., 26:511-517, 1994. BREMNER, J.M. Nitrogen-total. In: SPARKS, D.L., ed. Methods of soil analysis: Chemical methods. Madison, Soil Science Society of America/American Society of Agronomy, 1996. Part 3.p.1085-1122.
BROOKES, P.C.; OCIO, J.A. & WU, J. The soil microbial biomass: Its measurements, properties and role in soil nitrogen and carbon dynamics following substrate incorporation. Soil Microorg., 35:39-51, 1990.
CASTELLANOS-RAMOS, J.; HURTADO-GARCÍA, B.; VILLALOBOS-REYES, S.; BADILLO-TOVAR, V.; VARGAS-TAPIA, P. & ENRÍQUEZ-REYES, S. Características físicas y químicas de los suelos del Estado de Guanajuato, a partir de los análisis de laboratorio del campo experimental Bajío del INIFAP. Bajío, 2000. (Reporte Técnico del Proyecto 47/99 de la Fundación Guanajuato Produce A. C.)
CONDE, E.; CARDENAS, M.; PONCE-MENDOZA A.; LUNA-GUIDO, M.L.; CRUZ-MONDRAGÓN, C. & DENDOOVEN, L. The impacts of inorganic nitrogen application on mineralization of 14C – labeled maize and glucose, and on
priming effect in saline alkaline soil. Soil Biol. Biochem., 37:681-691, 2005.
COODY, P.N.; SOMMERS, L.E. & NELSON, D.W. Kinetics of glucose uptake by soil microorganisms. Soil Biol. Biochem., 18:283-289, 1986.
DARRAH, P.R.; NYE, P.H. & WHITE, R.E. The effect of high solute concentrations on nitrification rates in soil. Plant Soil, 97:37-45, 1987.
GEE, G.W. & BAUDER, J.W. Particle size analysis. In: KLUTE, A., ed. Methods of soil analysis: Physical and mineralogical methods. 2.ed. Madison, Soil Science Society of America/ American Society of Agronomy, 1986. Part 1. p.383-411.
GIAMBIAGI, N. & LODEIRO, A. Response of the bacterial microflora of a sodic saline soil to different concentrations of nitrogen and sodium in agar culture. Soil Biol. Biochem., 21:177-178, 1989.
HAYNES, R.J. & RIETZ, D.N. Effects of irrigation-induced salinity and sodicity on soil microbial activity. Soil Biol. Biochem., 35:845-854, 2003.
JACKSON, M.L.; LIM, C.H. & ZELAZNY, L.W. Oxides, hydroxides, and aluminosilicates In: KLUTE, A., ed. Methods of soil analysis: Physical and mineralogical methods. 2.ed. Madison, Soil Science Society of America/ American Society of Agronomy, 1986. Part 1. p.101-150. JENKINSON, D.S. & POWLSON, D.S. The effects of biocidal treatments on metabolism in soil. I. Fumigation with chloroform. Soil Biol. Biochem., 8:167-177, 1976. JOHNSTON, D.D. & GUENZI, W.D. Influence of salts on
ammonium oxidation and carbon dioxide from soil. Soil Sci. Am. Soc. Proc., 27:663-666, 1963.
KALEMBASA, S.J. & JENKINSON, D.S. A comparative study of titrimetric and gravimetric methods for the determination of organic carbon in soil. J. Sci. Food Agric., 24:1085-1090, 1973.
KIRCHMANN, H. & WITTER, E. Ammonia volatilization during aerobic and anaerobic manure decomposition. Plant Soil, 115:35-41, 1989.
KUZYAKOV, Y.; FRIEDEL, J.K. & STAHR, K. Review of mechanisms and quantification of priming effects. Soil Biol. Biochem., 32:1485-1498, 2000.
LOW, A.P.; STARK, J.M. & DUDLEY, L.M. Effects of soil osmotic potential on nitrification, ammonification, N assimilation and nitrous oxide production. Soil Sci., 162:16-27, 1997.
MCCORMICK, R.W. & WOLF, D.C. Effect of sodium chloride on CO2 evolution, ammonification and nitrification in a
Sassafras sandy loam. Soil Biol. Biochem.,12:153-157, 1980.
PANKHURTS, C.E.; YU, S.; HAWKE, B.G. & HARCH, B.D. Capacity of fatty acid profiles and substrate utilization patterns to describe differences in soil microbial communities associated with increased salinity or alkalinity at three locations in South Australia. Biol. Fert. Soils, 33:204-217, 2001.
PATHAK, H. & RAO D.L.N. Carbon and nitrogen mineralization from added organic matter in saline and alkaline soils. Soil Biol. Biochem., 30:695-702, 1998.
PAYNE, W.J. Energy yields and growth of heterotrophs. Ann. Rev. Microbiol., 24:17-52, 1970.
PAYNE, W.J. & WIEBE, W.J. Growth yield and efficiency in chemosynthetic microorganisms. Ann. Rev. Microbiol., 32:155-183, 1978.
SAGGAR, S.; PARSHOTAM, A.; SPARLING G.P.; FELTHAM, C.W. & HART P.B.S. 14C-labeled glucose turnover in
SAGGAR, S.; PARSHOTAM, A.; HEDLEY C. & SALT G. 14
C-labeled glucose turnover in New Zealand soils.Soil Biol. Biochem., 31:2025-2037, 1999.
SARDHINA, M.; MŸLLER, T.; SCHMEISKY, H. & JOERGENSEN, R.G. Microbial performance in soils along salinity gradient under acidic conditions. Appl. Soil Ecol., 23:237-244, 2003.
SAS Institute. Statistical guide for personal computers. Version 6.04. Cary, 1989.
SØRENSEN, L.H. Carbon-nitrogen relationships during the humification of cellulose in soils containing different amounts of clay. Soil Biol. Biochem., 13:313-321, 1981.
TERRONES-RINCÓN, R.; MEJÍA-ÁVILA, C. & GARCÍA-NIETO, H. Índices agroclimáticos de Guanajuato. Bajío, Secretaría de Agricultura, Ganadería y Desarrollo Rural del Estado de Gto., INIFAP, 2000.
THOMAS, G.W. Soil pH and soil acidity. In: SPARKS, D.L., ed. Methods of soil analysis: Chemical methods. Madison, Soil Science Society of America/American Society of Agronomy, 1996. Part 3. p.475-490.
TORN, M.S.; TRUMBORE, S.E.; CHADWICK, O.A.; VITOUSEK, P.M. & HENDRICKS, D.M. Mineral control of soil organic carbon storage and turnover. Nature, 389:170-173, 1997.
van VEEN, J.A.; LADD, J.N. & AMATO, M. Turnover of carbon and nitrogen through the microbial biomass in a sandy loam and a clay soil incubated with [14C(U)]glucose and
[15N](NH
4)2SO4 under different moisture regimes. Soil
Biol. Biochem., 17:747-756, 1985.
VEGA-JARQUÍN, C.; GARCÍA-MENDOZA, M.; JABLONOWSKI, N.; LUNA-GUIDO, M. & DENDOOVEN, L. Rapid immobilization of applied nitrogen in saline-alkaline soils. Plant Soil., 256:379-388, 2003.