Sónia Isabel Pereira Branco
Licenciatura em Ciências da Engenharia Química e Bioquímica
Aqueous Biphasic System based on
Cholinium Ionic Liquids: Extraction of
Biologically Active Phenolic Acids
Dissertação para obtenção do Grau de Mestre em
Engenharia Química e Bioquímica
Orientador:
Doutora Isabel Maria Delgado Jana Marrucho
Ferreira, Investigadora Coordenadora, Laboratório de
Termodinâmica Molecular, ITQB-UNL
Presidente:Doutora Susana Filipe Barreiros
Arguente:Doutor Alexandre Babo de Almeida Paiva
Faculdade de Ciências e Tecnologia
Departamento de Química
Aqueous Biphasic System based on Cholinium Ionic Liquids:
Extraction of Biologically Active Phenolic Acids
Sónia Isabel Pereira Branco
Dissertação apresentada na Faculdade de Ciências e Tecnologia da Universidade
Nova de Lisboa para obtenção do grau Mestre em Engenharia Química e Bioquímica
Orientadores: Doutora Isabel Maria Delgado Jana Marrucho Ferreira
of Biologically Active Phenolic Acids
COPYRIGHT
Sónia Isabel Pereira Branco
Faculdade de Ciências e Tecnologia
Universidade Nova de Lisboa
Durante a realização desta tese, contei com o apoio de várias pessoas sem as quais não teria concluído esta etapa. A realização desta tese e as pessoas que me acompanharam nos últimos meses permitiu-me crescer tanto a nível pessoal como intelectual.
Quero começar por agradecer à minha orientadora, a investigadora Doutora Isabel Marrucho, por me ter facultado esta oportunidade em realizar a minha dissertação de mestrado num local prestigiado como o ITQB. Foi uma experiência única onde pude aprender novos conceitos que espero que me sejam úteis para o meu futuro como Engenheira.
Quero também retribuir à Catarina Florindo a aprendizagem que ela me concedeu desde o primeiro dia no ITQB e pela paciência que teve para me incentivar a trabalhar sempre e especialmente com garra quando o trabalho e o ânimo estavam em baixo.
Não poderia deixar de agradecer às minhas colegas de curso que ao longo destes cinco anos me apoiaram, me ensinaram e me fizeram ser uma pessoa mais confiante e com maior autoestima. Foram laços de amizade que se criaram e que permanecerão para sempre.
Um especial obrigado à minha colega da tese, Andreia Gouveia, que me aturou nos últimos sete meses e foi o meu ombro de apoio em dias cinzentos. Quero agradecê-la pelos intermináveis desabafos e pela partilha de bons momentos. Pela amizade, companhia de mesa de secretária e pelo apoio nos momentos de maior angústia.
Ao meu namorado Diogo Duarte, que substituiu a presença dos meus pais, cuidou de mim, levou-me sempre a acreditar que seria capaz de chegar ao fim e esteve sempre presente nos momentos bons e menos bons. Graças a ele, consegui superar todos os obstáculos e lutei constantemente para conseguir chegar o mais longe possível. Ensinou-me a nunca desistir dos meus sonhos.
E finalmente à minha família, em especial aos meus pais, um enorme obrigado por terem acreditado em mim e por me terem ensinado a ser a pessoa que sou hoje. Apesar da distância, da tristeza e de muito choro pelo meio, quero retribuir e compensar todo o carinho, apoio e dedicação que me foi oferecido ao longo destes anos. Pais, dedico-vos esta tese.
Sistemas aquosos bifásicos, líquidos iónicos, ácidos fenólicos, extração, compostos naturais bioativos.
Resumo
Os ácidos fenólicos são metabolitos secundários provenientes de plantas aromáticas e amplamente espalhados por todo o reino vegetal. Uma vez que as suas propriedades biológicas e farmacológicas têm vindo a desempenhar um papel importante na fitoterapia, estão a ser estudadas e desenvolvidas técnicas para a separação e purificação destes compostos naturais. Esta tese tem como objetivo explorar novos processos de separação sustentáveis com base em líquidos iónicos (LIs) para a extração de ácidos fenólicos biologicamente ativos. Para tal, foram selecionados três ácidos fenólicos com estruturas químicas semelhantes: ácido cinâmico, ácido p-cumárico e ácido cafeico. Nos últimos anos, tem sido demonstrado que os sistemas aquosos bifásicos (SABs) baseados em líquidos iónicos são alternativas válidas para extração, recuperação e purificação de biomoléculas, quando comparado com SABs convencionais ou com extrações feitas com solventes orgânicos. As colinas representam um avanço em direção a uma química mais sustentável, proporcionando meios para a implementação de técnicas mais eficientes para a separação e purificação de biomoléculas.
Neste trabalho, os sistemas aquosos bifásicos foram implementados utilizando colinas e usando um sal inorgânico de alta densidade de carga (K3PO4) ou um polímero de baixo peso molecular
Aqueous biphasic systems, ionic liquids, phenolic acids, extraction, biologically active natural compounds.
Abstract
Phenolic acids are aromatic secondary plant metabolites, widely spread throughout the plant kingdom. Due to their biological and pharmacological properties, they have been playing an important role in phytotherapy and consequently techniques for their separation and purification are in need.
List of Abbreviations ... XV
Lisf of Simbology ... XVII
List of Figures ... XIX
List of Tables ... XXIII
1. Introduction ... 25
1.1 Motivation ... 27
1.2 ABS – Aqueous Biphasic System ... 28
1.3 Ionic Liquids-based Aqueous Biphasic Systems ... 30
1.3.1 Salting effects in Ionic Liquid aqueous solutions ... 33
1.3.2 Applications of ionic liquid-based ABS: extraction of biomolecules and added-value compounds ... 35
1.4 Phenolic Acids ... 37
1.5 Objectives ... 41
2. Methodologies ... 43
2.1 Chemicals and equipment ... 45
2.2 Methods ... 47
2.2.1 Physicochemical properties of IL-based ABS ... 47
2.2.2 Partitioning coefficients and extraction efficiencies ... 48
3. Quantification of Phenolic Acids ... 51
3.1 Cinnamic, p-Coumaric and Caffeic Acids ... 53
3.2 Calibration Curves ... 57
4. Ionic Liquid + Phenolic Acid (aq.) + K3PO4 systems ... 67
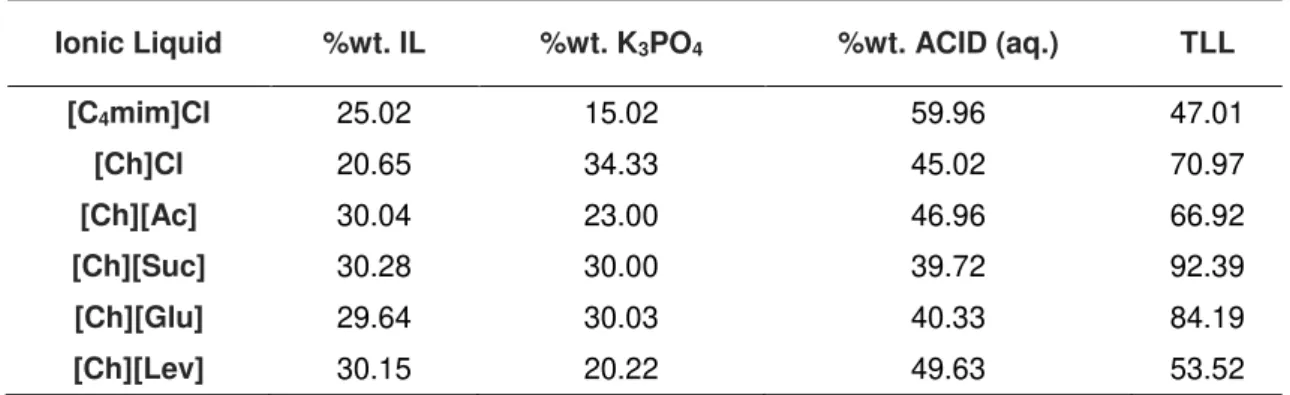
4.1 Implementation of K3PO4-based aqueous biphasic systems for the extraction of phenolic acids ... 69
4.3 Physicochemical properties of IL-based ABS ... 70
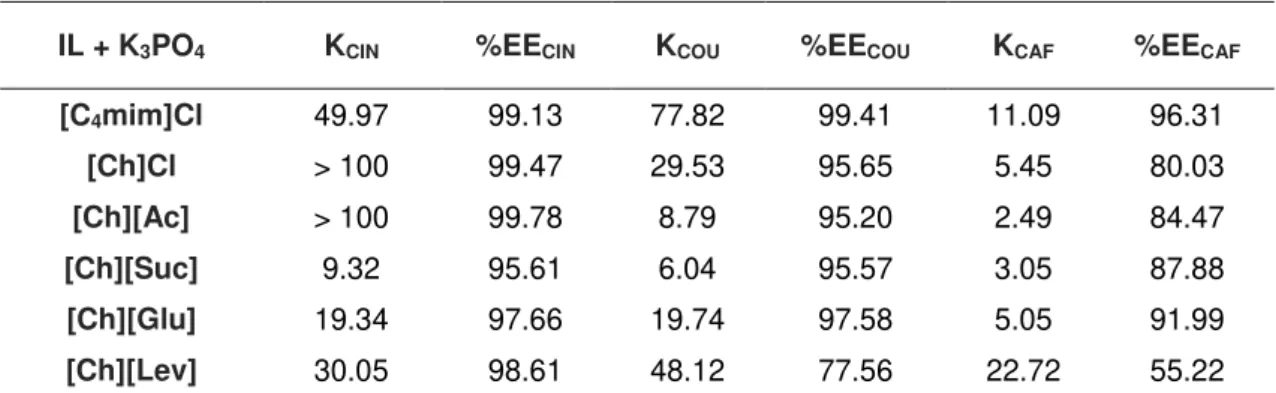
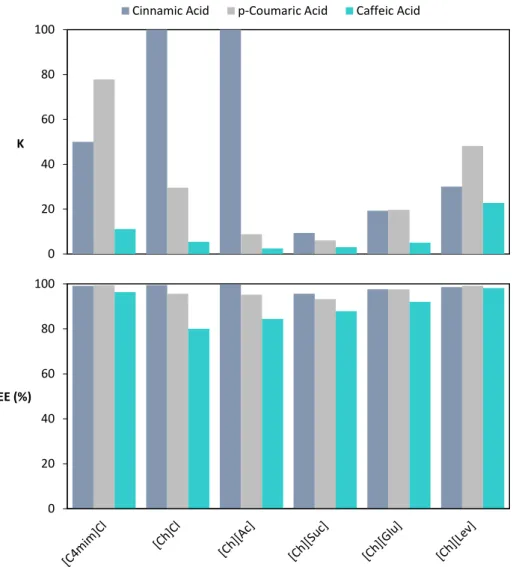
4.4 Partitioning coefficients and extraction efficiencies ... 72
4.5 Influence of Ionic liquid ions in phenolic acids partitioning ... 74
4.6 Effect of concentration of the phenolic acids in their partitioning ... 76
5. Ionic Liquid + Phenolic Acid (aq.) + Polyethylene Glycol systems ... 81
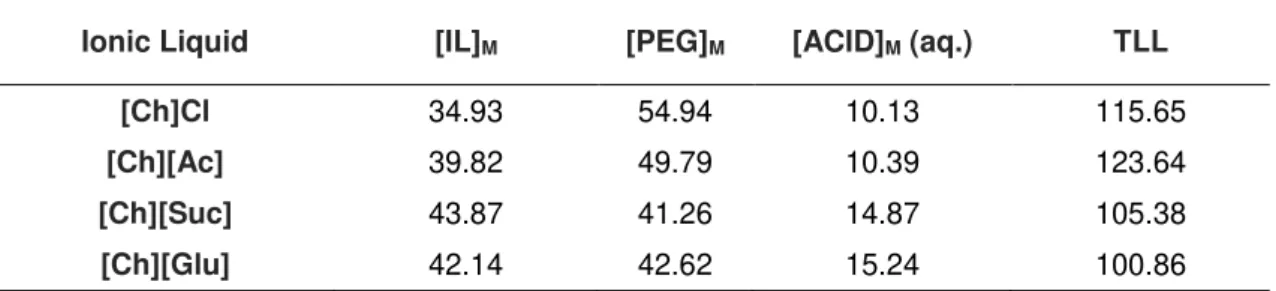
5.1 Implementation of PEG-based ABS ... 83
5.2 Physicochemical properties of IL-based ABS ... 84
5.3 Partitioning coefficients and extraction efficiencies ... 87
5.4 Influence of Ionic liquid ions in phenolic acids partitioning ... 91
8. References ... 103
References ... 105
Appendix A ... 109
Spectra of Phenolic Acids ... 111
Appendix B ... 115
Calibration Curves ... 117
Appendix C ... 120
Physicochemical Properties of Ionic Liquids ... 122
Experimental Data of the Partition Coefficients ... 123
Synthesis of Ionic Liquids ... 125
Appendix D ... 126
Mass Transfer... 128
Mass Transfer in IL + Phenolic Acids (aq.) + K3PO4 systems ... 128
Mass Transfer in IL + Phenolic Acids (aq.) + Polyethylene Glycol systems ... 130
Appendix E ... 131
ABS Aqueous Biphasic System
IL Ionic Liquid
IS Inorganic Salt
CIN Cinnamic Acid
COU p-Coumaric Acid
CAF Caffeic Acid
UV-Vis Ultra-Violet Visible
NMR Nuclear Magnetic Resonance
K3PO4 Potassium Phosphate Tribasic PEG 600 Polyethylene Glycol 600
H2O Pure water (system Milli-Q)
[C4mim]Cl 1-butyl-3-methylimidazolium Chloride [Ch]Cl Cholinium Chloride
[Ch][Ac] Cholinium Acetate [Ch][Suc] Cholinium Succinate [Ch][Glu] Cholinium Glutarate [Ch][Lev] Cholinium Levulinate
Abs Absorbance
KACID Partition Coefficient of Acid
LogKACID Logarithm of Partition Coefficient of Acid
TLL Tie Line Length
EE Percentage Extraction Efficiency
[ACID]IL Concentration of Acid in the IL-rich phase [ACID]K3PO4 Concentration of Acid in the K3PO4-rich phase [ACID]PEG Concentration of Acid in the PEG 600-rich phase mACID-IL Mass of Acid in the IL-rich phase
mACID-K3PO4 Mass of Acid in the K3PO4-rich phase mACID-PEG Mass of Acid in the PEG 600-rich phase
pKa Acid Dissociation Constant
ppm Parts-per million
λ Wavelength
ρ Density
µ Dynamic Viscosity
S Solubility
A Absorbance
ε Molar Absorptivity
b Path Length
Mw Molecular Weight
R2 Coefficient of determination
List of Figures
Figure 1.1 – Some commonly used cations and anions in ionic liquids. ... 30
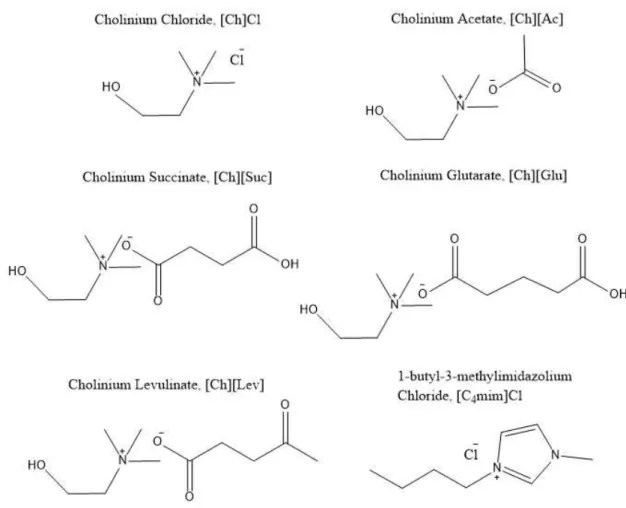
Figure 1.2 – Chemical structures, respective name and acronyms of all ILs investigated. ... 32
Figure 1.3 – Chemical structures of the phenolic acids investigated. ... 38
Figure 1.4 – Extraction techniques and instrumental quantification analysis for phenolic acids. 39 Figure 2.1 – Water activities at room temperature of cholinium-based ABSs: (●) [Ch]Cl; (×) [Ch][Ac]; (■) [Ch][Suc]; (◊) [Ch][Glu]. ... 46
Figure 2.2 – (a) Experimental set up used for the determination of the partition coefficients and extraction efficiencies of phenolic acids and (b) macroscopic appearance of an ABS composed of an ionic liquid (used in this work) and an inorganic salt (K3PO4). ... 49
Figure 2.3 – Generalized flow sheet of the liquid–liquid extraction of phenolic acids. ... 49
Figure 3.1 – Chemical species and speciation of cinnamic acid. ... 53
Figure 3.2 – Chemical species and speciation of p-coumaric acid. ... 54
Figure 3.3 – Chemical species and speciation of caffeic acid. ... 54
Figure 3.4 – Spectras of cinnamic, p-coumaric and caffeic acids in water at room temperature. ... 55
Figure 3.5 – SHIMADZU UV-1800 Spectrophotometer (UV/vis) used in this work. ... 57
Figure 3.6 – UV-vis spectra of cinnamic acid in water (full line) and in aqueous solution of 40% of K3PO4 (dashed line). ... 58
Figure 3.7 – UV-Vis spectra of p-coumaric acid in water (full line) and in an aqueous solution of 40% of K3PO4 (dashed line). ... 58
Figure 3.8 – UV-Vis spectra of caffeic acid in water (full line) and in an aqueous solution of 40% of K3PO4 (dashed line). ... 59
Figure 3.9 – Possible mechanism of p-coumaric complexation with K3PO4. ... 60
Figure 3.10 – Possible mechanism of caffeic acid complexation with K3PO4. ... 61
Figure 3.11 – Scheme of the partitioning of caffeic acid in alkaline medium. ... 62
Figure 3.12 – Experimental UV spectra of p-coumaric acid at different compositions of K3PO4 (%wt.)and respective pH values with [COU] = 0.0133 g∙L-1, at room temperature. ... 63
Figure 3.13 – Experimental UV spectra of caffeic acid at different compositions of K3PO4 (%wt.) and respective pH values with [CIN] = 0.0195 g∙dm-1, at room temperature. ... 63
Figure 4.1 – Phase diagrams of the ternary systems composed of K3PO4 + ionic liquid + H2O at 298 K (percentage weight fraction): ( )[Ch]Cl; (+) [Ch][Ac]; ( ) [Ch][Suc]; (◊) [Ch][Glu]; (▲) [Ch][Lev]; (●) [C4mim]Cl, literature data (3, 8, 40). ... 69
Figure 4.2 –Density (ρ) and viscosity (η) of the coexisting phases in ABS composed of IL + K3PO4 + H2O at 298.15 K. ... 70
Figure 4.3 – Partition coefficients (KACID) and extraction efficiencies percentages (%EEACID) of cinnamic acid (■), p-coumaric acid (■) and caffeic acid (■) for the systems composed of IL + K3PO4 at room temperature. ... 73
Figure 9.1 – Spectra of cinnamic acid absorbance at a wavelength of 270.1 nm in different
diluted aqueous solutions. ... 111
Figure 9.2 – Spectra of p-coumaric acid absorbance at a wavelength of 286 nm in different aqueous solutions. ... 111
Figure 9.3 – Spectra of caffeic acid absorbance at a wavelength of 290 nm in different diluted aqueous solutions. ... 112
Figure 9.4 – Spectra of p-coumaric acid absorbance at a wavelength of 331 nm in different diluted aqueous solutions of K3PO4. ... 112
Figure 9.5 – Spectra of caffeic acid absorbance at a wavelength of 267.5 nm in different diluted aqueous solutions of K3PO4. ... 113
Figure 9.6 – Spectra of p-coumaric acid (286 nm) in IL-rich phase of system composed of PEG 600 + Cholinium-based IL. ... 113
Figure 9.7 – Spectra of p-coumaric acid (286 nm) in PEG 600-rich phase of system composed of PEG 600 + Cholinium-based IL. ... 114
Figure 10.1 – Calibration curve for cinnamic acid (270.1 nm) in aqueous solution at room temperature. ... 117
Figure 10.2 – Calibration curve for p-coumaric acid (286 nm) in aqueous solution at room temperature. ... 117
Figure 10.3 – Calibration curve for caffeic acid (290 nm) in aqueous solution at room temperature. ... 117
Figure 10.4 – Calibration curve for caffeic acid (312 nm) in aqueous solution at room temperature. ... 118
Figure 10.5 – Calibration curve for p-coumaric acid (331 nm) in aqueous solution of K3PO4 at room temperature. ... 118
Figure 10.6 – Calibration curve for caffeic acid (267.5 nm) in aqueous solution of K3PO4 at room temperature. ... 118
Figure 10.7 – Calibration curve for p-coumaric acid in PEG 600 (●) and IL-rich (▲) phases at room temperature. ... 119
Figure 13.1 –1H-NMR spectrum of [Ch][Suc] in D2O... 133
Figure 13.2 –1C-NMR spectrum of [Ch][Suc] in D2O... 133
Figure 13.3 –1H-NMR spectrum of [Ch][Glu] in D2O. ... 134
List of Tables
Table 1.1 – Structures of some prominent naturally occurring phenolic acids. ... 37 Table 2.1 – Typical water content data obtained for all the ILs studied in this work. ... 45 Table 3.1 – Solubility in water (SW) and dissociation constants of phenolic acids at 298.2 K (31-33). ... 53 Table 3.2 – Wavelengths of functional group constituents of phenolic acids. ... 56 Table 3.3 – Wavelengths corresponding to the maximum absorption and respective pH in water and in an aqueous solutions of K3PO4. ... 59 Table 3.4 – Effect of the compositions of K3PO4 in the absorbance p-Coumaric acid and pH values, at room temperature. ... 64 Table 3.5 – Effect of the compositions of K3PO4 in the absorbance p-Coumaric acid and pH values, at room temperature. ... 64 Table 3.6 - Calibration curves for each phenolic acid in aqueous solutions with or without K3PO4. ... 65 Table 4.1 – Composition of the initial mixtures used to prepare the ampoules. ... 69 Table 4.2 – Comparison of the pH, density and viscosity at 298.15 K for the two phase in equilibrium in theK3PO4 - based ABS used in the present work... 70 Table 4.3 – Partition coefficient and extraction efficiencies of phenolic acids obtained in this work at room temperature. ... 72 Table 4.4 – Concentration of the phenolic acids in two new aqueous solutions, at room
Table 6.3 – Partition coefficients of caffeic (KCAF) and p-coumaric (KCOU), and selectivity parameters for the caffeic + p-coumaric (SCAF/COU) pair in the ABS composed of PEG 600 + [Ch][Ac] at room temperature. ... 98 Table 10.1 –Viscosity (η) and density (ρ) of the coexisting phases in ABS composed of
cholinium-based ionic liquid + PEG 600 + H2O at various temperatures. ... 122 Table 10.2 – Partition coefficients (K), respective standard deviations (σ) and mixture
compositions at room temperature. ... 123 Table 10.3 –Partition coefficients (K), respective standard deviations (σ) and mixture
1.1 Motivation
Separation and purification technologies play a central role in the chemical industry not only due to their impact in the quality of the final product, but also to the high level of energy and enormous amounts of solvent mixtures to separate. Typically, organic volatile solvents (VOCs) are mostly used in separation processes due not only to their properties such as immiscibility in water, but also to its low cost. As environmental concerns about VOCs increase and new more restrictive regulations are imposed, there is a growing interest in finding novel environmental friendly replacement solvents for the liquid–liquid separation processes. As alternatives to VOCs ionic liquids have been emerging as a new class of solvents. Ionic liquids belong to the organic salt class and present an attractive combination of properties. Among these properties, the most important is, perhaps, their flexibility to be designed and thus the possibility of tuning the chemical structure and thus the properties given any specific application. The advantages of the implementation of extraction techniques using these solvents was soon realized by the scientific community and research on this topic has been proficuous. In particular, the development of aqueous biphasic systems, systems where water is the major component in both phases, has been reported as an attractive technique for the separation and purification of biomolecules. The recent interest in compounds derived from natural sources, opposing compounds synthesized through chemical routes, has been motivating a lot of research not only on the benefits of natural compounds and extracts but also on the development of extraction techniques suitable for natural matrices. In particular, phenolic acids present in fruits and vegetables, display an important protective role against oxidative damage diseases (coronary heart disease, stroke and cancers).
1.2 ABS
–
Aqueous Biphasic System
In industry, liquid–liquid extraction processes are important techniques used for the extraction and purification of biomolecules due to their high versatility, ranging from an higher yield, improved purity degree, proper selectivity, technological simplicity and lower cost, to a good combination between the recovery and purification steps.(1) The extraction of biomolecules is typically carried out using volatile organic solvents because of their immiscibility with aqueous media. The most commonly used organic solvents present some disadvantages, such as high volatility and toxicity. Aiming at avoiding the use of organic volatile solvents as the extractive phase, one of the potential methods relays on the implementation of aqueous biphasic systems (ABSs). This technique is relatively simple and inexpensive, of easy operation allowing its scale-up, and further ensures the purification and concentration stages to be integrated in a single step procedure.
Since ABSs are mainly composed of water they were immediately recognized as biocompatible processes. In the last decade (since the 1980’s), it has been extended to the separation of cells, membranes, viruses, proteins, nucleic acids, enzymes and other added-value biomolecules. Separation of biomolecules using ABSs as an alternative to traditional liquid–liquid extraction techniques, dates to 1958 and was introduced by Albertson.(2)
An aqueous biphasic system consist of two aqueous-rich phases containing typically polymer– polymer, polymer–salt or salt–salt combinations that phase separate above a given concentration: one of the aqueous phases will be enriched in one of the solutes while in the other phase there is prevalence for the second polymer or salt.(3, 4) Traditionally, ABSs are formed by combining aqueous solutions of two hydrophilic polymers, such as polyethylene glycol (PEG) and dextran, or alternatively, a polymer and an inorganic salt, such as the PEG-sodium phosphate system.(5) Recently, other species, namely proteins or surfactants, have also been studied to induce the formation of ABSs when mixed with polymers or salts. However, of all the solutes capable of forming ABS, the recent application of ionic liquids (ILs) appears as one of the most attractive. In 2003, Rogers and co-workers(6) showed that ABSs could be formed by mixing a hydrophilic IL and a high charge density inorganic salt.
1.3 Ionic Liquids-based Aqueous Biphasic Systems
The study of a new group of environmentally friendly solvents, ionic liquids, has grew intensely during the last decade and the implementation of ionic liquid-based ABSs for the effective extraction and purification of the most diverse biomolecules, where results up to complete extraction and concentration factors up to 100 times, were achieved.(7-9)
Ionic liquids are commonly defined as organic salts composed entirely of ions, in contrast to common electrolytes, with melting temperatures lower than 373 K (100 °C). They were originally suggested as alternative solvents for the replacement of volatile organic compounds (VOC) currently used in industrial processes. In addition, the tenability of the IL physicochemical properties, resulting from a proper combination of their ions, allows the preparation of specific solvents for separation and purification processes.(10) This means that all properties can be tuned by varying the structure of the component ions to obtain desired characteristics, e.g. polarity, density, viscosity, hydrophobicity, hydrogen-bonding capability, thermal stability or toxicity. This aspect is indeed a major benefit of ionic-liquid-based ABS, given the difficulty of overcoming the limited polarity range of polymer-based ABS as defined previously.
The interest in the applications of these fluids has led to the development of an extensive range of IL ions, and to the exploitation of applications, including the use as electrolytes, lubricants, biphasic chemical processes, or biomass processing.(11)
Figure 1.1 – Some commonly used cations and anions in ionic liquids.
Why are ionic liquids being used for “greener chemistry”? A handful of properties characterizes these solvents, such as:
No vapour pressure: low volatility and low flammability;
Thermal and chemical stability;
Liquid over large range of temperature;
Electric conductivity;
Tuneable solvating properties: density, viscosity, hydrophobicity, toxicity;
Easy to buy and simple to prepare.
Ionic liquid’s chemical diversity offers unique opportunities to develop solvents for specific purposes by modifying the structures of both cation and/or anion. In extraction and bio-purification processes, their most important property in terms of clean chemistry is the negligible vapour pressure of these fluids and their low toxicity by design, since these processes are all carried out at low temperatures. Moreover, despite from the fact that the early ILs generations were expensive and somewhat toxic, ILs can also be designed from affordable materials, providing ILs that are easy to handle, less toxic and cheaper than the more commonly studied ILs.
Considering the potential application of ABS for the extraction of added-value compounds and their mandatory biocompatibility and biodegradability issues, a new class of ABS composed of cholinium-based cations ([Ch]+) ILs and K
3PO4 (as the inorganic salt) was recently proposed as a valuable alternative.(8) The cholinium-based ILs/salts are constituted by the 2-hydroxyethyl-N,N,N-trimethylammonium cation combined with anions as diverse as chloride, bicarbonate, acetate, succinate, malate, among others. While the cation has a deciding role in the toxicity of the IL, both cation and anion play an essential role in the ionic liquid’s physicochemical properties, and it is known that the anion also to contribute to the overall toxicity, but its effect is usually neglected. The ABS formation is controlled by the interplay of the relative strengths of the solute (ions from the ionic liquid), the salting agent (ions from the inorganic salt) and the solvent (water), with a significant contribution from hydration phenomena and thus specific hydrogen-bonding between the IL and inorganic salt.
Figure 1.2 – Chemical structures, respective name and acronyms of all ILs investigated.
The possibility of forming polymer-IL-based ABS was also reported (10, 13, 14), although it seems to be by far more complex. For example, for polyethylene glycol (PEG), the molecular phenomenon which governs the formation of an immiscible is intricate with similar contributions from IL-water, PEG-water and PEG-IL. Nevertheless, the use of polyethylene glycol is frequent because it presents high biodegradability, low toxicity, low volatility, low melting temperature, large water miscibility and low cost.
1.3.1 Salting effects in Ionic Liquid aqueous solutions
When a high charge density salt such as tripotassium phosphate (K3PO4) is dissolved in an aqueous solution, the isolated ions are surrounded by a layer of water molecules, a phenomenon known as ionic hydration.(15) Those water molecules are immobilized and their role as solvents to other molecules or ions is reduced. When an inorganic salt such as potassium phosphate tribasic is added to a solution of a hydrophilic ionic liquid, they compete with each other for the solvent molecules. The competition is “won” by the inorganic ions (with a stronger affinity for the solvent), conversely, those of the ionic liquid “lose”. There is a migration of solvent molecules away from the ions of the ionic liquid to those of the inorganic salt, which, in turn, decreases the hydration and hence the solubility of the ions of the ionic liquid. As a consequence, a phase-rich in ionic liquid separates from the rest of the solution. This means that the salting-out effect must be directly correlated to the hydration strength of the different ions of the inorganic salt.
During the partition of biomolecules there are several competing interactions between the IL, the inorganic salt, the biomolecules and the water. Hydrogen–bonding, π –π interactions, dispersive interactions, as well as electrostatic interactions between different compounds (complexations interactions), are some examples of these interactions to be taken into account in the partitioning coefficients.
To better understand the mechanism of the formation of aqueous biphasic systems, it is important to know the salting effects occurring during the phase separation of an ABS. A salting effect can be defined as the process by which the solubility of a solute in a given solution is changed when a salting agent is added to that solution.
If the solubility of the solute is decreased when the salting agent is added, which can lead to the solute precipitation (separation from the solution), the process is called a salting-out effect. Conversely, a salting-in effect occurs when the solubility of the solute increases upon addition of the salting agent. Traditionally, salting effects have been studied in aqueous solutions in which the solutes are non-electrolytes or low-solubility electrolytes and the salting agents are strong electrolytes, namely soluble inorganic salts with high solubility in water.
Since ionic liquids are composed exclusively of anions and cations (although some non-charged aggregates can also be found), they can be used either as salting agents, in the presence of a non-electrolyte solute, or as solutes in the presence of an inorganic electrolyte. Meanwhile, IL are liquid at room temperature and consequently they do not precipitate when “salted-out” from the aqueous solution by a strong salting agent; on the contrary, they form a second liquid phase in equilibrium with the initial aqueous solutions: they promote the formation of aqueous biphasic systems. Thus, when using an inorganic salt, such as K3PO4, as salting-out inducing agents, the ionic liquid behaves as a solute.
1.3.2 Applications of ionic liquid-based ABS: extraction of biomolecules and
added-value compounds
The key elements of ILs are organic cations, which determine their chemical stability. They are produced by alkylation of, for example, amines, imidazoles, pyridines or phosphines. Among them, ammonium and imidazolium salts are especially stable. By varying the inorganic anions, the physical properties of the IL can be optimized specifically. Therefore, ILs are sometimes called “designer solvents”, as they can be custom designed to fit different requirements.
This opens up a wide range of possible applications in which ionic liquids can be used, for example:
As reaction media in chemical processes;
As process chemicals for separation processes;
As liquid–liquid extraction or distillation;
As cleaning agents;
As process chemicals in metal treatment and cleaning;
As electrolytes in batteries or capacitors.
Although many of these applications are still in the stage of basic research, a few ILs have already been exploited in the chemical industry.(17)
Some ILs are suitable for conventional liquid–liquid water-based extractions because of their immiscibility with water, which allows the formation of two immiscible phases, as well as the partition of a vast solutes in aqueous solutions of ILs. However, the implementation of extraction processes based on hydrophobic ionic liquids on a large scale will be limited due to monetary and environmental costs, since these types of ionic liquids usually contain expensive and non-stable anions. Given this limitation, the potential to apply hydrophilic ionic liquids in separation schemes is much greater due to the availability of ‘‘greener’’ anions and less expensive materials. One way to achieving a separation process using hydrophilic ILs is through the combined use of a salting out agent, such a salt, a polymer, an aminoacid, a sugar. The design of safe and environmentally benign separation processes plays an increasingly important role in the development of extraction technology.(18)
Two main applications were found in the literature for ionic-liquid-based ABS and will be presented in this thesis: the recovery of ionic liquids from aqueous media; and the extraction of a wide range of biomolecules, from alcohols, through pharmaceuticals and proteins, and up to phenolic acids.(4)
and recovering ionic liquids from aqueous media, has been recently approached.(19) Indeed, aluminium-based salts are actually widely used as coagulants in drinking water treatment processes.
The use of inorganic salts as salting-out agents, which usually contain highly charged anions (mostly phosphate, hydroxide, and carbonate), can cause environmental risks due to the high concentrations of salt required. Consequently, the introduction of these types of ions complicates the recycling of the ionic liquids. However, as an alternative, carbohydrates can be introduced and thus develop sustainable IL-based ABS, since they are charged, biodegradable, non-toxic and a renewable feedstock.
The ability to control the aqueous miscibility of hydrophilic ionic liquids by implementing salting-out phenomenon to induce phase separation is of particular importance for the recovery of this type of ionic liquids from aqueous solutions, hence overcoming wastewater contamination issues and promoting the industrial application of the novel solvents.
Extractions of added-value compounds have been studied in a vast range of literature and are divided by four main classes of solutes: alkaloids, pharmaceuticals, amino acids and proteins.(20) Freire and co-workers(21) showed that the complete extraction of alkaloids, such as caffeines and nicotine, is possible and achieved in a single-step procedure by a proper tailoring of the ionic liquid employed in the ABS formulation. The results showed that complete extraction of each alakaloid is attained at a partition coefficient greater than 120. Amino acids are a class of useful bio-products which are Ionic-liquid-based ABS have been successfully applied to the extraction of amino acids.(7, 22)
1.4 Phenolic Acids
Phenolic acids are aromatic secondary plant metabolites, with more than 8 000 structures known, widely spread throughout the plant kingdom. There is an interest in phenolic acids because of their biological roles as secondary metabolites and their function in food quality and they are partially responsible for the organoleptic properties of plant foods. Recent interest in phenolic acids stems from their potential protective role, through ingestion of fruits and vegetables, against oxidative damage diseases (coronary heart disease, stroke and cancers).(23) They are widespread constituents of plant foods (fruits, vegetables, cereals, olive, legumes, chocolate, etc.) and beverages (tea, coffee, beer, wine…).(24)
Phenolic acids can also be raw materials for the synthesis of different molecules with industrial interest, such as nutraceuticals, cosmetics, antioxidants, and flavours; they also can be used in the preparation of resins, plasticizers, dyes and pharmaceutical products.(25)
The term phenolic acid, in general, designates phenols that possess one carboxylic acid functionality. These naturally occurring phenolic acids contain two distinctive carbon frameworks: the hydroxycinnamic and hydroxybenzoic structures, depicted in Table 1.1. Although the basic skeleton remains the same, the numbers and position of the hydroxyl groups on the aromatic ring make the difference and establish variety.(26)
Table 1.1 – Structures of some prominent naturally occurring phenolic acids.
Hydroxybenzoic Acids Hydroxycinnamic Acids
Name R1 R2 R3 R4 Name R1 R2 R3 R4
Benzoic acid H H H H Cinnamic acid H H H H
p-Hydroxybenzoic acid
H H O
H H o-Coumaric acid OH H H H Vanillic acid H OCH
3 O
H H m-Coumaric acid H OH H H Gallic acid H OH O
H OH p-Coumaric acid H H OH H Protocatechuic
acid H OH
O
Hydroxycinnamic acids and their derivatives are almost exclusively derived from p-coumaric acid, caffeic acid, and ferulic acid whereas sinapic acid is, in general, less encountered. Caffeic acid and its esterified derivatives are the most abundant hydroxycinnamic acids in a variety of fruits and vegetables. Ferulic acid and its derivatives are the most abundant hydroxycinnamic acids found in cereal grain. On the other hand, tea can be an important source of gallic acid which is a hydroxybenzoic acid. Despite all this diversity in plants, only a minor fraction exists in the free acid form. This variety is one of the factors contributing to the complexity of the analysis of phenolic acids.
The phenolic acids studied in this work are three particular phytochemical compounds, they are: cinnamic acid, p-coumaric acid and caffeic acid. These phenolic acids were chosen because of their important role in the diet of humans.
Figure 1.3 – Chemical structures of the phenolic acids investigated.
Cinnamic acid (3-phenyl-2-propenoic acid) has a particular place in plant metabolism. The progenitor of the name is the spice cinnamon, known and used by humans for at least 4000 years. Generally present in trace quantities, this compound may be the major constituents of certain natural oils and resins, namely oils of basil and cinnamon.(27, 28) Cinnamic acid is also used in flavours and certain pharmaceuticals.
p-Coumaric acid (3-(4-hydroxyphenyl)-2-propenoic acid) is another phenolic acid of great interest due to its chemoprotectant and anti-oxidant properties. This hydroxycinnamic acid related to cinnamic acid is a phenolic phytochemical found in plants.(29)
studies suggested that caffeic acid exerts anticarcinogenic effects.(31) It is found in all plants because it is a key intermediate in the biosynthesis of lignin, one of the principal components of plant biomass and its residues.(32) Their chemical structures are shown in Figure 1.3.
The extraction of bioactive compounds from plant materials is the first step in the utilization of phytochemicals in the preparation of dietary supplements or nutraceuticals, food ingredients, pharmaceutical, and cosmetic products. Phenolics can be extracted from fresh, frozen or dried plant samples. The selection of the detection method is influenced by their chemical nature, the extraction method employed, sample particle size, as well as the presence of interfering substances.
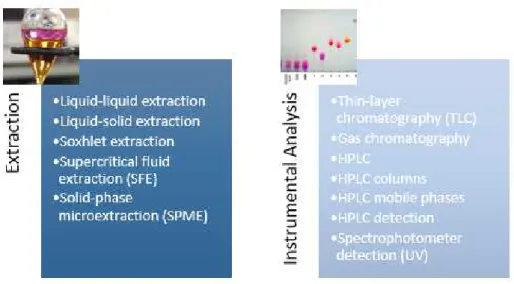
Schematic of strategies for the determination of phenolic acids in biological fluids, beverages, plants, and food is shown in Figure 1.4.(23, 24, 26)
Figure 1.4 – Extraction techniques and instrumental quantification analysis for phenolic acids.
Liquid-liquid and solid-liquid extraction are the most commonly used procedures to extract phenolics from natural plant matrixes. This is due to their ease of use, efficiency, and wide-ranging applicability. Solvent extractions most commonly used are alcohols (methanol, ethanol), acetone, diethyl ether, and ethyl acetate. Other conventional extraction methods such as soxhlet extraction have shown low efficiency and potential environmental pollution due to large volumes of organic solvent used and long extraction time required in those methods. Also, they cannot be easily scaled-up.
In the last twenty years, HPLC has been the analytical technique that has dominated the separation and characterisation of phenolic compounds. HPLC techniques offer a unique chance to separate simultaneously all analysed components together with their possible derivatives products. In many cases, they allow the determination of low concentrations of analytes in the presence of many other interfering components.
1.5 Objectives
In this work, the efficiency of aqueous biphasic systems in the extraction of three phenolic acids, caffeic, cinnamic and p-coumaric, from aqueous solutions was evaluated. For that purpose, the newly proposed ABS containing cholinium-based ILs were used.(8) The use of nontoxic ILs represents a further step towards the implementation of greener processes. One imidazolium-based Ils was also used in order to verify possible effects arising from the aromaticity of these IL family. Two different salting out agents were tested: K3PO4 and PEG-600. The choice of K3PO4 was due to its high salting out capacity. However, it should be kept in mind that this salt presents severe pH experimental conditions (pH around 12). PEG-600 was also used in the extraction was chosen since it provides milder extraction conditions.
For the quantification of the phenolic acids, the analytical method chosen here was the UV/vis spectrophotometry due to its simplicity and easy analysis. The quantification of the acids was always performed in both phases. A mass balance analysis was carried out in order to evaluate/detect any possible loss of compounds arising from the separation of the phases in equilibrium.
All the extractions were carried out at room temperature and atmospheric pressure. The effect of the concentration of the biomolecules in the extraction efficiency was also evaluated.
2.1 Chemicals and equipment
Two different types of ABS were used in this work for the extraction of the three phenolic acids: K3PO4 and PEG containing systems. The ionic liquids used were 1-butyl-3-methylimidazolium chloride ([C4mim]Cl]; >98.0 wt. % pure), provided by Iolitec, cholinium chloride ([Ch]Cl; ≥ 98.0 wt. % pure), provided by Sigma-Aldrich, cholinium acetate ([Ch][Ac]), cholinium succinate, ([Ch][Suc]), cholinium glutarate, ([Ch][Glu]) and cholinium levulinate, ([Ch][Lev]). All the cholinium-based ILs, with the exception of cholinium chloride, were synthesized in the laboratory. In order to reduce the water content, the ILs were dried under constant stirring, at moderate temperature around (318.15 K) and high vacuum conditions (0.01 mbar) for a time minimum of 24h. Their purities were additionally determined by 1H and 13C NMR spectrums and are provided in Appendix E. The IL’s chemical structures are shown in Figure 1.2. A brief explanation of the synthesis of the ionic liquids is presented in Appendix C.
Potassium phosphate tribasic salt (K3PO4) and poly(ethylene glycol), with an average molecular
weight of 600 g∙mol-1 (PEG 600) were purchased at Sigma-Aldrich and used as received.
The water content of all the ILs and the polyethylene glycol was measured with the Karl-Fisher Coulometer’s equipment (831 KF Coulometer Metrohm) and was taken into account before the preparation of the ampoules. In general, the water content of IL samples after the drying procedure was found to be higher than 10.000 ppm, whereas the water content of PEG was lower than 3000 ppm (1 437.700 – 2 510.837 ppm). The typical water content data obtained for used ILs is depicted in Table 2.1.
Table 2.1 – Typical water content data obtained for all the ILs studied in this work.
Ionic Liquid Water content / ppm Water content / wt%
[C4mim]Cl 2 001.42 0.200
[Ch]Cl 10 192.59 1.019
[Ch][Ac] 34 036.68 3.404
[Ch][Suc] 10 094.03 1.009
[Ch][Glu] 45 627.06 4.563
[Ch][Lev] 52 410.47 5.241
The phenolic acids used as partitioning solutes were cinnamic acid (CAS 140-10-3) ≥ 99.0% pure, p-coumaric acid (CAS 501-98-4) 98.0% pure and caffeic acid (CAS 331-39-5) with a mass percentage purity higher than 98.0%, supplied respectively by Fluka, Alfa Aesar and Sigma-Aldrich. These three acids are solid at room temperature.
Double distilled water, passed through a reverse osmosis system and further treated with a Milli-Q plus 185 water purification equipment, was used in all experiments.
[Ch]Cl, [Ch][Suc] and [Ch][Glu], based on previous work,(33) are depicted on Figure 2.1. The water activity of the choline [Ch][Ac] was measured using a Rotronic HygroPalm AW1. Since cholinium levulinate was not available in the laboratory, it was impossible to measure the water activity for this ionic liquid. Aqueous solutions of each ionic liquid were prepared and their water contents were determined by Karl Fisher Titration (831 KF Coulometer, Metrohm). Then, the prepared solutions were placed in a sealed container connected to a probe. Each sample slowly exchanges moisture with the air inside the sealed container until the equilibrium was reached. The water activity values were considered constant when values were achieved in the thermo hygrometer. The measurements were performed under controlled temperature (25 ± 0.01 ºC) with an accuracy of ± 0.005 aw. The experimental water activity are also presented in Figure 2.1.
Figure 2.1 – Water activities at room temperature of cholinium-based ABSs: ( ) [Ch]Cl; (
×
) [Ch][Ac]; ( ) [Ch][Suc]; (◊
) [Ch][Glu].Since the water activity describes the energy of water in a given system, the higher the depression of the water activity, the more stable the hydration complexes are, and thus, the stronger the interactions between water and the solute. Hence, the hydrophilicity follow the order: [Ch][Ac] > [Ch]Cl > [Ch][Suc] ≈ [Ch][Glu].
0.65 0.70 0.75 0.80 0.85 0.90 0.95 1.00 1.05
0.00 1.00 2.00 3.00 4.00 5.00 6.00 7.00 8.00 9.00 10.00
W ate r A cti vi ty
Ionic Liquid [mol/Kg]
2.2 Methods
2.2.1 Physicochemical properties of IL-based ABS
The physical properties of ABS, such as pH, viscosity and density are important properties to use these systems as extractive approaches in biotechnological applications, and particularly, when envisaging their design and scale-up. Viscosity is a property with a great importance since it provides information on mass transfers in ionic liquids. Therefore, pH, density and viscosity values were measured on both of the top and bottom phases for all initial mixtures prepared.
Density and viscosity data of the coexisting phases in ABS composed of used cholinium-based ILs + K3PO4 + H2O previously measured in literature(8) were used in this work for comparison. However, for the [C4mim]Cl-based ABS and the cholinium-based ILs + PEG 600 + H2O, the density and viscosity of both the top and bottom phases were measured in this work. The mixtures at specific compositions were prepared, vigorously shaken to reach equilibrium and allowed to phase separate for at least 12h, at room temperature. After the separation of the immiscible phases, viscosity and density measurements were performed for both IL-rich and salting-agent-rich phases aqueous phases between 293.15 K and 303.15 K.
The pH values of both the ionic-liquid-rich and salt-rich phases were measured at room temperature using a FE20 –FiveEasy™ pH meter from METTLER TOLEDO. The pH meter was calibrated with two buffer (pH values of 4.00 and 7.00). After vigorous stirring and a subsequent period of settling (at least 12h), the separation was carried out, and the pH values of the two separate phases was measured. The pH values of the mixtures prepared with aqueous solutions of phenolic acids and the inorganic salt were also measured.
2.2.2 Partitioning coefficients and extraction efficiencies
Mixtures of each IL, salting-agent and the aqueous solution of each one of the acids were prepared according to the compositions of the ternary mixtures used for the phenolic acids based on the phase diagrams determined in previous works.(3, 8). These compositions were chosen based on tie-line data obtained from the literature. The longer the tie-line, the larger the difference in composition between the two co-existing phases and thus the more efficient the extraction should be. An effort was made to use mixtures with initial compositions that are very similar to each other so that a fair comparison could be carried out. Note, however, that due to the different shape of the phase diagrams, some differences especially in the salt concentration could not be avoided.
The concentration of each one of the acids in the aqueous solution used in the initial mixture was 0.147 g∙dm-3 (9.95 × 10⁻⁴mol∙dm-3) for cinnamic acid; 0.800 g∙dm-3 (4.87 × 10⁻³mol∙dm-3) for p-coumaric acid and 0.672 g∙dm-3 (3.73 × 10⁻³mol∙dm-3) for caffeic acid. The ampoules were let to equilibrate for at least 12 h to achieve a complete separation of the two phases formed. After the phase separation, the presence of each phenolic acid in each one of the phases was measured by UV-vis absorbance spectroscopy using a UV-vis spectrophotometer, SHIMADZU UV-1700, at the corresponding maximum absorption wavelengths. To better account for possible interferences, ampoules with the same mass fraction composition were prepared for each individual system, using pure water (Milli-Q) instead of the phenolic acids aqueous solutions, to be used as blank samples. The calibration curves further established and listed in Table 3.3 were used to quantify the acid in both phases. The effects of the inorganic salt were also taken into account for p-coumaric and caffeic acids.
The mixtures were prepared and vigorously stirred in small ampoules of approximately 15 cm-3. After stirring, the biphasic systems were allowed to equilibrate and to phase separate for at least 12h, at room temperature. After the separation of the phases, the concentration of phenolic acids was quantified through UV-vis, using the calibration curves previously established.
Figure 2.2 – (a) Experimental set up used for the determination of the partition coefficients and extraction efficiencies of phenolic acids and (b) macroscopic appearance of an ABS composed of an ionic liquid
(used in this work) and an inorganic salt (K3PO4).
At the conditions used in this work, the top layer is the IL-rich phase while the bottom phase is the inorganic-salt-rich phase. As mentioned in the introduction, the addition of inorganic salt leads to the salting-out (exclusion) of the ionic liquid creating another aqueous phase. Figure 2.2 (b) shows the phase splitting process observed in the IL-based ABS used in this work. A flow sheet of the extraction procedure (valid for both K3PO4- and PEG-600-based system) is depicted in the next figure.
The partition coefficients of the studied biomolecules, KCIN for cinnamic acid, KCOU for p-coumaric acid and KCAF for caffeic acid are defined as the ratio of the concentration of the biomolecules in the IL and in the salting-agent-aqueous-rich phases, as described by the following equation:
𝐾𝑎𝑐𝑖𝑑 =[𝐴𝐶𝐼𝐷][𝐴𝐶𝐼𝐷]𝐼𝐿 𝑠𝑎𝑙𝑡𝑖𝑛𝑔 𝑎𝑔𝑒𝑛𝑡
(1)
where [ACID]IL and [ACID]salting agent, are respectively, the concentration of the acid in IL and in salting-agent-aqueous-rich phases. The salting agent may be either the inorganic salt (K3PO4) or the polyethylene glycol (PEG 600).
The extraction efficiencies of each biomolecule, EECIN% for cinnamic acid, EECOU% for p-coumaric acid and EECAF% for caffeic acid, are defined as the percentage ratio between the amount of each phenolic acid in the IL-rich phase and in the initial mixture, according to Equation (2),
𝐸𝐸𝑎𝑐𝑖𝑑% = 𝑤𝑎𝑐𝑖𝑑 𝐼𝐿
𝑤𝑎𝑐𝑖𝑑𝐼𝐿 + 𝑤𝑎𝑐𝑖𝑑𝑠𝑎𝑙𝑡𝑖𝑛𝑔 𝑎𝑔𝑒𝑛𝑡
× 100 (2)
where 𝑤𝑎𝑐𝑖𝑑𝐼𝐿 and 𝑤𝑎𝑐𝑖𝑑𝑠𝑎𝑙𝑡𝑖𝑛𝑔 𝑎𝑔𝑒𝑛𝑡 are the weight of phenolic acid in the IL-rich and in the salting-agent-rich aqueous phases, respectively.
Note that after the phase separation and recovery of the two phases, both IL and salting-agent-rich phases were additionally weighted and density values of each IL and salting-agent were used to convert the mass values obtained to volume values, since it is aqueous solutions.
The validation of the quantification of phenolic acids was made for all the systems studied through a method denominated mass balance. The material balance is an application of conservation of mass to the analysis of physical systems. By accounting for compounds entering and leaving from the ampoule, the lost mass can be identified, which might have been unknown or difficult to measure during the extraction.
3.1 Cinnamic, p-Coumaric and Caffeic Acids
As stated in the Introduction chapter, phenolic acids are widely present in plants and vegetable foods and also exert some biological activities, such as antioxidative and free-radical scavenging. There are many analytical methods for quantitative study of these acids, such as HPLC or thin-layer chromatography (TLC) among others. However, due to its simplicity, the most commonly used method is the UV-vis spectroscopy. Phenolic compounds display characteristic UV spectra which are useful for detection and quantification. Spectroscopic techniques offer a rapid and non-destructive approach to determine concentration changes in solution. This method is going to be adopted in this work, where the main objective is to study the extraction performance of ionic liquid-based aqueous biphasic systems of three phenolic acids: cinnamic acid (CIN), p-coumaric acid (COU) and caffeic acid (CAF) from aqueous solutions (see Figure 1.3 for the chemical structures).
In Table 3.1 the water solubility and the dissociation constants of cinnamic, p-coumaric and caffeic acid are presented. The dissociation constant together with the experimental pH conditions can provide useful information about the speciation of the acids, in other words, if they are in their neutral, cationic or anionic form. When in the anionic form (pH > pKa), phenolic acids can complex with other molecules by hydrogen bonds.(34) Chemical species and speciations of the phenolic acids are depicted in Figure 3.1, Figure 3.2 and Figure 3.3.(35)
Table 3.1 – Solubility in water (SW) and dissociation constants of phenolic acids at 298.2 K (35-37).
Phenolic Acid Solubility / g∙dm-3 pKa
1 pKa2 pKa3
Cinnamic Acid 0.23 4.51 - -
p-Coumaric Acid 1.02 4.00 9.52 -
Caffeic Acid 0.98 3.64 9.52 12.45
Figure 3.2 – Chemical species and speciation of p-coumaric acid.
Figure 3.3 – Chemical species and speciation of caffeic acid. 0
20 40 60 80 100
0 2 4 6 8 10 12 14
C
o
n
ce
n
tr
ati
o
n
/
%
pH
Neutral Specie Negatively Charged Specie I Negatively Charged Specie II
(I) (II) (III) (IV)
The interest in investigating these three phenolic acids is that they have identical chemical structures, the only difference is the number of hydroxyl groups (-OH) attached to the benzene ring. p-Coumaric acid has one hydroxyl group in para-substitution, occupying the opposite ends (the carboxylic group) while caffeic acid possess two hydroxyl groups in meta- and para-substitution and thus forming a catechol group (C6H4(OH)2). This is the reason why these two phenolic acids complex with other molecules, namely with ions (34). The hetero-association of the phenolic acids is a very frequent and important phenomenon due to hydrogen bonding interactions of hydroxyl groups attached to the catechol group. These hydroxyl groups are more unprotected because of the high charge of the phenol group whereas the OH- group of the carboxylic group is protected by the resonance structure. Cinnamic acid does not have any hydroxyl group attached to the catechol group, and therefore, it should not present any formation of complexes between the acid and other ions.
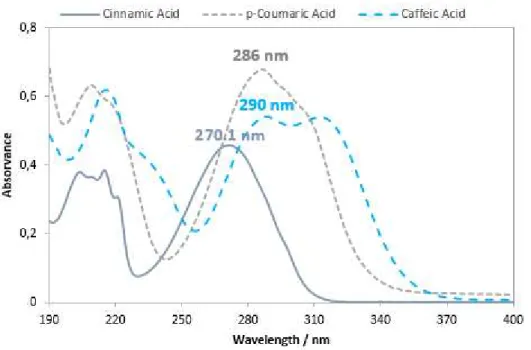
The three acids were quantified analytically by UV-vis spectrophotometer and thus the electronic absorption spectra’s were measured in the ranges of 190-400 nm. For that purpose, individual solutions with a proper concentration of the three acids were prepared. The spectra, shown in Figure 1.2, were obtained by subtracting the spectrum of pure solvent (water) from that of the solutions containing the each one of the acids.
Figure 3.4 – Spectras of cinnamic, p-coumaric and caffeic acids in water at room temperature.
Analysing the overall bands of the spectra, it can be observed that bands are large and not very detailed. This can probably attributed to the effect of water, as a solvent. Water, and other polar compounds such as ethanol, can interact through hydrogen bonding with phenolic acids.
with a maximum wavelength of 270.1 nm, which is going to be used to quantify the concentration of the acid during the extraction procedure. The spectra of p-coumaric acid in water solution also shown in Figure 3.4, is mainly characterized by double absorption band with two maximum wavelengths at 286 nm and 209 nm. The quantification of this acid will be performed using the most intense band (286 nm). Similarly to what happens to p-coumaric acid, caffeic acid also exhibits a double band with maximum absorption intensities at 290 and 312 nm.
These bands at wavelengths of 270-290 nm correspond to the benzene ring since benzene absorbs at 255 nm. An hydroxyl group (-OH) affects the spectra of benzene forming peaks at longer wavelengths. This absorption shift to longer wavelength is called a bathochromic shift. Bands at lowers wavelength (210 nm) correspond to the carboxylic acid and are not very useful for analysis purposes, thus being disposed in the quantification of the phenolic acids.(38)
The functional groups influence the conjugated systems, causing the absorption peaks to appear at longer wavelengths than the band of benzene, although they do not go beyond 400 nm and enter the visible region.(39) The wavelengths of the functional group that constitute the phenolic acids are show in Table 3.2.
Table 3.2 – Wavelengths of functional group constituents of phenolic acids.
Functional Group λ / nm
Benzene 255
Phenol 270
3.2 Calibration Curves
The method used to quantify the concentration of a compound in an aqueous solution is the UV-spectroscopy method based on the propriety that many compounds absorb in the ultraviolet (UV) and visible (vis) light. The Lambert-Beer law, establishes a linear relationship between the concentration and the absorbance according Equation (3):
𝐴 = 𝜀 ∙ 𝑏 ∙ [𝐶] (3)
where A represent the absorbance, ε is the molar absorptivity (in units of L∙mol-1∙cm-1), b is the path length of the sample (cells with 1 cm of path length were used in this work) and finally, C is the concentration of the phenolic acid in solution.
In this way, a calibration curve needs to be established using solutions with varied concentrations of the phenolic acids and their respective absorbances. Aqueous solutions of each phenolic acid were prepared taking into account each one of the acids’s solubility: individual solutions with a concentration of 0.147 g∙dm-3 (9.95 × 10⁻⁴mol∙dm-3) for cinnamic acid (CIN); 0.800 g∙dm-3 (4.87 × 10⁻³mol∙dm-3) for p-coumaric acid (COU) and 0.672 g∙dm-3 (3.73 × 10⁻³mol∙dm-3) for caffeic acid (CAF) were prepared. The acid’s initial concentration was carefully chosen after carrying out some preliminary tests aimed at achieving absorbance values in an adequate range (0.3 < Abs < 1.3) so that the Lambert- Beer law holds. The solutions were then quantified through UV-spectroscopy using a SHIMADZU UV-1800, Spectrophotometer (Figure 3.5).
Figure 3.5 – SHIMADZU UV-1800 Spectrophotometer (UV/vis) used in this work.
The extraction method used in this work requires the use of an ionic liquid together with an inorganic salt, K3PO4, or a polymer, polyethylene glycol. The presence of these compounds might cause significant interferences in the spectra of the phenolic acids under study and thus in the analytical method, at the dilutions carried out.
All the spectra were obtained by subtracting the spectrum of pure solvent from that of the aqueous solution containing phenolic acid. This procedure will be followed during all UV-vis measurements carried out during this work.
In particular, the use of K3PO4 might cause a significant interference since this salt changes the pH of the solutions. This fact is most relevant when using solutes that are sensible to the pH such as the case of acids. The UV-vis spectra of each one of the phenolic acids in water and in an aqueous solution of K3PO4 (with a salt concentration corresponding to 40% of the total solution) are shown in Figure 3.6, Figure 3.7 and Figure 3.8. The concentration used of the acids for both aqueous solutions was the same. For cinnamic acid a concentration of 0.1 g∙dm-3 was used, for p-coumaric acid and caffeic acid it was used concentrations of 0.8 g∙dm-3 and 0.5 g∙dm-3 respectively.
Figure 3.6 – UV-vis spectra of cinnamic acid in water (full line) and in aqueous solution of 40% of K3PO4 (dashed line).
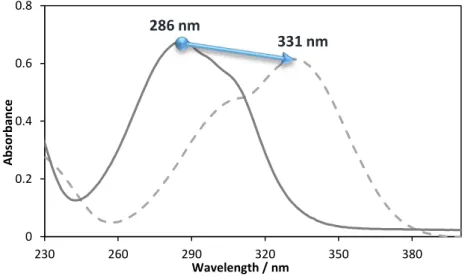
Figure 3.7 – UV-Vis spectra of p-coumaric acid in water (full line) and in an aqueous solution of 40% of K3PO4 (dashed line).
0 0.2 0.4 0.6 0.8
230 260 290 320 350 380
A b so rb an ce
Wavelength / nm
0 0.2 0.4 0.6 0.8
230 260 290 320 350 380
A b so rb an ce
Wavelength / nm
331 nm
286 nm
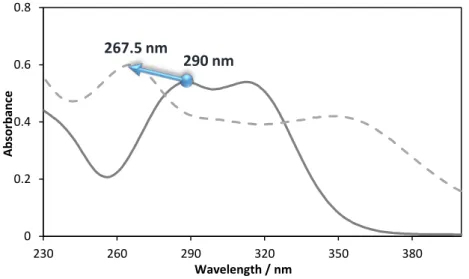
Figure 3.8 – UV-Vis spectra of caffeic acid in water (full line) and in an aqueous solution of 40% of K3PO4 (dashed line).
Information on the wavelength corresponding to the maximum absorbance of each phenolic acid in water and in an aqueous solution of K3PO4 as well as pH values of each solution gathered from these Figures is systematized in Table 3.3.
Table 3.3 – Wavelengths corresponding to the maximum absorption and respective pH in water and in an aqueous solutions of K3PO4.
Phenolic Acid Water pH K3PO4 (aq.) pH
Cinnamic Acid 270.1 3.98 270.1 13.29 p-Coumaric Acid 286 4.06 331 13.42 Caffeic Acid 290 3.73 267.5 13.44
Only cinnamic acid UV-vis absorbance spectra remains unchanged when K3PO4 is present in the solution. The other two acids, p-coumaric and caffeic acids, have their spectra greatly altered by the presence of this salt. For p-coumaric acid not only a deviation to higher wavelengths occurred (bathochromic shift to 331 nm), but also the relative intensity of the two bands changed. In other words, while in water the maximum wavelength corresponds to the first band in the group, in the K3PO4 solution the maximum absorbance was registered for the second band in the group. The caffeic acid spectra is the one that suffered larger changes, since there is a clear broadening of the band, with the two peaks moving in opposite directions: a deviation of the most intense band for lower wavelengths (hipsochromic shift to 267.5 nm) while the other band deviated to higher wavelengths.(40)
In order to further investigate the origin of the observed shifts, solutions with several pH were prepared and the spectra were registered. The study of the influence of the salt is presented forward.
According to Belay et. al. (34), solutions of caffeic acid and sodium hydroxide (NaOH) present a complexation of the Na+ cation with the caffeic acid, which coordinates at the catechol sites by
0 0.2 0.4 0.6 0.8
230 260 290 320 350 380
A b so rb an ce
Wavelength / nm
replacing the H+ in the hydroxyl group. A similar phenomenon probably happened in the present work, with the potassium cation establishing strong interactions with the oxygen in the hydroxyl group of coumaric acid and caffeic acid. This mechanism is presented in Figure 3.9 for p-coumaric acid and Figure 3.10 for caffeic acid.
Figure 3.9 – Possible mechanism of p-coumaric complexation with K3PO4.
Figure 3.10 show the possible reaction that occurs between caffeic acid and K3PO4. Since the acid has several deprotonated species at a pH above its dissociation constants, there is a larger list of possible species that can be formed after complexation with phosphate anions, including dipotassium phosphate (K2HPO42-), monopotassium phosphate (KH2PO41-), and three inorganic salts: potassium-4-(2-carboxyvinyl)-2-hydroxyphenolate, potassium-5-(2-carboxyvinyl)-2-hydroxyphenolate and finally potassium-4-(2-carboxyvinyl)-benzene-1,2-bisolate.
The presence of all these compounds in the aqueous solution justifies the higher than the expected affinity of the caffeic acid to the inorganic salt. Consequently, the extraction of caffeic acid to the ionic liquid phase will be more difficult than that of the other two acids. The Figure 3.11 illustrates the possible partitioning of caffeic acid in IL + K3PO4 systems.
Figure 3.11 – Scheme of the partitioning of caffeic acid in alkaline medium.
Figure 3.12 – Experimental UV spectra of p-coumaric acid at different compositions of K3PO4 (%wt.)and respective pH values with [COU] = 0.0133 g∙L-1, at room temperature.
Figure 3.13 – Experimental UV spectra of caffeic acid at different compositions of K3PO4 (%wt.)and
respective pH values with [CIN] = 0.0195 g∙dm-1, at room temperature.
Table 3.4 – Effect of the compositions of K3PO4 in the absorbance p-Coumaric acid and pH values, at room temperature.
Composition Absorbance CCOU/ g∙dm-3 Wavelength (nm) pH
0% K3PO4 1.35 1.17 × 10⁻² 286 7.28
5% K3PO4 1.56 3.09 × 10⁻² 331 12.87
10% K3PO4 1.55 3.05 × 10⁻² 331 12.96
20% K3PO4 1.41 2.77 × 10⁻² 331 13.20
Table 3.5 – Effect of the compositions of K3PO4 in the absorbance p-Coumaric acid and pH values, at room temperature.
Composition Absorbance CCAF/ g∙dm-3 Wavelength (nm) pH
0% K3PO4 1.36 1.86 × 10⁻² 290.0 6.44
5% K3PO4 1.03 4.26 × 10⁻² 267.5 12.56
10% K3PO4 1.03 4.28 × 10⁻² 267.5 12.81
20% K3PO4 1.12 4.66 × 10⁻² 267.5 13.02
For both acids the presence of K3PO4, even if in very small concentrations, greatly alters the spectra of both acids and the corresponding pH. When the composition of the inorganic salt is null, the pH value is lower than the dissociation constant pKa2 of the acids, suggesting that they are in their neutral form and thus are not able to form a new species. Relatively to the other compositions, with just only 5% of K3PO4 added there is an immediate change in the spectrum of both phenolic acids due to the fact that pH value is higher than pKa2.
The calibration curves for the three acids were carried out according to the information collected above:
Table 3.6 presents a brief summary of the wavelengths used for each one of the phenolic acid with both K3PO4 and water (used for PEG 600 systems) and the respective extinction and correlation coefficients used to determine the calibration curve.
Table 3.6 - Calibration curves for each phenolic acid in aqueous solutions with or without K3PO4.
Solute Cinnamic
acid p-Coumaric Acid Caffeic Acid
Wavelength (nm) Water 270.1 286 290
K3PO4 (aq.) 331 267.5
Extinction Coefficient
Water
126.03 114.58 73.01
K3PO4 (aq.) 50.89 24.11
Correlation Coefficient
Water
R2 = 0.9995 R
![Figure 3.12 – Experimental UV spectra of p-coumaric acid at different compositions of K 3 PO 4 (%wt.) and respective pH valu es with [COU] = 0.0133 g∙L -1 , at room temperature](https://thumb-eu.123doks.com/thumbv2/123dok_br/16480805.732407/63.892.209.680.104.422/figure-experimental-spectra-coumaric-different-compositions-respective-temperature.webp)