Maria Sofia Castro Henriques de Castro Fraga
Mestre em Engenharia Química e Bioquímica
C
HARACTERISATION OF TRANSIENT
TRANSPORT IN DENSE MEMBRANES USING
ON
-
LINE MASS SPECTROMETRY
Dissertação para obtenção do Grau de Doutor em Engenharia Química e Bioquímica – Especialidade em
Engenharia Química
Orientadora: Doutora Carla Maria Carvalho Gil Brazinha
de Barros Ferreira
Investigadora de Pós-Dourotamento
FCT-UNL
Co-orientador: João Paulo Serejo Goulão Crespo
Professor Catedrático
FCT-UNL
Júri:
Presidente: Prof. Doutora Maria da Ascensão Carvalho Fernandes Miranda Reis
Arguentes: Prof. Doutor Adélio Miguel Magalhães Mendes Prof. Doutor Thomas Schäffer
Vogais: Prof. Doutora Isabel Maria Rôla Coelhoso
Doutora Carla Maria Carvalho Gil Brazinha de Barros Ferreira
Characterisation of Transient Transport In Dense Membranes Using On-line Mass Spectrometry
A
CKNOWLEDGEMENTS
Ao finalizar esta etapa tão importante na minha vida queria, antes de mais, agradecer aos meus orientadores, a Dra Carla Brazinha e o Professor Doutor João Paulo Crespo, não só por me terem proposto o presente trabalho de inegável interesse científico, como também por tudo o que fizeram para que o conseguisse levar a bom termo. Agradeço o interesse que sempre demonstraram no meu trabalho, como também pelas oportunidades que me foram dadas através da participação em colaborações científicas nacionais e internacionais que, foram, sem dúvida, uma mais-valia para a minha vida profissional e pessoal.
À Carla queria agradecer, de forma especial, por todo o apoio e acompanhamento, não só científico como também humano, ao longo destes anos permitindo-me ultrapassar todas as dificuldades. Gostava de agradecer também toda a disponibilidade, a exigência e rigor assim como a amizade sempre demonstrada. Ao Professor João agradeço a competência, a criatividade científica, clareza de raciocínio e todo o apoio dado para que, apesar das dificuldades, não caísse em desânimo, fazendo de tudo para que o trabalho fosse sempre do meu agrado. Obrigada por, através do exemplo de perfeccionismo, me ensinar a querer fazer sempre mais e melhor. Aos meus dois orientadores um grande grande obrigada!
À D. Maria José e à D. Palminha, muito obrigada por me receberem sempre com um sorriso e por tratarem de toda a parte administrativa.
Ao Professor Luis Trabucho, muito obrigada por todos os ensinamentos matemáticos e pela colaboração na elaboração de um artigo científico no qual, através dos conhecimentos em matemática, foi possível a elaboração de um modelo matemático de elevado interesse científico. Obrigada por toda a simpatia e por nos receber sempre tão bem.
À Anna Kujawska e ao Professor Wojciech Kujawski gostaria de agradecer a colaboração no estudo de membranas de PDMS, através do qual foi possível, não só um maior conhecimento deste tipo de membranas, como também a publicação de um artigo científico.
Ao Dr. John Jansen, muito obrigada pela possibilidade de ampliar os conhecimentos em relação ao time-lag, por todo o perfeccionismo e exigência que nos fizeram publicar um artigo de enorme
interesse científico e rigor. Agradeço também por me ter recebido no seu grupo no ITM, e por toda a hospitalidade durante os dias que lá passei.
Muito obrigada aos restantes colegas do grupo em especial, a Carla Martins, Usman, Rita Ferreira, Claudia Galinha por toda a disponibilidade sempre demonstrada para me ajudar, por partilharem comigo conhecimentos e por toda a boa disposição
Agradeço também à Fundação para a Ciência e Tecnologia a concessão da minha bolsa (SFRH/BD/81814/2011) que me permitiu desenvolver o meu trabalho.
Um enorme e especial obrigada à minha irmã Carmo e á minha amiga Inês, por este caminho que percorremos juntas, por terem servido de suporte nas alturas em que era preciso e por terem estado sempre presentes em todas as etapas, não só do doutoramento, como também da minha vida.
Muito obrigada à minha família, pais irmãos, tios e avó, pelo interesse que sempre demonstraram no meu trabalho, pela motivação que me deram e por estarem sempre presentes na minha vida. À minha mãe um obrigada especial por todo o suporte, principalmente pelas vezes que ficou com os meus filhos para que eu pudesse investir no meu doutoramento, muito obrigada!
A
BSTRACT
The work presented in this thesis aims at developing a new method for characterising the multi-component solute transport through dense membranes, both in the transient and in the steady state of gas separation and pervaporation systems, using a Mass Spectrometer (MS) as an on-line, real-time, monitoring tool.
The study of the transient period of mass transport through a membrane, although more complex than the steady-state period, has attracted the attention of researchers because it may offer a route for a better understanding of the membrane material under study and how it interacts with the permeating species. In fact, noticeable structural membrane adjustments may occur during the transient period, from when the solute starts permeating, impacting directly on the membrane intrinsic transport properties in a structure-transport relationship. The greater the affinity of the solute to the membrane, the greater the modification it may cause in the membrane matrix and, consequently, the greater the impact on the transport properties. Therefore, estimation of diffusion coefficients during the time-course of the whole permeation process is critical.
The goal of the work developed in this PhD thesis was to study the transport properties of different multi-component feed streams through different polymeric membrane materials and different
permeation systems. This work includes a study ranging from “non-interacting” solutes, such as
inert gases, to more complex systems where the solutes have strong affinity to the permeated material, such aroma compounds or water vapour. The transient behaviour of the selected membranes was followed when exposed to penetrating solvents and solutes through the on-line monitoring of the permeating species using mass spectrometry, which offers the possibility to acquire one data point per second.
The transport properties (sorption and diffusion coefficients) were assessed for mixed gas permeation systems through the development of a novel time lag measurement, where both parameters can be determined in a single step. In this system, solute-membrane interactions are not relevant and a constant diffusion coefficient can be considered during the whole permeation process, because the membrane structure is not significantly altered when in contact with these gases.
R
ESUMO
O trabalho apresentado nesta tese tem como objetivo desenvolver um novo método para caracterizar o transporte de soluto, constituído por múltiplos componentes, através de membranas densas, quer no estado transiente como no estado estacionário, para sistemas de separação de gases e pervaporação, usando um Espectrómetro de Massa (MS) como ferramenta de monitorização do permeado, on-line e em tempo real.
O estudo do transporte de massa no estado transiente através de uma membrana, embora mais complexo do que no estado estacionário, tem sido alvo de estudo por muitos investigadores uma vez que pode não só ser uma via para uma melhor compreensão do material da membrana em estudo, como também para uma melhor compreensão de como esta interage com as espécies que permeiam através dela. De facto, é durante o estado transiente que podem ocorrer ajustes a nível estrutural da membrana, desde o momento em que o soluto começa a permear, com impacto diretamente nas propriedades de transporte intrínsecas da membrana, numa relação de estrutura-transporte. Quanto maior é a afinidade do soluto para a membrana, maior a modificação que este pode causar na sua matriz e, consequentemente, maior é o impacto sobre as propriedades de transporte. A estimativa do coeficiente de difusão durante todo o processo de permeação é, desta forma, preponderante.
O objetivo do trabalho desenvolvido nesta tese de doutoramento foi o de estudar as propriedades de transporte de diferentes fluxos de alimentação multi-componentes através de diferentes membranas poliméricas em diferentes sistemas de permeação. Neste contexto, no presente trabalho foram estudados sistemas em que o soluto apresenta baixa interação com a membrana, como gases inertes, até sistemas mais complexos onde o soluto tem uma grande afinidade com o material da membrana, tal como compostos aromáticos ou vapor de água. O comportamento do estado transiente das membranas em estudo foi acompanhado on-line, desde o momento em que estas foram postas em contato com solventes e solutos, através da monitorização das espécies permeantes. Desta forma, o acompanhamento do estado transiente foi realizado usando a técnica de espectrometría de massa, uma vez que esta oferece a possibilidade de aquisição de um ponto por segundo.
As propriedades de transporte (sorção e coeficiente de difusão) foram avaliadas para sistemas de permeação de misturas gasosas, através do desenvolvimento de uma modificação do método
time-lag, através do qual os dois parâmetros podem ser determinados numa única etapa. Neste
sistema, as interações membrana-soluto não são muito acentuadas, e uma vez que a membrana não é significativamente modificada em contato com os gases, o coeficiente de difusão pode ser considerado constante para todo o regime transiente .
concentração local e, consequentemente, uma mudança na difusão ao longo do tempo. Neste contexto, através do sistema de monitorização com o MS; foi desenvolvido um método para o cálculo do coeficiente de difusão em função do tempo para sistemas não ideais, nos quais o soluto apresenta muita afinidade para a membrana. Assim, uma vez que a membrana é potencialmente modificada devido às interações membrana-soluto existentes, foram calculados os coeficientes de difusão em função do tempo dos permeantes através das diferentes membranas. Durante o transporte do soluto no estado transiente, os compostos com alta afinidade para a membrana podem solubilizar-se extensivamente dentro da matriz polimérica, causando, assim, rearranjos na membrana. Como consequência, podem ser observados periodos transientes mais longos, demorando mais tempo a atingir o estado estacionário. Por último, baseado na informação adquirida através do MS, nomeadamente a estimativa dos coeficientes de difusão em função do tempo, foi desenvolvido um modelo matemático com o objetivo de obter perfis de concentração do soluto ao longo do tempo no interior da membrana. Foram, desta forma, selecionados dois estudos de caso, correspondentes a dois diferentes sistemas, e usando dois solutos com diferentes afinidades para as membranas em questão. As propriedades de transporte das duas membranas de diferentes materiais foram comparadas: uma membrana polimérica, propensa a potenciais rearranjos do material, e uma membrana cerâmica, com uma estrutura rígida, onde os rearranjos não são previstos.
A
BBREVIATIONS
ci,bulk- concentrations of the solute i in the bulk (-)
ci,bl- concentrations of the solute i in the boundary layer (-)
ci(m)perm - concentrations of the solute i in the membrane in the permeate (-)
ciperm - concentrations of the solute i in the permeate (-)
c*
i,m - equilibrium concentration in the membrane (wt./wt.)
c*i,f - equilibrium concentration in the liquid (wt./wt.)
Di-j - diffusion coefficient of the solute in the solvent calculated using the Wilke-Chang equation
(m2 s-1)
Di– diffusion coefficient of the solute i (m2 s-1)
Di(t) - time-dependent diffusion coefficient(m2 s-1)
D(t=)– diffusion coefficient of compound i at the steady state (m2 s-1) EF (-) – enrichment factor
EtAc– ethyl acetate HxAc– hexyl acetate
Hi - Henry’s law coefficient (Pa-1)
Ii(t) - electrical signal intensity of the compound i in the instant t [A]
Ii(t=) - electrical signal intensity of the compound i at the steady state (t=) Ji,bl - flux across the
boundary layer (m-3 m-2 s-1)
Ji,m - flux across the membrane ( m-3 m-2 s-1)
Ji,ov– overall flux (m-3 m-2 s-1)
Ji - partial flux of the compound i (m-3 m-2 s-1)
JT - the total flux (m-3 m-2 s-1)
ki,bl– boundary layer mass transfer coefficient (m s-1)
ki,ov– overall mass transfer coefficient (m s-1)
ki,m - membrane mass transfer coefficient (m s-1)
zbl - boundary layer thickness (m)
L - thickness of the membrane (m) P - permeability of a solute i (m2 s-1 )
PiG - gas-phase permeability of compound i. (m2 s-1 Pa )
pifeed - partial pressure of compound i in the feed liquid
ReR– Reynolds number at the outer radius of the cell
Si - sorption coefficient of compound i(-)
SiL- liquid-phase sorption coefficient (-)
SiG - gas-phase sorption coefficient (Pa-1)
wi,permeate- permeate weight fraction
wi,feed- feed weigh fraction
αi-j - selectivity of the solute i in relation to the solvent (-)
C
ONTENTS
Acknowledgements ... v
Abstract ... vii
Resumo ... ix
Abbreviations ... xi
Contents ...xiii
List of Figures ... xix
List of Tables ... xxiii
1 Introduction ... 1
1.1 Background and Motivation ... 1
1.2 Research Strategy ... 7
1.3 Thesis Outline... 9
2 A novel time lag method for the analysis of mixed gas diffusion in polymeric membranes by on-line mass spectrometry: method development and validation... 11
2.1 Summary ... 11
2.2 Introduction ... 11
2.3 Materials and Methods ... 14
2.3.1 Materials ... 14
1.1 Gases ... 14
1.1.1 Mass flow controller calibration ... 14
2.3.2 Membrane preparation ... 15
2.3.3 Experimental set-up and operating conditions... 15
2.3.4 Mass spectrometric gas analysis ... 20
2.4.1 Time lag determination ... 21
2.4.2 Gas permeation on the fixed volume time lag system for pure gases ... 26
2.4.3 Gas permeation on the variable volume system for pure and mixed gases ... 26
2.5 Results and discussion ... 28
2.5.1 Membrane preparation ... 28
2.5.2 Pure gas permeation in the fixed volume time lag system ... 28
2.5.3 Pure and mixed gas permeation in the variable volume system using mass spectrometry ... 31
2.5.4 Comparison of the diffusion coefficients calculated from the different experimental set-ups used in this work ... 36
2.5.5 Validation experiments - Effect of the CO2 concentration on the CO2/CH4 mixed gas transport in PIM-EA(Me)-TB ... 37
2.6 Conclusions ... 39
3 Evaluation of Hybrid Polysaccharide Membranes for Gas Dehydration using On-line Mass Spectrometry ... 41
3.1 Summary ... 41
3.2 Introduction ... 41
3.2.1 Materials ... 43
3.2.2 Membrane preparation ... 43
3.2.3 Single and mixed gas permeation experiments under dry and humidified conditions ... 43
3.2.4 Calibration method ... 46
3.2.5 Calculation methods ... 46
3.3 Results and discussion ... 47
3.3.3 Permeability of gas mixtures – Flue gas and biogas dehydration ... 52
3.3.4 Membrane Stability ... 54
3.4 Conclusions ... 55
4 Steady-state and Transient Transport Studies of Gas Permeation Through Dense Membranes Using On-line Mass Spectrometry ... 57
4.1 Summary ... 57
4.2 Introduction ... 57
4.3 Materials and Methods ... 59
4.3.1 Materials ... 59
4.3.2 Experimental procedure ... 59
4.4 Results and Discussion ... 64
4.4.1 Sorption coefficients of pure O2 and pure CO2 in dense polymers ... 64
4.4.2 Steady state transport of pure O2 and pure CO2 through dense polymers ... 65
4.4.3 Transient transport of pure O2 and pure CO2 through dense polymers ... 67
4.4.4 Effect of N2 on the O2 permeation through the pectin membrane... 69
4.4.5 Effect of water vapour on gas permeation through the pectin membrane ... 71
4.5 Conclusions ... 73
5 Transport of dilute organics through dense membranes: assessing impact on membrane-solute interactions ... 75
5.1 Summary ... 75
5.2 Introduction ... 75
5.3 Theorical concepts ... 77
5.3.1 Mass transport in the feed boundary layer ... 77
5.3.2 Steady-state transport ... 79
5.4 Experimental... 81
5.4.1 PDMS membranes preparation ... 81
5.4.2 Compounds ... 82
5.4.3 Experimental set-up ... 82
5.4.4 Operating conditions ... 83
5.4.5 Sorption experiments ... 84
5.4.6 Mass spectrometry monitoring ... 84
5.5 Results and Discussion ... 84
5.5.1 Effect of feed boundary layer ... 85
5.5.2 Determination of sorption experiments... 86
5.5.3 Permeation experiments... 88
5.6 Conclusions ... 93
6 Characterisation and modelling of transient transport through dense membranes using on-line mass spectrometry ... 95
6.1 Summary ... 95
6.2 Introduction ... 95
6.3 Experimental... 98
6.3.1 Materials ... 98
6.3.2 Experimental set-up ... 98
6.3.3 Operating conditions ... 99
6.3.4 Sorption experiments ... 100
6.3.5 Mass Spectrometry monitoring ... 100
6.3.6 Off-line analysis ... 101
6.4 Results and Discussion ... 101
6.4.1 Sorption experiments ... 101
6.4.2 Characterisation of steady state transport properties ... 102
6.5 Characterisation of solute permeation by on-line mass spectrometry ... 103
6.5.1 Development of a mathematical model for solute transient transport through a dense membrane ... 106
6.6 Conclusions ... 110
7 General Conclusions And Future Work ... 113
7.1 General conclusions ... 113
7.2 Future work ... 115
Bibliography ... 117
8 Appendix – Supporting Information ... 131
A1 Description of the time-lag concept ... 131
A2 Contribution of the tubes to the instrumental time lag ... 133
A3 Least squares fitting procedure with error analysis for simultaneous calculation of the diffusion coefficient from all measurements ... 137
A4 Mixed CO2/CH4 permeation in the membrane PIM-EA(Me)-TB ... 141
A5 Mathematical model to describe the concentration inside the membrane... 143
A1.1. The analytical model ... 143
A1.2. Solution of the analytical model: Diffusion coefficient varying in the time ... 145
L
IST OF
F
IGURES
Figure 1.1: Schematic representation of Mass Spectrometry operating principle. ... 7
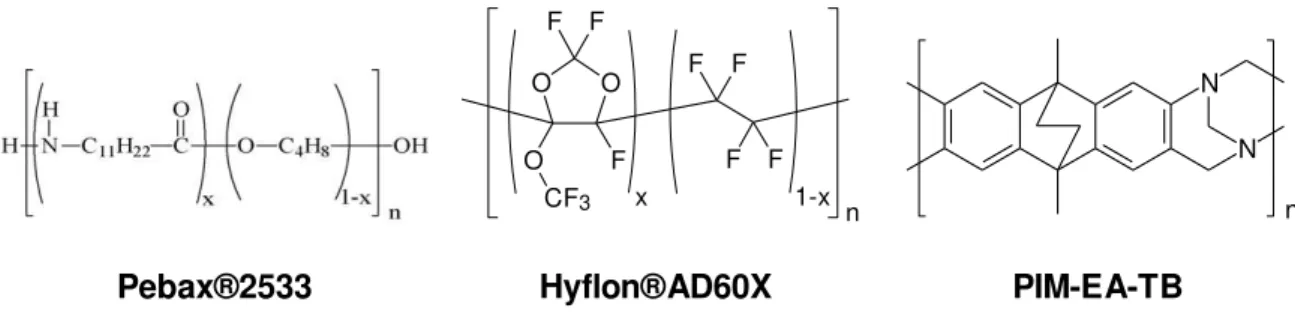
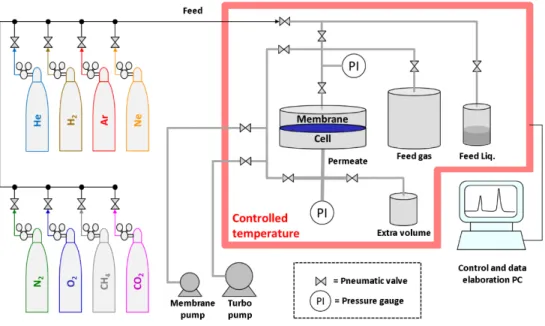
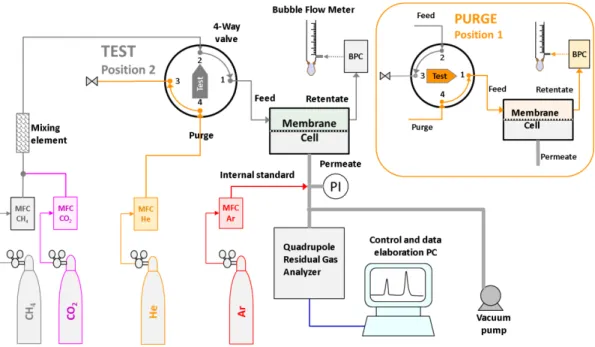
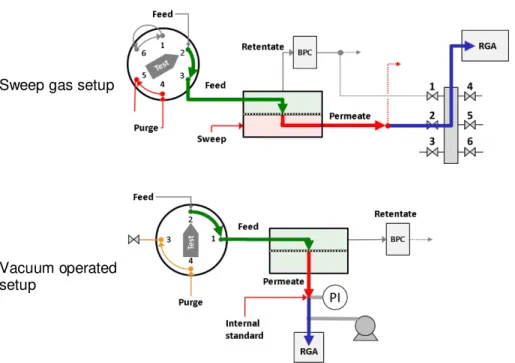
Figure 2.1: Chemical structures of the polymers used in the present work ... 14 Figure 2.2. Scheme of the fixed volume / pressure increase time lag setup. ... 16 Figure 2.3. Scheme of the mixed gas permeation setup in the test mode, with quadrupole gas analyser optimized for operation with a sweeping gas at the permeate side of the membrane. In the purge mode, with the 6-way valve in the 1-position, argon purge gas flows from connection 3-4 through the feed side of the membrane cell and the feed flow is bypassed via 2-1-6-5 ... 18 Figure 2.4. Scheme of the mixed gas permeation setup with quadrupole gas analyser optimized for vacuum operation at the permeate side of the membrane in test mode and during purge with helium (Insert). ... 20 Figure 2.5. Scheme showing for both setups the contributions of the flowing gas to the total time lag of the system just after switching from purge to test mode. The feed flow (thick green arrows), permeate/sweep flow (thick red arrows) and flow through the injection port into the analyser (thick blue arrows) each contribute to the instrumental time lag given by Eq (2.9). Note the fundamental difference between the sweep gas setup with minimum volume lines in the permeate and analysis section and the vacuum operated setup with voluminous vacuum connections but with low pressure... 24 Figure 2.6. Thickness dependence of permeability (A,B) for Pebax® 2533 (left) and Hyflon® AD60X (right) with their ideal selectivity (C,D) for selected gas pairs. Determination of the diffusion coefficient for membranes with different thicknesses according to eq.(2.7) , D=l2/6 (E,F) ... 29
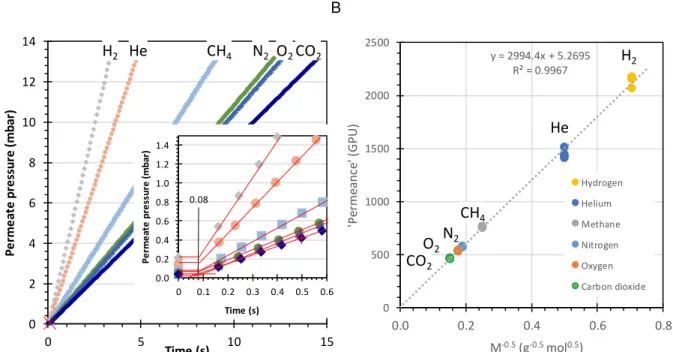
Figure 2.7. (A) Determination of the instrumental time lag by an aluminium foil sample with a pinhole defect. (B) Evidence of Knudsen flux in a plot of apparent permeance versus Mi-0.5 at
different pressures according to Eq. Error! Reference source not found.. The apparent permeance
of different gases calculated on the basis on a hypothetical active area of 2.14 cm2... 30
Figure 2.8. A) Example of the N2, CO2and O2 permeate flow rates as calculated by eq.(2.19) from
the start of the experiment, including 10 minutes for determination of the baseline. B) Corresponding cumulative permeate volumes after switching from purge mode to test mode, as determined by eq. (2.30), allowing for the simultaneous determination of all components in the gas mixture. Gas mixture: N2/CO2/O2 80/10/10 vol%, Membrane: 126 m Hyflon®AD60X dense
Figure 2.9. Determination of the instrumental time lag for membranes with different thicknesses according to the equation 2
0 6
i l Di
for Pebax® 2533 (A) and Hyflon® AD60X (C) in the
sweeping gas setup at a sweep flow rate of 30 cm3 min-1 and with gas mixture N2/O2/CO2 80/10/10
vol.%. Analogous results in the vacuum permeate setup (B, D) with pure CO2 and CH4 and in the
mixture CH4/CO2 50/50 vol.%. Comparison with the instrumental time lag determined by an
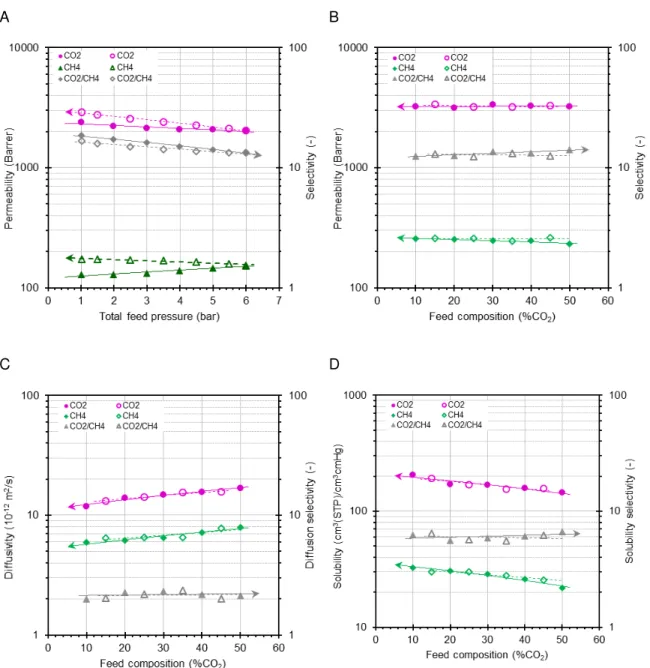
aluminium foil sample with a pinhole defect in the sweeping gas setup (E) and the vacuum setup (F), respectively. {Error bars in A an B are smaller than the symbol} ... 34 Figure 2.10. Dependence of the mixed gas CO2 and CH4 permeability and selectivity of sample
PIM-EA-TB as a function of the total pressure in the sweeping gas setup (A) and as a function of the mixture composition in the vacuum setup (B) of sample PIM-EA-TB as a function of the gas mixture composition in the vacuum system. Sweeping gas system operating with mixture of 51/49 vol% CO2/CH4 in the pressure range from 1-6 bar(a) and vacuum system operating at a total feed
pressure of 1.05 bar(a) and a composition in the range of 10-50 vol% CO2.
Concentration-dependence of CO2 and CH4 diffusivity and related selectivity (C) and indirectly calculated
solubility (D). Filled symbols represent the runs with increasing pressure (A) or increasing CO2
concentration (B-D) and open symbols represent the subsequently decreasing pressure or CO2
Figure 4.3: MS on-line monitoring of CO2 and O2 permeation at 30ºC and at 1.05 bar (absolute
pressure) in terms of permeability (Barrer) and normalised diffusion coefficient (cm2/s) versus time
through different membranes: (a) PDMS, (b) PE and (c) Pectin + 50% glycerol ... 69 Figure 4.4: Evolvement of (a) the flux (mol/(m2.s)), (b) the permeability (Barrer), and (c)
normalised permeability (-) of pure O2 and of O2 in a model air mixture (20% O2 and 80% N2) . 70
Figure 4.5: Evolvement of flux (mol/(m2.s)) and permeability (Barrer) along time of: (a) O2 (in an
air mixture) in dry and humid conditions (32% relative humidity) and (b) pure CO2, in dry and
humid conditions (32% relative humidity) ... 71 Figure 4.6: Normalised permeabilities through the pectin membrane for (a) O2 in an air mixture,
in dry and humid conditions (32% relative humidity) and (b) pure CO2, in dry and humid conditions
L
IST OF
T
ABLES
Table 2.1:Average thickness (μm) of the membranes prepared and used in this work ... 28 Table 2.2. Typical relative sensitivity factors for different gases and their selected fragments obtained experimentally in this work and calibrated in relation to Argon. ... 32 Table 2.3. Gas diffusion coefficients in Pebax® 2533 and in Hyflon® AD60X determined by different methods. ... 36 Table 3.1:Permeability of dry gases. ... 47 Table 3.2: Comparison of transport performance of different membranes referred in the literature. ... 51 Table 3.3: Transport performance of hybrid polysaccharide membranes for synthetic flue gas and biogas dehydration. ... 53 Table 4.1: Calibration factors obtained for CO2 and O2 in relation to N2. ... 60
Table 4.2: Sorption coefficients of pure O2 and CO2 in the polymers PDMS, PE and pectin with 50% glycerol, obtained in this work at 30 ºC ... 65 Table 4.3: Comparison of permeability and diffusion coefficient values of O2 and CO2 for the
polymers PDMS, PE and Pectin with 50% glycerol under steady state, obtained in this work (at 30ºC and 1.05 bar. absolute pressure) and reported in the literature. ... 66 Table 4.4: Permeability and ideal selectivity of CO2 against O2 in an air mixture, at a relative
humidity of 0% and of 32%. A pectin membrane was used at 30ºC. ... 73 Table 5.1: Conditions of PDMS membranes preparation and resulting chosen properties. ... 82 Table 5.2: Transport parameters determined for 300 ppm ethyl acetate (EtAc) and 300 ppm hexyl acetate (HxAc) during pervaporative separation with PDMS 50 membrane. ... 86 Table 5.3: Sorption coefficient SLi of ethyl acetate (EtAc) and hexyl acetate (HxAc) in contact with
1
I
NTRODUCTION
1.1
Background and Motivation
Membrane separation technologies have been established for separation and purification processes due to their potential application in different areas: chemical, petrochemical, biochemical, pharmaceutical, environmental, food, beverage and so on [1]. Membranes are increasingly competitive compared to traditional techniques due to their potential efficiency with a low energy expenditure and to the fact that they may work without the use of chemical additives in a compact modular design [2]. In membrane separation processes, the key properties that determine membrane performance are their selectivity and permeability towards the target solute(s) and their stability / lifetime under operating conditions. In the recent years there is a significant advance on the design of new membrane materials with improved transport properties for novel applications in order to respond ato market needs [3].
Particularly, dense membranes are widely used industrially in processes such as pervaporation and gas separation, with the objective of reducing their operational costs maintaining or increasing the performance associated with the intended separation. In fact, it is well known that processes involving phase change are generally energy-intensive, and distillation is a notorious example of them. The energy consumption when using a pervaporation process is clearly reduced when compared to a traditional distillation process. From a thermodynamic point of view the energy required to bring a solute in solution, in the feed stream, to its vapour state in the permeate stream, is the same. However, the energy expended with the solvent and other components with a low affinity to the membrane is much lower, due to high affinity usually achieved for the solute of interest. To date, pervaporation has been proposed for applications in the following three areas:
(i) dehydration of organic solvents (e.g., alcohols, ethers, esters, acids); (ii) removal of dilute
organic compounds from aqueous streams (e.g., removal of volatile organic compounds, recovery of aroma, and biofuels from fermentation broth); (iii) organic–organic mixtures separation (e.g.,
methyl tert-butyl ether (MTBE)/methanol, dimethyl carbonate (DMC)/methanol). Among them, dehydration of organic solvents is best developed [4] and the only one largely used at an industrial scale.
Similarly, the membrane technology for selectively remove CO2 gas emissions from mixtures with
H2, CO, N2 and CH4 is of interest for a wide variety of applications, such as syngas processing,
of compressed air and the conditioning of gas used for storage of fruits and vegetables under protective atmosphere. Water vapour is generally considered a minor component of the system in such industrial applications, however, the presence of water, even at trace concentrations, may change significantly the permeation behaviour of the other gas species present [7,8].
Adequate transport characterisation tools are required for improving strategies of membrane design. An integrated use of complementary characterisation techniques is necessary for establishing and understanding the relations between structural and morphological properties of the dense materials developed and their transport performance in terms of permeability and selectivity [9].
Nonporous/dense films have a homogeneous structure without any defined pores. However, at a molecular level, the polymer chains are arranged in such a way that dynamic free volumes should be considered. The process of permeation through dense films is classically described by the solution-diffusion model, which is based on solute-membrane interactions. The transport can be then separated into the following three steps: [10]
• sorption of the permeating species onto the membrane surface,
• diffusion of the species through the membrane,
• desorption of the species on the downstream side of the membrane.
Transport of a chemical species through a dense membrane can be described as:
D
S
P
(1.1)where the permeability (P) is expressed as a function of sorption (S) and diffusivity (D).
In the solution-diffusion model, because no total pressure gradient exists within the membrane, the transport can be written as the Fick’s first law when the system is under steady-state:
dx
dc
D
J
i
i i (1.2)where the flux, Ji, of a component through a plane is proportional to the concentration gradient
dc/dx. The proportionality is the diffusion coefficient, Di[10,11].
To better understand the transport properties is thus necessary to study the solubility and diffusion parameters of the permeating compounds through the membrane [12].
Henry’s law, which assumes a linear relationship between the solute partial pressure in the contacting stream, pi, and the concentration at the interface, inside the membrane [11]
i i i
S
p
c
(1.3)Sorption and desorption steps are frequently assumed to be extremely fast and, hence, they do not limit transport from a kinetic point of view when comparing with the diffusion process, which is considered the rate-determining step. In other words, the sorption equilibrium with the external phase at the membrane surface is quasi-instantaneous and not the controlling step for the transport of the penetrant component i from the external phase into the polymer. It is also usually
assumed that the interfacial concentration of the sorbed penetrant is constant over time at the upstream side of the membrane and negligible at the downstream side of the membrane. This can be achieved either by applying vacuum conditions or by using an inert gas over the membrane downstream surface (respectively, vacuum or sweeping gas conditions at the downstream side of the membrane). As a consequence, the diffusive flux of a component i across the membrane
is maximal and, ideally, its molecular motion within the membrane is purely diffusive. Therefore, diffusion plays a major role in determining the overall rate of permeation [13].
The change in concentration (c) as a function of position and time (t), when the system is under
a transient regime, is given by the second Fick’s law where it is assumed that the diffusion coefficient (Di) is constant:
2 2
x
c
D
t
c
i i i
(1.4)with the following boundary and initial conditions:
𝑐(𝑥, 0) = 0; 0 < 𝑥 < 𝐿 𝑐(𝑥, 𝑡) = 𝑐𝑖,0; 𝑡 > 0
𝑐(𝑥, 𝑡) = 𝑐𝑖,𝑥= 0; 𝑡 > 0, 𝑥 = 𝐿
The most common technique used to characterise mass transport through dense membranes in ideal systems is the time-lag method, originally conceived by Daynes in 1920 [14], in order to study mass transfer through an elastomeric material. This method was refined and extended by authors as Crank [15,16], and Rutherford and Do [17], applied to a large variety of materials. The calculation method underlying the time lag technique, based on the penetrant theory, can be found in Crank et al. [16]. If a penetrant-free membrane is exposed to a penetrant at the feed side at t=0 and the penetrant concentration is kept very low at the permeate side, then the total amount
2 2
2 2 2 2
1
1 2 ( 1)
exp 6
n t
i
Q D t D n t
l c l n l
(1.5)in which ci is the penetrant concentration at the membrane interface at the feed side, l is the
membrane thickness [m] and D is the diffusion coefficient [m2 s-1]. When
t
, the total amountof penetrant, Qt[mol m-2], passing through the membrane is given by:
D l t l Dc Q i t 6 2 (1.6)
This equation has an intercept lag on the time-axis given by:
D
l
lag6
2
(1.7)Through the continuous monitoring of the pressure increasing rate in the permeate side of a closed membrane cell, the permeability is determined from steady state:
P m
f
V V
l
dp
P
RT A p
dt
(1.8)The time-lag permeation method (eq.(1.7)) is a flexible and powerful technique for studying ideal systems. This method allows for determining both equilibrium (sorption coefficient) and transport properties (diffusivity and permeability) in a single experiment [18].
Nevertheless, this technique is valid only for permeating solutes with no strong affinity to the permeated material. The standard mathematical analysis used with this technique assumes a constant diffusion coefficient throughout the transient and the steady-state permeation periods. For processes in which the diffusion coefficient cannot be assumed to be constant, the use of the time-lag technique can lead to significant errors [19], since it does not account for the concentration dependent behaviour of the diffusion coefficient (the variation of the diffusion coefficient against time, t, and position within the membrane, x). These changes in time and
As described above, there are situations that affect transport across the membrane, deviating
from the “ideal transport”. At high feed concentrations and/or when processing solutes with high affinity to the membrane, the membrane polymeric structure can be modified to an extent that its intrinsic properties are significantly altered and a strong non-ideal behaviour occurs. For understanding these interactions, as well as the polymer swelling / fluidisation, different approaches / models based on the Flory-Huggins Theory [11,21] and UNIQUAQ are often applied for a quantitative description of the interaction of the feed components with the membrane material.
The Flory-Huggins theory is based on a lattice model to describe the entropy of mixing of solutions (solute-solute, solute-polymer, and polymer-polymer). This model allows for calculating the number of combinations that are possible in order to arrange a mixture between two components based on their volume fractions. In this case, the Gibbs free energy for mixing a polymer with a solvent is described as:
n
1ln
1n
2ln
2n
1
2
RT
G
m
(1.9)with ΔGm the Gibbs mixing energy; n1, n2 and 1, 2 are the number of moles and volume fraction
of component 1 and 2, respectively. The Flory Huggins parameter, i, is the interaction parameter,
which can be adjusted for a non-ideality behaviour [11,20].
The UNIQUAC (UNIversal QUAsi-Chemical) model is widely used for the description of liquid-liquid and vapor-liquid-liquid equilibria. This model accounts for the different sizes and shapes of the molecules as well as for the different intermolecular interactions between the mixture components and the polymeric compounds [22]. Over the years, several approaches of these models have been developed to apply in the different fields describing the transport of a penetrant through the membrane in non-ideal systems [23–25].
In non-ideal processes various phenomena can occur inside the membrane, leading to a change of the diffusivity of a permeant with its own local concentration (and other permeants present). For example, a faster transport of solutes, which can be quantified by an increase of their diffusion coefficients, may result from the plasticization of the membrane [12,26–29], whereas the decrease of diffusivity can be due to solvent clustering phenomena [30]. In other words, the diffusion coefficient of a solute within a membrane may be concentration-dependent and not constant across it.
C m
i
D
e
D
m i
0, , (1.10)
where Di,m0 is the diffusion coefficient of species i in the membrane under ideal conditions, γ is
the plasticisation coefficient, and C the local permeant concentration.
The models and theories presented above were developed aiming at predicting the sorption and diffusion of a solute through a polymer when non-ideal solute-polymer interactions occur at molecular level. Most time-lag work has been performed with mono-component gases [31–33] and pervaporation [12,34] systems, where data is obtained by an accurate recording of pressure in a closed receiving compartment.
Some authors calculated the concentration-dependent diffusion coefficients from transient sorption data in order to determine the plasticisation parameter of a penetrant, which diffusivity is assumed to vary exponentially with its concentration [9,26,27]. However, the treatment of data assumes a Fickian diffusion process with a constant diffusion coefficient and the model is applicable only for the transport of a single component and not in a mixture.
All these methods usually involve single gas/vapor species, which is a strong limitation when considering that in many applications individual gas species influence other species, when present as a mixture. Relatively few papers discuss mixed gas sorption, providing solubility data of individual gases in a mixture [35,36]. Mixed gas permeation measurements by the variable volume method usually uses gas chromatography (GC) for analysis of the gas composition. This is a relatively slow technique with a sampling time of several minutes per data point, for common GC, or slightly less than one minute for micro-GC, which represents a discontinuous analysis of transient phenomena [37,38]. More recently, several papers have been published using on-line mass spectrometry in order to characterise the simultaneous permeation of multiple species both in gas permeation and pervaporation processes [31,34,39,40].
On-line mass spectrometry MS was proposed as an advanced analytical method for process monitoring thanks to its possibility to provide real-time information [41], while the fast analysis makes it also excellently suitable to follow the transient permeation stage in different application fields. This technique enables to follow the whole permeation process of mixtures of gases and vapours through dense films, and allows for determining permeate compositions and partial pressures, fluxes and selectivities in real-time.
Since it is a very versatile tool, mass spectrometer can be coupled to a pervaporation [39] and gas permeation system [31] by a restriction or a capillary tube in the permeate compartment in order to analyse, with a high resolution, the permeate composition leaving the membrane. Mass spectrometry characterises compounds by their specific mass-to-electric charge (m/z) and relative abundance or intensity of electric signal, providing a characteristic mass fragments fingerprint of a specific compound. Figure 1.1 represents the Mass Spectrometry operating principle. Ions are produced in the ionization chamber by electron impact ionisation due to the potential difference between filament and electron collector. Positive ions are separated, by an electrical field in the case of the common mass filter Quadrupole, according to their mass-to-electric charge (m/z) and converted to a corresponding mass-to-electric signal in the detector. Relative intensities are usually used, assuming that the highest value of ion current for a specific compound in a specific experiment is equal to 100%.
Figure 1.1: Schematic representation of Mass Spectrometry operating principle.
In addition, a sample introduction system is necessary to admit the samples to be studied to the ion source, while maintaining the high vacuum requirements (~10-5 to 10-7 mbar) of the technique.
A computer is required to control the instrument, acquire and handle data, and compare spectra to reference libraries.
1.2
Research Strategy
As known, before a permeation process begins, the membrane is dry and free from the target solutes. As the dense membrane is exposed to different penetrants, its structure may be gradually modified until acquiring its final steady-state conformation. The estimation of the transport parameters of permeating species through the membrane is, therefore, critical since the transport parameters may be altered due to the potential matrix rearrangement occurred during the transient period.
The extent of membrane modification is related with the interaction that the different permeating species establish with the membrane material. The greater the affinity of the solute to the membrane, the greater the modification it may cause in the membrane matrix and, consequently, the greater the impact on the transport properties.
Aiming at understanding the membrane modification during the permeation process in different applications, a mass spectrometry (MS) monitoring tool was used. The MS, used so far only as a permeate monitoring tool in pure gas permeation and pervaporation processes [12,31,39,40], will be used in this work as an instrument to characterise solute-membrane interactions. This powerful technique will enable a real-time characterisation of solute transport through dense membranes by acquiring real-time information of the transport parameters in the whole permeation process. The strategy of this research project comprises an indirect monitoring of the interactions that the penetrating solute establishes with the membrane and, consequently, possible membrane rearrangements, both in gas permeation and pervaporation systems, through the estimation of the diffusion coefficients. The systems studied were selected due to their different affinity towards target solutes (gases, water vapour, aroma compounds or alcohols). In this way, ranging from systems where the interactions are mostly negligible, to those where the diffusion coefficient is significantly modified during the permeation process, a methodology to calculate the evolvement of the diffusion coefficient of different species through the membrane along time is proposed and assessed.
The transport studies were performed by coupling the pervaporation / gas permeation cell on-line with the Mass Spectrometer, linked by a split line to the permeate circuit. Different membranes are characterised by measuring the mass of permeating species on-line, in real-time. Through the information acquired, the purpose will be to understand how different solutes interact with different membranes and how that impacts on the membrane transport behaviour.
instrument supplier or tabulated in the literature are not universal enough to be used as a standard for high precision analysis [31] as they are altered, taking into account the operating conditions used as well as the equipment. Therefore, the mass spectrometry instrument must be calibrated for each system and each permeating compound to be studied.
Finally, a mathematical model was developed in order to obtain solute concentration profiles inside the membrane and their evolvement along time. Two case-studies were selected, corresponding to different systems, using permeating solutes with different affinities towards the membranes under study. The transport properties of two different membrane materials were compared: a polymeric membrane, which may be prone to potential material reorganisations and a ceramic membrane with a rigid structure, where material rearrangements are not anticipated.
1.3
Thesis Outline
The work performed during this PhD is organised considering the relevance of solute-membrane interactions, starting from a situation where these interactions may be considered to be negligible (Chapter 2) and, therefore, the diffusion coefficient can be considered constant. In a second stage, this work addresses situations where molecular interactions become more relevant, involving solutes with a high affinity to the membrane material, which may modify its structure during the permeation process (from Chapter 3 to Chapter 5). In this second case, the transient diffusion coefficient varies significantly and was considered to be time-dependent. For the situations where the diffusion coefficient has to be considered time-dependent, a mathematical model was developed (Chapter 6) aiming to simulate the solute concentration profile inside the membrane, from the initial instants of the permeation process until reaching steady state conditions.
The present work is, thus, organised in seven chapters:
Chapter 1 describes the motivation for this PhD project, presents the research strategy, the objectives and finally describes the thesis outline.
solutes. The transport behaviour exhibited by the different materials, when penetrated by permeating compounds with affinity for them, is compared and discussed. To characterise the transport of each species through the membrane, time-dependent diffusion coefficients were calculated from on-line Mass Spectrometry monitoring data since diffusion coefficients were not constant throughout the permeation process.
In Chapter 4 a mass spectrometry monitoring tool is used to monitor the permeation of water vapour, pure gases (CO2, CH4 and N2) and mixed gas streams, in particular flue gas and biogas,
using a hybrid polysaccharide membrane. The permeation of single and mixed gases both under dry and humidified conditions through the membrane were assessed, aiming at obtaining very low gas permeabilities, and high selectivities for water in relation to each gas under study. The characterisation and study of different solutes’ permeation through dense membranes aiming at aroma recovery (ethyl acetate and hexyl acetate) and isopropanol dehydration using a pervaporation system coupled to a mass spectrometer are described in chapters 5 and 6. Chapter 5 studies the effect of different organophilic solutes through polydimethylsiloxane PDMS membranes. The evolvement of solute transport during the transient period is assessed in this chapter, through the calculation of time dependent D(t) diffusion coefficients in the whole permeation process. Solute solubilisation within the membrane polymer matrix is noticeable in the first instants of permeation, inducing internal rearrangements that impacts not only on the transport of solutes themselves, but also on the transport of the solvent.
Chapter 6 defines and presents a methodology for characterising solute transport through pervaporation dense membranes (a ceramic membrane, where no membrane material rearrangement occurs during permeation, and a polymeric membrane). Through a real-time characterisation of transport through dense membranes, time dependent D(t) diffusion coefficients were calculated in the whole permeation process. Based on the information acquired, a mathematical model was developed in order to obtain solute concentration profiles inside the membrane and their evolvement along time.
2
A
NOVEL TIME LAG METHOD FOR THE ANALYSIS OF MIXED GAS
DIFFUSION IN POLYMERIC MEMBRANES BY ON
-
LINE MASS
SPECTROMETRY
:
METHOD DEVELOPMENT AND VALIDATION
Submitted to Journal of Membrane Science as: S. C. Fraga,M. Monteleone, M. Lanc, E. Esposito, A. Fuoco, L. Giorno, K. Pilnacek, K. Friess, M. Carta, N. B. McKeown, P. Izak, S. Petrusova, J.C. Crespo, C.Brazinha, J.C. Jansen
The author was directly involved in planning all the experiments related with the gas permeation experiments coupled to the Mass Spectrometry under vacuum conditions, as well as on the data elaboration, discussion and interpretation.
2.1
Summary
The present manuscript describes a novel method to determine the individual diffusion coefficients of gases in a mixture during their permeation through polymeric membranes. The method was designed and validated in two independent laboratories, using rubbery Pebax® and glassy Hyflon®AD membrane samples for the method development and the Trögers base derived Polymer of Intrinsic Microporosity, PIM-EA-TB, for validation. Monitoring of the permeate composition in real time by a quadrupole mass spectrometer allowed the analysis of the permeation transient after exposure of the membrane to a gas mixture. Two operation modes are compared, using either vacuum in the permeate with a heated restriction connected to the mass spectrometer, or using a sweeping gas with a heated capillary sample inlet. Excellent agreement between the data obtained for Pebax® and Hyflon®AD in the mixed gas setup and a traditional time lag setup demonstrates the suitability of the method and confirms that no anomalous transport occurs in these two polymers. The manuscript gives a complete overview of the method development, identification of the critical parameters, calibration of the instruments, elaboration of the data and estimation of the experimental accuracy. Validation of the method with the Trögers base containing polymer of intrinsic microporosity, PIM-EA-TB, shows that it can successfully detect pressure and concentration dependency of the transport properties, such as dual mode sorption and pressure dependent diffusion.
2.2
Introduction
industrial waste gas. Increasingly challenging separation problems, involving particularly difficult olefin/paraffin separations or particularly voluminous flue gas and natural gas streams, has spurred the development of novel materials with improved selectivity and/or permeability.[43] Materials that have received considerable attention in the last 1-2 decades include glassy perfluoropolymers [44–46], polymers of intrinsic microporosity (PIMs) [47–51], microporous organic polymers (MOP),[51] thermally rearranged (TR) polymers [52–54], ionic liquids and poly(ionic liquid)s [55–57]. The development of such sophisticated novel membrane materials inevitably requires the development of improved methods to study their transport properties. Since the transport in dense polymeric membranes is governed by the solution-diffusion mechanism, the most common approach to study their transport properties, is the use of the so-called time lag method, which allows the determination of both the permeability coefficient and the diffusion coefficient of pure gases in the polymeric matrix, and indirectly, the solubility coefficient.[15,16] This is one of the simplest and most versatile methods for determination of the diffusion coefficient, with solutions also for porous media exhibiting surface diffusion or glassy polymers with strongly nonlinear sorption behaviour[17]. The feed pressure decay in pseudo-steady state conditions[58] or the simultaneous measurement of the feed pressure decay and the permeate pressure increase[59] were proposed to study the transport properties of materials with concentration dependent diffusion or with a strongly nonlinear sorption isotherm, respectively. Complex problems like cluster formation may require different solutions, assuming for instance the simultaneous existence of different diffusion coefficients.[60,61] Despite the simplicity of the time lag method, a problem for highly condensable vapours like water is that sorption of the vapour at the wall of the permeate compartment may lead to a dramatic underestimation of the permeability and an error in the diffusion coefficient.[19] In such cases, gravimetric sorption kinetics studies may provide a better method for the determination of the diffusion coefficient, while the equilibrium sorption yields the solubility.
All the above methods usually involve single gas or vapour species, which is a strong limitation when considering that in many applications the individual gas species influence each other in a mixture. Relatively few papers discuss mixed gas sorption, providing solubility data of the individual gases in a mixture, e.g. [62–64]. Mixed gas permeation measurements are not
straightforward because of complications in the analysis itself, and in interaction between the species in the gas mixture, especially when dealing with polymers with nonlinear sorption behaviour, strong physical aging or slow dilation.[50] Normally, these measurements are carried out in a cross-flow cell configuration by the variable volume method, using gas chromatographic analysis of the gas composition. This is a relatively slow technique with a sampling time of several minutes per point for normal GC or slightly less than a minute for micro-GC, which may yield
steady state permeation data but it does not allow the analysis of transient phenomena of ‘fast’
materials, and thus the determination of the mixed gas diffusion coefficient. A combination of 1H
determination of the solubility and diffusion coefficients of pure carbon dioxide and its mixtures with other gases.[65] However, this method is not suitable for routine analysis.
Instead, on-line mass spectrometry was proposed as an advanced on-line analytical method for process monitoring and control thanks to its high analysis speed and the possibility to provide real-time information on the process parameters.[41] The fast analysis makes it also excellently suitable to follow Isotopic-Transient Kinetics (ITK) in chemical reactions.[66] Interestingly, both flat and hollow fibre membranes are proposed as an alternative for the direct capillary inlet to the MS,[41] not taking into account the dynamics of the membrane itself in the mass transport. Indeed, membrane introduction mass spectrometry (MIMS) is considered as a special technique, where the high permeability of the membrane should guarantee a quick response and its selectivity should enhance the sensitivity towards specific species, in particular vapours[67] or dissolved gases.[68] Instead of using membranes for the sake of the analysis, Schäfer et al.
proposed to follow the mass transport in pervaporation membranes on-line by MS analysis[39], while Zhang et al. determined the relative humidity dependence of H2 and O2 permeation in
ionomer membranes for polymer electrolyte fuel cells.[69] Isotopic-transient permeation experiments under the steady-state pervaporation (PV) operation of rubbery polymer membranes allow the determination of concentration-dependent diffusion coefficients of penetrants.[12] Recently, the group of Crespo discussed the transient phenomena related to the membrane transport by on-line, quantitative monitoring of the organophilic pervaporation processes.[40,70] and gas separation processes [71]. Some of the present authors also used the Mass Spectrometric Residual Gas Analyser (MS-RGA) for analysis of the permeate under steady state permeation conditions of various Polymers of Intrinsic Microporosity (PIMs).[72–74] Tremblay et al. already described a novel method based on a MS-RGA for the analysis of permeability and
diffusivity of pure He, N2, CO2 and CH4 in four different rubbers, but the much lower CO2
permeability and CO2/N2 selectivity, in for instance PDMS, as compared to the literature values
raises serious concerns about the accuracy of their method.[31]
Pebax®2533 Hyflon®AD60X PIM-EA-TB
Figure 2.1: Chemical structures of the polymers used in the present work
2.3
Materials and Methods
2.3.1
Materials
Ethanol, absolute AnalaR NORMAPUR® ACS was supplied by VWR Chemicals (Italy). 1-Methoxy-perfluorobutane (HFE7100) was purchased from 3M. Hyflon® AD60X was purchased from Solvay-Solexis (Italy) and Pebax® 2533 was kindly provided by Arkema (Italy). All products were used without further purification, unless specified otherwise.
The Tröger’s base containing polymer of intrinsic microporosity, PIM-EA-TB, was synthesized as described previously [72] and the membrane was prepared in the form of a dense self-standing film prepared by solvent casting and very slow evaporation of the solvent. Since PIMs are known to undergo strong physical aging, a well-aged sample was used during the permeation tests to minimize the effect of the variable time on the performance.
1.1
Gases
Pure gases were supplied by Pirossigeno (Italy) at a minimum purity of 99.9995% and by Praxair (Portugal) at a minimum purity of 99.99%. Certified gas mixtures were supplied by Sapio (Italy) at a purity of ±0.01% from the certified concentration (CO2/CH4 mixture with 47.89 mol.% CH4 and
N2/CO2/O2 mixture with 10.10 mol.% CO2 and 10.02 mol.% O2).
1.1.1
Mass flow controller calibration
Custom-made gas mixtures were prepared in-line by mixing of the pure gases using calibrated EL-Flow electronic mass flow controllers (Bronkhorst, STV Portugal). For optimum accuracy, the MFCs were calibrated periodically to check for deviations from the factory standard and to guarantee precise gas dosage. The gas flow rates were determined at ca. 10 different flow rates in the range used for the future measurements. The measurement of the flow rate was performed
O O F F
O CF3
F
F F
F F
x 1-x n n
N
with a bubble flow meter or with a digital flow meter (ADM2000 Universal Gas Flowmeter, Agilent Technologies, USA), appropriately correcting for atmospheric temperature and pressure.
2.3.2
Membrane preparation
Hyflon® AD60X membranes were prepared as described previously, dissolving 5 wt.% of the polymer in HFE 7100 under magnetic stirring for 24 h at room temperature, normally 23±2 °C [75,76]. The homogenous solution was filtered through a 0.45 μm Teflon PTFE syringe filter and poured into a stainless steel casting ring resting on a glass plate and partially covered with a petri dish to slow down the evaporation. Dense membranes were obtained by solvent evaporation for 72 h at room temperature and the membranes were used as such for the permeation tests. Pebax® 2533 membranes were prepared according to the procedure reported previously,[77] dissolving Pebax® 2533 at a concentration of 10 wt.% in ethanol under slight reflux, while magnetically stirring for at least 2 h. The solution was cast into a stainless steel casting ring placed on a Teflon plate and covered with a Petri dish to slow down evaporation. The solution was left for 48 h to allow complete solvent evaporation at room temperature. After this time, self standing dense membranes were obtained.
A PIM-EA-TB membrane was cast from chloroform, dried in air and then methanol treated to remove residual solvent and to reset the casting history as described previously [72]. The sample was stored for several months to allow significant initial aging and reach a more stable and time-independent performance [74].
For all membranes, a proportionally larger amount of solution was used to obtain thicker films.
2.3.3
Experimental set-up and operating conditions
2.3.3.1
Fixed volume time lag system for pure gases
All gas permeability measurements were performed at 25±0.5 °C and at 1 bar, unless specified otherwise, comparing three different instruments, based on either the fixed volume or the variable volume method. The fixed volume-pressure increase instrument, constructed by ESSR (Germany) is an improved version of the instrument described previously [76] and is schematically displayed in Figure 2.2. The instrument is equipped with a fixed feed volume of about 2 litres, a fixed permeate volume. The permeate volume is expandable from 91.6 cm3 to 260 cm3 if it is
necessary to reduce the pressure increase rate and to prolong the time available to reach steady state. A set of two membrane pumps and a turbo molecular pump (Pfeiffer), guarantee a high and clean vacuum (< 10-3 mbar) for effective degassing of the samples without the risk of
Up to eight gas cylinders are connected simultaneously to the instrument and an additional liquid flask can be connected for vapour transport measurements. A feed pressure up to 2 bar can be used and the actual value is read with a resolution of 0.1 mbar; the permeate pressure is measured in the range of 0 to 13.3 mbar with a resolution of 10-4 mbar. The membrane cell
diameter is 75 mm and the effective area can be reduced by the use of appropriate aluminium masks on the membrane. The feed gas pressure is set by pneumatic valves and the gases can be alternated automatically. The entire system is computer controlled, guaranteeing extremely short response times. The crucial parts of the setup are placed in a thermostatic chamber, which allows measurements according to a previously chosen temperature program. Feed pressure, permeate pressure and temperature are continuously monitored during each measurement run and the diffusivity, permeance and permeability are automatically calculated and exported to a data file. The final calculations correct appropriately for the presence of a baseline slope in the case of desorption of volatile species or Knudsen flux through pinhole defects, or for nonlinearity in the final pressure increase curve due to strong dual mode sorption behaviour.
Figure 2.2. Scheme of the fixed volume / pressure increase time lag setup.
The measurement is carried out on circular membranes, typically with an effective exposed area between 13.84 cm2 and 1.77 cm2, depending on the need to mask the samples to reduce the
initial transient, to allow the determination of the diffusion coefficients of the penetrants by the time lag method (section2.4.1), and the determination of the permeability coefficient from the steady state pressure increase rate. At the standard measurement pressure of 1 bar none of the gases causes plasticization of the polymer matrix and Henry-type sorption occurs, which means that the simplest form of the solution-diffusion model can be used, in which the permeability, solubility and diffusion coefficients are all constant.
2.3.3.2
Variable volume system using mass spectrometry for pure and mixed gases with
the permeate under sweeping gas conditions.
The instrumental setup for the measurements with sweeping gas is displayed in Figure 2.3. The core of the system is a mass spectrometric residual gas analyser (Hiden Analytical, HPR-20 QIC Benchtop residual gas analysis system) equipped with a quadrupole mass filter (max. 200 AMU) and a heated sampling capillary with a typical flow rate of ca. 10-20 cm3 min-1 at ambient pressure,
Figure 2.3. Scheme of the mixed gas permeation setup in the test mode, with quadrupole gas analyser optimized for operation with a sweeping gas at the permeate side of the membrane. In the purge mode, with the 6-way valve in the 1-position, argon purge gas flows from connection 3-4 through the feed side of the membrane cell and the feed flow is bypassed via 2-1-6-5
The mass spectrometer is connected to a custom made constant pressure / variable volume instrument, equipped with a modified Millipore permeation cell (diameter 47 mm). The cell is fed with the pure and mixed gases by means of EL-FLOW electronic mass flow controllers (Bronkhorst, NL) for each gas, and the pressure is controlled with an EL-PRESS electronic back pressure controller (0-5 bar(g)) in the retentate line. Two independent mass flow controllers provide the argon sweep gas continuously to the permeate side of the cell, and the same gas to the feed side of the cell, when in purge mode between to subsequent measurements. The measurement cell and part of the connections are located in a thermostated chamber to guarantee operation at controlled temperature. The gas is sampled with a heated capillary from the permeate side of the membrane, which is flushed with a known excess of sweeping gas at atmospheric pressure.
Mixed gas permeation experiments were carried out on the described constant pressure / variable volume instrument. The experiments were carried out at a feed flow rate of 100-200 cm3 min-1
and a controlled feed pressure of 0-5 bar(g). Argon was used as the sweeping gas at ambient pressure, normally at a flow rate of 30 cm3 min-1. The permeate composition was determined via
Mass Spectrometric analysis of the permeate/sweep composition. The 36Ar signal was used as
the internal standard for calculation of the gas flow rate of the permeating species based on their relative concentrations in the sweep/permeate stream. Since too high humidity is known to affect severely the other signals by chemical reactions taking place at the filament, and thus reduce the sensitivity to detect other gases, only high purity dry argon is used.[78] Highly permeable samples were masked with an adhesive aluminium tape with a smaller aperture to limit the total permeate flow rate and to keep the stage cut close to or below 1%.
Before each analysis, the membrane was flushed for at least 1 hour at both sides with two independent argon streams until the MS signal was sufficiently stable, and this signal was taken as the background. Subsequently, the argon flux at the feed side was instantaneously replaced by the pure gas or the gas mixture at atmospheric pressure (absolute pressure 1 bar(a)) via the 6-way valve, and the gas concentrations in the permeate were followed as a function of time. Thus, the time lag (section 2.4.1) and the time needed to reach steady state permeation were determined. If desired, in a second experiment, the feed pressure was stepwise changed from 1 to 5 bar(g) and back, with sufficiently long time intervals to reach steady state permeation in each step. The background signals were determined just before switching from argon to the gas or gas mixture at the feed side, and were subtracted from the measured signal during data processing.
2.3.3.3
Variable volume system using mass spectrometry for pure and mixed gases with
the permeate under vacuum conditions.
The setup for performing pure and mixed gases separation experiments with mass-spectrometric analysis of the permeate under vacuum conditions is displayed in Figure 2.4. The main difference compared to the sweeping gas setup is its direct connection of the permeate side with the mass spectrometer with a restriction. The permeate side is kept at very low pressure using a dry and oil-free diaphragm vacuum pump (Pfeiffer vacuum, MVP 015) and a constant low argon flux is used (1 cm3 min-1) as an internal standard. The unit comprises a membrane cell with the