Joana da Costa Franco Afonso
Licenciatura em Ciências da Engenharia Química e
Bioquímica
Catalytic hydrogenation of carbon
dioxide to form methanol and methane
Dissertação para obtenção do Grau de Mestre em
Engenharia Química e Bioquímica
Orientador: Manuel Nunes da Ponte, Professor
Catedrático, FCT/UNL
Júri:
Presidente: Prof. Doutor Rui Manuel Freitas Oliveira
Arguente: Prof. Doutora Susana Filipe Barreiros
Vogal: Prof. Doutor Manuel Luís Magalhães Nunes da Ponte
i
Joana da Costa Franco Afonso
Licenciatura em Ciências da Engenharia Química e Bioquímica
Catalytic hydrogenation of carbon dioxide
to form methanol and methane
Dissertação para obtenção do Grau de Mestre em
Engenharia Química e Bioquímica
iii
Copyright © Joana da Costa Franco Afonso, FCT/UNL, UNL
i
Agradecimentos
A realização deste trabalho só foi possível devido ao apoio, directo ou indirecto, de algumas pessoas, às quais gostaria de agradecer.
Ao Professor Doutor Manuel Nunes da Ponte e à Doutora Ana Reis Machado, pela oportunidade de ingressar no seu grupo de trabalho e realizar esta tese. Tenho a agradecer-lhes toda a simpatia, disponibilidade e interesse demonstrados, assim como todo o conhecimento transmitido.
Ao Professor Doutor Luís Branco, por toda a simpatia, disponibilidade e apoio.
À minha mãe e irmã por o apoio incondicional, por terem sempre acreditado em mim e por toda a força que me deram. Também por todo o amor, carinho e paciência.
Ao meu pai, que à sua maneira me apoiou e incentivou.
Ao Pedro, por todo o apoio, companheirismo e amor, sem os quais não teria sido possível chegar ao fim desta etapa.
À minha família, por o apoio e encorajamento.
Por último, mas não menos importantes, obrigada aos meus amigos. Quero agradecer-lhes por todos os bons e maus momentos partilhados, por toda a compreensão, força e coragem que me deram.
iii
Abstract
This work was divided into 2 distinct parts, the first consisting in the electro-reduction of high pressure CO2 dissolved in an ionic liquid and the second in chemical catalysis of carbon dioxide reduction with hydrogen, using homogeneous and heterogeneous catalysts. In both cases new facilities were built with new and/or recycled materials.
This it is an exploratory work, which aimed to produce methane or methanol through the reduction of CO2. For this, we used carbon dioxide with hydrogen biphasic mixtures of ionic liquid / (CO2 + H2) at high pressure, 140 bar, and lower temperatures, 413K. A ratio of CO2: H2 = 3:1.
In the electrochemical experiments, three different cathode materials, different amounts of water in ionic liquid and two different gases were tested. We can see that the water content did not change the electrochemical potential window and AuPt may be the best of the tested materials, since it generated higher currents.
In the case of heterogeneous catalysis, the ionic liquid was impregnated into the catalyst. We used Pd, Rh and Ru catalysts supported on alumina. The reactions were conducted for 24h or 72h. Methane was obtained in reactions without ionic liquid, when Pd and Ru were used catalysts, Ru being the best; with 3.30% yield.
In homogenous catalysis, the catalysts were immobilized in an ionic liquid. We used [Ru(cod)Cl2]n and Ru(methylallyl)2(cod) catalysts with and without PPh3 ligand. The reactions were conducted for 24h and 38h. The products of the reaction were not identified, however, But there is the possibility of having obtained methanol.
v
Resumo
Este trabalho foi dividido em 2 partes distintas, a primeira consistiu na electrorredução do CO2 dissolvido a alta pressão em líquidos iónicos e a segunda na catálise química da redução do dióxido de carbono com hidrogéneo, usando catalisadores homogéneos e heterogéneos. Em ambos os casos foram construídas novas instalações com materiais novos e/ou reutilizados.
Este trata-se de um trabalho exploratório, que tinha como objectivo produzir metano ou metanol através da redução do CO2. Para isso usou-se dióxido de carbono com hidrogénio em misturas bifásicas de líquido iónico/(CO2+H2) a altas pressões, 140 bar, e baixas temperaturas, 413K. num rácio de CO2: H2=3:1.
Nas experiências de electroquímica foram testados três materiais de cátodo diferentes, diferentes quantidades de água no líquido iónico e dois gases diferentes. Pudemos verificar que o teor de água não alterou o potencial da janela electroquímica e que AuPt pode ser o melhor dos materiais testados, uma vez que foi o que gerou correntes mais elevadas.
No caso da catálise heterogénea, o líquido iónico foi impregnado no catalisador. Usaram-se catalisadores de Pd, Rh e Ru suportados em alumina. As reacções tiveram duração de 24h ou 72h. Obteve-se metano nas reacções sem líquido iónico onde se usaram os catalisadores de Pd e Ru, sendo que o último foi o que teve maior produção de metano; 3,30% do hidrogénio que estava disponível para reagir deu origem a metano.
Na catálise homogénea, os catalisadores estavam imobilizados no líquido. Os catalisadores utilizados foram [Ru(cod)Cl2]n e Ru(methylallyl)2(cod) com e sem o ligando PPh3. Estas reacções foram feitas durante 24h e 38h. Os produtos da reacção não foram identificados, no entanto existe a possibilidade de se ter obtido metanol nas reacções onde se usou o ligando.
vii
List of Symbols and Abbreviations
[bmim][BF4] – 1-Butyl-3-methylimidazolium tetrafluoroborate
[bmim][NTf2] – 1-butyl-3-methylimidazolium bis(trifluoromethylsulfonyl)imide
[emim][BF3Cl] – 1-ethyl-3-methyl-imidazolium trifluorochloroborate
GC – Gas Chromatography
HS-GC – HeadSpace Gas Chromatography
IL – Ionic Liquid
MOFs – Metal–organic Frameworks
NMR – Nuclear Magnetic Resonance
PPh3– Triphenylphosphine
[Ru(cod)Cl2]n– (1,5-Cyclooctadiene)ruthenium(II) chloride
Ru(methylallyl)2(cod) – Bis(2-methylallyl)(1,5-cyclooctadiene)ruthenium(II)
scCO2– Super critical carbon dioxide
SCIL – Solid catalyst with ionic liquid layer
SILP – Supported ionic liquid phase catalysts
ix
Table of Contents
Agradecimentos ...i
Abstract... iii
Resumo ...v
List of Symbols and Abbreviations ... vii
1. Introduction ... 1
1.1. CO2 Sources ... 2
1.2. CO2 Capture ... 3
1.3. CO2 Storage or Reduction? ... 4
1.4. Ionic liquids and carbon dioxide reduction ... 7
2. Experimental ... 11
2.1. Chemicals ... 11
2.2. Voltammetry... 12
2.2.1. Voltammetry Procedure ... 13
2.3. Calibration ... 13
2.3.1. Calibration Procedure ... 15
2.4. Gas analysis technique ... 16
2.5. Hydrogenation ... 17
2.5.1. Hydrogenation Procedure ... 18
2.6. Identification methods ... 19
3. Results and Discussion ... 21
3.1. Voltammetric experiments ... 21
3.2. Hydrogenation Experiments ... 24
4. Conclusions ... 30
5. References ... 32
6. Annex ... 36
Annex 1 ... 36
Annex 2 ... 37
Annex 3 ... 38
Annex 4 ... 39
x
Annex 6 ... 41
Annex 7 ... 42
Annex 8 ... 43
Annex 9 ... 44
Annex 10 ... 45
xi
List of Figures
Figure 1.1 – Surface temperatures projection. (A1) very rapid economic growth and global population, and introduction of new and more efficient technologies: (A1F1), intensive use of fossil fuels (A1T) non-fossil energy sources, (A1B) balance across all energy sources, (A2) economic growth and technological changes are more fragmented and slower than in other occurences. Continuously increasing global population. (B1) Rapid changes in economic structures toward a service and information economy, with reductions in material intensity, and the introduction of clean and resource-efficient technologies. The emphasis is on global additional climate initiatives solution to economic, social, and environmental sustainability, including improved equity, but without additional climate initiatives, (B2) emphasis is on local solutions to economic, social, and environmental sustainability.
Adapted from [3]. ... 1
Figure 1.2 – CO2 capture systems. Adapted from [5]... 3
Figure 1.3 – Reaction products and intermediates for CO2 reduction reactions. Adapted from [6]. ... 5
Figure 1.4 – Thermodynamic parameters for the hydrogenation of CO2. [2] ... 6
Figure 2.1 – Scheme of the high-pressure electrochemical cell: (1) gas inlet; (2) gas out; (3) quasi-reference electrode; (4) cathode: working electrode; (5) anode: counter electrode; (6) Teflon packing; (7) glass beaker; (8) stirrer. Adapted [25]. ... 12
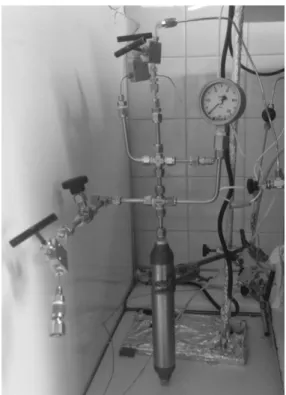
Figure 2.2 – Picture of the apparatus used for voltammetry experiments. ... 13
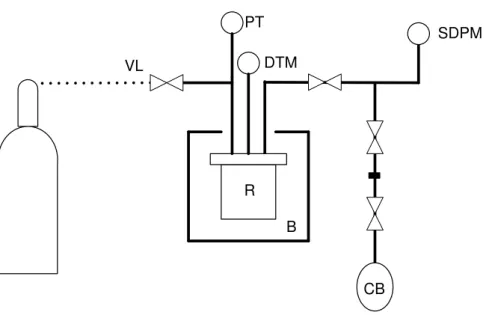
Figure 2.3 – Scheme of the calibration of high pressure installation: (VL) Ar inlet and output and vacuum line, (PT) pressure transducer, (DTM) digital temperature meter, (R) reactor, (B) bath, (SDPM) sensitive digital pressure meter, (CB) calibration balloon. ... 14
Figure 2.4 – Scheme of the calibration of expansion zone vessel: (VL) Ar inlet and output and vacuum line, (PT) pressure transducer, (EV) expansion vessel, (SDPM) sensitive digital pressure meter, (CB) calibration balloon. ... 14
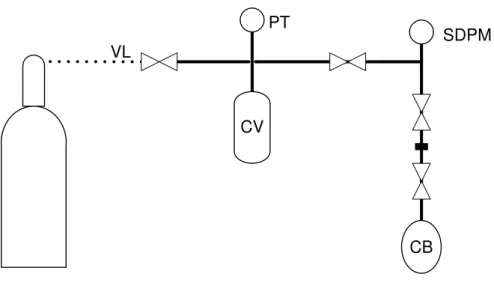
Figure 2.5 – Scheme of the calibration collecting vessel apparatus: (VL) Ar inlet and output and vacuum line, (PT) pressure transducer, (CV) collecting vessel, (SDPM) sensitive digital pressure meter, (CB) calibration balloon. ... 15
Figure 2.6 – Picture of the apparatus that allowed us to substantially reduce the amount of CO2 present in the collection vessel. ... 16
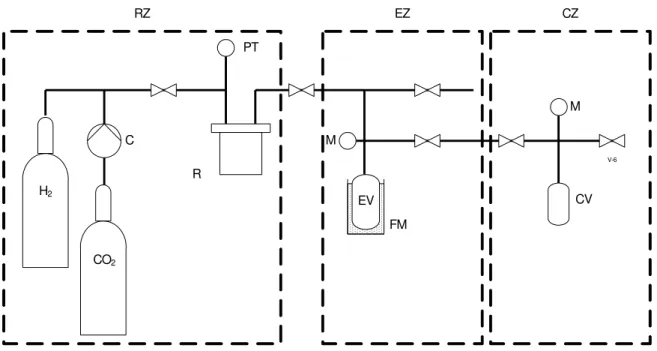
Figure 2.7 – Scheme of the hydrogenation apparatus: (RZ) reaction zone, (EZ) expansion zone, (CZ) collecting zone, (C) CO2 compressor, (R) reactor, (PT) pressure transducer, (M) manometer, (EV) expansion vessel, (FM) freezing mixture, (CV) collecting vessel. ... 17
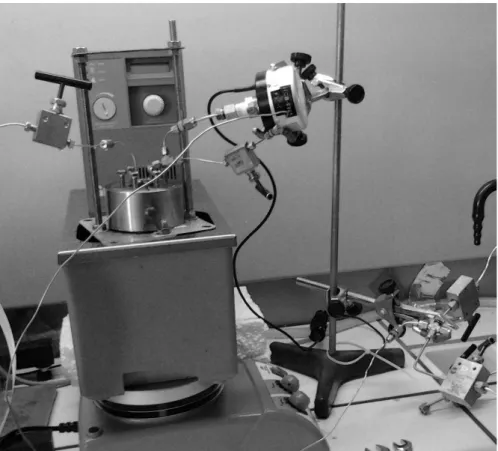
Figure 2.8 – Picture of the apparatus used for hydrogenation. ... 18
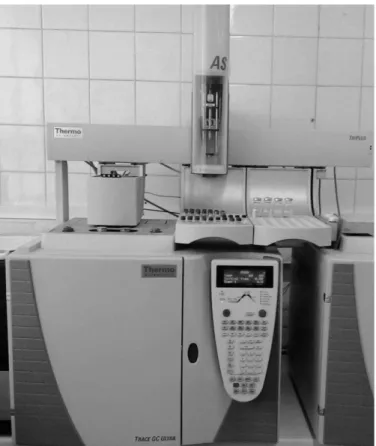
Figure 2.9 – TRACE GC Ultra used in HS-GC analysis. ... 19
Figure 3.1 – Cyclic voltammograms in [bmim][BF4] with a AuPt catalyst and a water content approximately (6) 1,7% and (7) 0,5%. Scan rate, 20 mV s-1. ... 22
xii
Figure 3.3 – Cyclic voltammograms in [bmim][BF4] with a Carbon fabric after 60 minutes exposure to (1) CO2; with Ag3Cu after 60 minutes exposure to (3) CO2; with AuPt after 60 minutes exposure to (5)
CO2. Scan rate, 20 mV.s-1. ... 24
Figure 3.4 – Equation for calculating the yield of methane. ... 25
Figure 3.5 – Molecular structure of [bmim]+. ... 26
Figure 3.6 – Proton NMR spectrum, reaction 9. ... 27
Figure 3.7 – Proton NMR spectrum, reaction 9 (red) and 10 (blue). ... 28
Figure 3.8– Proton NMR spectrum, reaction 9 (red) and 11 (blue). ... 28
Figure 6.1 – GC Spectra of the reaction 2. A: Signal 1 – rt=0,949 H2 ; rt=1,630 CH4; B: Signal 2 – rt=0,550 CO2. ... 36
Figure 6.2 – GC Spectra of the reaction 3. A: Signal 1 – rt=0,953 H2 ; rt=1,687 CH4; B: Signal 2 – rt=0,657 CO2. ... 37
Figure 6.3 – GC Spectra of the reaction 8. A: Signal 1 – rt=0,956 H2 ; rt=1,641 CH4; B: Signal 2 – rt=0,597 CO2. ... 38
Figure 6.4– Proton NMR spectrum, [bmim][BF4]. ... 39
Figure 6.5 – HS-GC spectrum, reaction 9. ... 40
Figure 6.6 – Carbon NMR spectrum, reaction 9. ... 41
Figure 6.7 – HS-GC spectrum, reaction 10. ... 42
Figure 6.8 – Carbon NMR spectrum, reaction 10. ... 43
Figure 6.9 – HS-GC spectrum, reaction 11. ... 44
Figure 6.10 – Carbon NMR spectrum, reaction 11. ... 45
xiii
List of Tables
1
1. Introduction
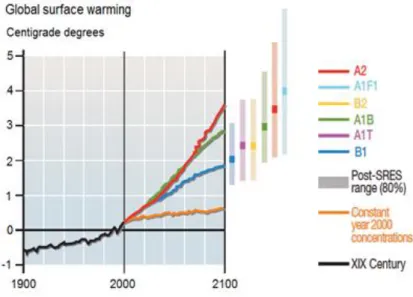
Global energy consumption is increasing rapidly due to population and economic growth. Currently, most of the energy is obtained by the burning of non-renewable fossil resources, which implies the production of greenhouse gases.[1] Scientists and Government agencies recognize the high contribution of carbon dioxide as a greenhouse gas to global warming. [2] Figure 1.1 shows surface temperature projections in different scenarios for the 21st century.
Figure 1.1 – Surface temperatures projection. (A1) very rapid economic growth and global population, and introduction of new and more efficient technologies: (A1F1), intensive use of fossil fuels (A1T) non-fossil energy sources, (A1B) balance across all energy sources, (A2) economic growth and technological changes are more fragmented and slower than in other occurences. Continuously increasing global population. (B1) Rapid changes in economic structures toward a service and information economy, with reductions in material intensity, and the introduction of clean and resource-efficient technologies. The emphasis is on global additional climate initiatives solution to economic, social, and environmental sustainability, including improved equity, but without additional climate initiatives, (B2) emphasis is on local solutions to economic, social, and environmental sustainability.
Adapted from [3].
Human activity has a direct consequence on the concentration of greenhouse gases. Since anthropogenic greenhouse gases accumulate in the atmosphere, they produce net warming by strengthening the natural “greenhouse effect”. The concentration of carbon dioxide in the atmosphere has been increasing since the last century compared to the rather steady level evident during the pre-industrial era. Nitrous oxide and methane have also suffered an increase.
2
CO2 is achieved in the near future. Some changes in the climate system would be irreversible in the course of a human lifespan. For example, in the worst case scenario, it is expected an average temperature increase of between 2.4oC and 6.4oC by 2100.[3]
According to the statistics published by the International Energy Agency, [4] in 2010, 43% of CO2 emissions from fuel combustion were produced from coal, 36% from oil and 20% from gas. In the same year, there was an increase of about 4.9% over the previous year in CO2 emissions from the combustion of coal, which represented 13.1 GtCO2. Coal is indeed the worst offender of the fossil fuels in terms of CO2 emissions per unit of energy produced. However, it is currently the preferred energy source in the most populous developing countries, such as India and China, where intensive industrial production of energy is growing rapidly and access to large coal domestic reserves is easy. If nothing is done, estimates are of an increase of 15.3 GtCO2 emissions from coal alone by 2035. The same publication reports that reducing CO2 emissions from coal to 5,6Gt by 2035 could be possible by the use of more efficient plants and end-use technologies as well as increased use of renewable and nuclear energy and, last but certainly not the least, carbon capture and storage technologies.[4]
1.1.
CO
2Sources
In its first special report on carbon dioxide capture and storage, [5] the Intergovernmental Panel on Climate Change calls the attention to the importance to map the emissions where carbon dioxide concentration is higher, because these are more amenable to the use of capture technologies. It is quite obviously impracticable to capture CO2 directly from the atmosphere, where its concentration is currently around 400 ppm. At the emission point (power plants and factories, for instance) the concentrations of carbon dioxide are usually of the order of 15% or less. These concentrations correspond to the normal combustion processes, where atmospheric oxygen (at 20 % concentration in air) reacts with carbon in fossil fuels, to produce carbon dioxide. The future proportion of high and low-content CO2 sources will largely depend on the rate of introduction of hydrogen, biofuels, and the gasification or liquefaction of fossil fuels, as well as future developments in plant sizes.
In the energy sector, the use of biomass as fuel is still very low; the selection of fuels in the industrial sector is sector-specific. For example, in the refining and chemical sectors the primary fuels are gas and oil, in the cement industries all fossil fuels are used, and in some parts of the world coal, as mentioned above, is the dominant form.
3
1.2.
CO
2Capture
The CO2 capture involves the capture of this gas resulting from combustion and/or preparation of fossil fuels, as well as power generation and natural gas processing. Industrial processes such as the production of hydrogen, ammonia, steel, iron or cement, also produce carbon that can be captured.
There are four basic systems of CO2 capture, these are: post combustion capture; pre-combustion capture; oxyfuel pre-combustion capture; industrial process streams capture. Figure 1.2 shows a simplified diagram of these systems.
4
After combustion, CO2 is captured from flue gases produced from the combustion of fossil fuels and biomass. When combustion gases are produced, they are not directly dumped into the atmosphere; instead they pass through a device that separates much of the CO2, which is then stored in a reservoir; the remaining flue gases are released into the atmosphere. For this process, a chemical sorbent process is used. The 2005 report of the IPCC[5] identified the main systems of reference for post-combustion capture as the then installed capacity of 2261 GW of oil, coal and natural gas power plants and in particular, 155 GW of supercritical pulverized coal fired plants and 339 GW of natural gas combined cycle plants, which represented the types of high efficiency power plant technology where CO2 capture can be best applied.
In the second system above mentioned, pre-combustion capture, there is the reaction of fuel with oxygen or air and/or steam. This reaction originates essentially synthesis gas (syngas), composed of carbon monoxide and hydrogen. These systems were considered strategically important by the report. Reference systems for the application of pre-combustion capture were existing natural gas, oil and coal-based syngas/hydrogen production facilities and other types of industrial system.[5]
In a oxy-fuel system, combustion is performed with almost pure oxygen instead of air, giving a result of combustion gas that is mostly made up of carbon dioxide, and water in the case of hydrocarbon fuels. The oxygen used cannot be pure, because if it was, when gas was burned, the temperature of the flame would reach very high temperatures, but CO2 and/or H2O-rich flue gas can be recycled to the combustor to moderate this. The membranes and chemical looping cycles that are being developed are new techniques that are used for the supply of oxygen to the fuel. These new techniques, associated with low temperature (cryogenic) air separation are used to produce oxygen. The power plant systems of reference for oxy-fuel combustion capture systems which are the same as those mentioned above for post-combustion capture systems.
The capture of carbon dioxide from industrial processes has been made for 80 years or more. However, since there are no incentives or requirements to store this gas, most of the captured CO2 is released into the atmosphere. The purification of natural gas, such as the production of synthesis gas containing hydrogen to produce ammonia, alcohols and synthesis of liquid fuels are a few examples of this type of CO2 capture. The techniques used for the capture of the gas in these industries resemble the techniques used in pre-combustion CO2 capture. The production of cement and steel, among others, also lead to the production of carbon, but this is not captured. The techniques used in the above systems can also be used in this system to capture CO2 from streams.
1.3.
CO
2Storage or Reduction?
5 human fatalities may happen in case of rupture of any pipeline going through densely populated areas. Moreover, underground storage will certainly be opposed by many environmentalists and neighbour associations, due to fears of leakages through geological fractures and the risk of accidents at the surface.
In this context, transformation of carbon dioxide into useful products through reduction reactions is progressively being proposed as an alternative. Carbon dioxide as a C1 carbon source has been mentioned for decades. And in fact, life has found a solution for that problem many millions of years ago through photosynthesis. The carbon source of most living organisms is indeed atmospheric CO2.
Industrial chemical processes using carbon dioxide as a reactant exist, with the production of urea occupying a very prominent first place in terms of quantities of CO2 used. The sheer volume of current greenhouse gas emissions is however much bigger than the whole production of carbon-containing chemicals. Thus, even if the production of the Chemical Industry could be entirely based on CO2, it would use only a small fraction of anthropogenic carbon emissions.
The only industry that is large enough to make a significant impact in emission reductions is the energy industry itself. Carbon dioxide reduction products contain carbon and can be used as a new energy source. Methods that can be used to convert CO2 into fuels are photosynthesis, chemical catalysis and electroreduction.
Carbon dioxide is a stable molecule, with a highly negative Gibbs energy of formation. In order to make it react, either highly energetic reactants, such as hydrogen, must be used or energy directly supplied to the system, in the form of light or electricity. For instance, electrochemical reduction of CO2 gas on a solid electrode has been employed to produce methane, and others as shown in Figure 1.3. [6]
Figure 1.3 – Reaction products and intermediates for CO2 reduction reactions. Adapted from [6].
6 1 1 1 1 2 4 2 2 1 1 1 1 2 3 2 2 1 1 1 1 2 2 2
125
;
230
;
193
)
(
2
)
(
)
(
4
)
(
CO
88
;
106
;
79
)
(
)
(
)
(
3
)
(
CO
8
,
0
;
11
;
11
)
(
)
(
)
(
)
(
CO
K
Jmol
S
kJmol
H
kJmol
G
l
O
H
l
CH
aq
H
aq
K
Jmol
S
kJmol
H
kJmol
G
l
O
H
l
OH
CH
aq
H
aq
K
Jmol
S
kJmol
H
kJmol
G
l
O
H
aq
CO
aq
H
aq
Figure 1.4 –Thermodynamic parameters for the hydrogenation of CO2. [2]
As to proposed catalysts, a range of high-surface-area macro- and microporous materials, such as inorganic materials (e.g. alumina, silicas, and zeolites), organic materials (e.g. activated carbon materials), and complex metal–organic frameworks (MOFs) have been tried. [2]
The most desirable products for energy production are methane and methanol. Methane is a precursor to many useful organic chemicals, it can be used as fuel and it is used in the generation of electricity in fuel cells. Special applications have been proposed for space travel, to obtain drinking water by combining the on-board hydrogen rocket fuel with carbon dioxide produced by the astronauts. [7] Eight electrons are however needed to reduce the fully oxidized carbon into methane; the kinetic limitations are significant, so the use of catalyst is essential to achieve acceptable rates and selectivities.
Hydrogenation of CO2 to methanol is thermodynamically more favourable, needing only six electrons. Methanol has the disadvantage that, contrarily to methane, there is no complete infrastructure already built to handle it for transport and end-user utilization. As a liquid fuel, It would however have some distinct advantages over methane and use the infrastructure of petrol distribution already in place.
Much is said about the reaction of carbon dioxide to produce methane and methanol. Most studies on the methanation reaction of CO2 have been conducted at high temperature (> 200° C). [8] It would be important to carry out CO2 reductions at lower temperatures (< 200 °C), in order to improve the flexibility of the operation, especially when the CO2 and/or H2 sources are intermittent, and to improve the energy efficiency of the process.
7 catalytic activity of Ru/Al2O3 fine particles prepared by spray reaction (SPR) were much higher than those obtained by conventional impregnation (IMP) under the same conditions. Which indicates that the SPR is an excellent method plausible and an excellent method for preparing high-activity catalysts.
Hydrogenation of CO2 on Pd supported by Al2O3, TiO2, SiO2 and MgO was investigated by Erdöhelyi et al. [12] The dispersion of Palladium is important, when it is very dispersed the reaction product is methane, when it is a little spread out the product can be methanol or water-gas shift. The dispersivity of Pd-Mg/SiO2 catalyst has also been studied in the methanation reaction of CO2 with hydrogen. [7] The catalyst at 450oC, presents 95% selectivity for CH4, with a CO2 conversion of 59%. Palladium supported on silica reduces mainly CO2 to CO.
Rhodium catalysts have also been studied. Solymosi et al. [13] investigated the hydrogenation of CO2 in Rh/Al2O3 to a measurable rate above 443 K, with only methane product. This support was compared with others, concluding that the most effective has been TiO2 and SiO2 less effective. Iizuka et al. [14] also did a study on the catalyst of rhodium in different supports. Their aim was to compare the reactivity of different catalysts in the reaction of hydrogen with carbon dioxide and carbon monoxide. Recently the effect of addition of O2 to the mixture of CO2/H2 has been studied. When the gas is added in small quantities it has a beneficial effect on CO2 methanation reaction, however, if a large amount is added, this will have a negative effect. The relationship between Rh particle size and intrinsic catalytic activity has also been studied. [8]
In respect to homogeneous catalysis, Jessop et al. [15] were pioneers. They performed a study where formic acid was produced from a mixture of supercritical carbon dioxide and hydrogen, using a ruthenium catalyst, where ligands had been modified to include groups with high solubility in high pressure CO2. Previously, Leitner et al. [16] performed CO2 hydrogenation in aqueous solutions of amines using RhCl(TPPTS)3 and rhodium-based catalyst [RhCl(COD)2]2/TPPTS and [RhH(COD)]4/TPPTS. Joó et al. [16] studied this same reaction in aqueous solutions of free amines. They concluded that in acidic media reactions are slower. With hydrogenation of CO2 is also possible to obtain formic acid, Zhang et al. [17] did this study. The conditions of the reaction were: 6MPa (CO2/H2) to 60oC, during 5h; used ruthenium chloride catalysts or ruthenium complexes. Tai et al. [18] also made studies in this sense, they tested 44 different phosphines in combination with 3 precursors of Ru(II) different and [RuCl2(C6H6)]2. Only 6 of the phosphines tested resulted in high rates of production of formic acid.
1.4.
Ionic liquids and carbon dioxide reduction
8
solvents may result in exactly the type of pollution that the use of ionic liquids is supposed to avoid. [20] The combination of ionic liquid and supercritical carbon dioxide for achieving more convenient reaction and product recovery, reported recently, has further extended the research and application scope of ionic liquids. [21] [22] [23] In the course of these studies, it was discovered that carbon dioxide may be highly soluble in many ionic liquids.
The solubility of carbon dioxide in ionic liquids is usually through absorption. Although most be through physical absorption involves the weak association between CO2 and IL, some IL absorb through chemical reaction. [24] Some studies show that the supercritical CO2 (scCO2) is highly soluble in ionic liquids, however these liquids are not soluble in scCO2, so it is possible to extract many organic compounds of ILs. This property is very important because it makes it possible to separate scCO2-soluble chemicals from ILs using scCO2 without any cross-contamination. [25]
For the imidazolium- and pyridinium-based ILs the solubility of the gas is mainly controlled by interactions with the anion. [26] [27]
Other characteristic important to note that the ionic liquids are their high ionic conductivity and wide electrochemical window. [21] [28]The conversion of CO2 in methanol with an electrochemical photocell was studied by Ogura et al. [29] The electrocatalytic reduction of CO2 proceeds via a limited surface of a metal complex in the presence of a homogeneous catalyst. Naitoh et al. [30] investigated the electrochemical reduction of carbon dioxide in methanol at low temperature. Electrolysis was performed with a copper cathode and an anode of Platinum in methanol catholyte containing benzalkonium chloride and in 0.1 M hydrogen carbonate or 80 mM benzalkonium chloride anolyte. In one carbon-based energy cycle concept, it was studied the reaction of electrolytic hydrogen with CO2, to form methanol and water [31], another concept was the formation of methane by means of electrolytic hydrogen reaction with CO2 (with condensation of water to shift the equilibrium and achieve good yields). [32] Hori et al. were able to make the direct reduction of CO2 to methane and ethylene with current densities of 5-10 mA cm−2 and efficiency of current up to 69%, at 0oC. [33] [34]
9 Mixtures of high pressure carbon dioxide and ionic liquids were first used for green processing by Brennecke et al. [20] Selective hydrogenations can be conducted in this type of mixtures. [36]
11
2. Experimental
The start of my thesis work coincided with the launching of a new programme in the research group I was about to join. This programme aims at devising new methods to reduce carbon dioxide, by chemical or electrochemical catalysis, to fuel products, such as methanol and methane. Several researchers are involved in this project. Part of my work was therefore carried out in close collaboration with other researchers, while another part was essentially performed by myself, although under supervision by senior group members. Each piece of work reported here involved the previous design and assembling of a new high pressure apparatus.
The experimental work was divided in two distinct parts:
I – In the first part, I collaborated in the setting up of laboratory facilities to carry out the electroreduction of high pressure carbon dioxide dissolved in ionic liquids. This work involved: (1) building a new, simple high pressure cell with incorporated cathodes of different materials and a zinc sacrificial anode (see Figure 2.1); (2) assembling a specially designed high pressure apparatus to collect samples of reaction products, and to increase several times their concentration in relation to carbon dioxide, in order to facilitate detection and analysis (see Figure 2.6); (3) characterising several cathode materials immersed in ionic liquids through voltammetry measurements.
II – In the second part, I focused my attention on chemical catalysis of carbon dioxide reduction with hydrogen, using either heterogeneous or homogeneous catalysts. This part of the work was exploratory, experimenting with diverse catalytic systems, with the main objective of trying to find out simple, but promising routes to implement the reaction. Ionic liquids were used as solvents in homogeneous systems, or as selectivity modifiers, in heterogeneous systems. This part of the work has also included assembling a new high pressure apparatus, bringing together several pre-existent pieces (see Figure 2.7 and 2.8).
In this chapter, the assembled apparatus will be described, as well as the experimental procedures followed for the voltammetric measurements and for the high pressure hydrogenations.
2.1.
Chemicals
Hydrogen and carbon dioxide were supplied by Air Liquide with a stated purity of 99.98 mol%. These substances were used as received without any further purification.
Silicon oil was bought to Labor Spirit.
Carbon fabric type B1 used was bought from Clean Fuel Cell Energy Lt.
Ag3Cu and AuPt were prepared by Catalonia Institue for Energy Research under the framework of a FP7 research project
12
The studied ionic liquids [bmim][BF4] and [bmim][NTf2] were supplied by Solchemar. These liquids were used as received, without any further purification.
2.2.
Voltammetry
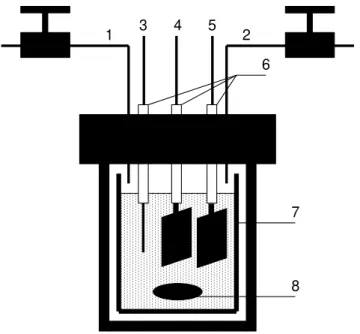
The high pressure electroreduction cell was an adaptation of a pre-existent small reactor. This reactor is made of stainless steel and has a volume of 150 cm3. Its scheme and picture are shown in Figure 2.1 and 2.2, respectively. This cell was placed in a thermostated oven, for temperature control. The voltammetric measurements were performed with three electrodes inside the cell (3, 4 and 5, in Figure 2.1), a pressure transducer, a temperature sensor. The ionic liquid solvent inside the cell was magnetically stirred, using an external stir plate and a magnetic bar.
Figure 2.1 – Scheme of the high-pressure electrochemical cell: (1) gas inlet; (2) gas out; (3) quasi-reference electrode; (4) cathode: working electrode; (5) anode: counter electrode; (6) Teflon packing; (7) glass beaker; (8)
stirrer. Adapted [25].
1 3 4 5 2
7
13 Figure 2.2–Picture of the apparatus used for voltammetry experiments.
2.2.1. Voltammetry Procedure
First, CO2 was introduced in the cell up to 30 bar, and released, in order to purge the cell to remove oxygen in the system. This was repeated three times. When the temperature of the air bath and the pressure of the cell are at desired values for the experiment, we waited 1 hour for proper stabilisation. A voltammetric measurement was then carried out. Pressure varied from 7 to 60 bar, depending on the type of gas: lower pressures for test experiments with argon, the highest pressure was used with carbon dioxide. Temperature was always 45oC. The program NOVA was used for electrical current measurement (AUTOLAB 84469 used the power source). The scan rate at which they were carried out voltammetry measurements were 20, 50 and 100 mV.s-1.
2.3.
Calibration
14
with water, was used as reference (CB in Figures 2.3 and 2.4). A pressure digital meter, with a measurement precision of < 0.1% FS at room temperature, registered pressure values at different stages of the expansion method.
Schemes of the different apparatus requiring calibration are shown in Figures 2.3, 2.4 and 2.5.
VL
R
B PT
DTM
CB
SDPM
Figure 2.3 –Scheme of the calibration of high pressure installation: (VL) Ar inlet and output and vacuum line, (PT) pressure transducer, (DTM) digital temperature meter, (R) reactor, (B) bath, (SDPM) sensitive digital pressure meter, (CB) calibration balloon.
VL
CB
SDPM PT
EV
15
CV
VL
PT
SDPM
CB
Figure 2.5–Scheme of the calibration collecting vessel apparatus: (VL) Ar inlet and output and vacuum line, (PT) pressure transducer, (CV) collecting vessel, (SDPM) sensitive digital pressure meter, (CB) calibration balloon.
2.3.1. Calibration Procedure
The procedure starts with the connection of the calibrated balloon, as shown in Figures 2.3, 2.4 and 2.5, followed by the addition of Argon1. Pressure was registered and the calibrated vessel valve was then closed, the remaining volume was then connected to the vacuum pump, until a very low pressure was attained. The gas inside the calibrated vessel was expanded into the volume to be calibrated and pressure measured again.
Values of the calibrated volumes of the different apparatuses are given in the following Table.
Table 2.1 –Volume values obtained for the various devices.
Devices Volume (cm3)
Chemical reaction vessel 30
Collecting Vessel (1) 80
Collecting Vessel (2) 48
Electrochemical reaction vessel 150
Expansion Vessel (1) 140
Expansion Vessel (2) 1015
16
2.4.
Gas analysis technique
Large amounts of CO2 were used to carry out the voltammetric measurements and the hydrogenation reactions. Direct sampling from the reaction vessel would thus contain carbon dioxide in such excess that the detection of the reaction products and measurement of their concentrations by gas chromatography would be very difficult. In order to solve this problem and to facilitate the GC analysis of the products, we built an apparatus that allowed us to substantially reduce the amount of CO2 present in the collection vessel.
This apparatus consists of an expansion vessel with the volume of 140 cm3. When the voltammetric measurements or the hydrogenation reactions were finished, the reactor was connected to this expansion vessel, which was then immersed in a cryogenic mixture of ice, salt and N2. At these temperatures, CO2 would liquefy, contrarily to the reaction gaseous products, like methane, which stayed in the gas phase. Samples for analysis were than taken from the gas phase. By removing large quantities of CO2 from this phase, the concentration of products such as methane was amplified several times, allowing its easier detection by GC.
By establishing an equilibrium pressure, gas concentrations are the same in any part of the installation, i.e. the concentration of CO2 and other gases is equal in the expansion vessel and the cell. With the information concerning the gas concentration detected in GC analysis and using the calibration curve we can obtain the information of the number of moles of the product that we obtained. Knowing the density of the CO2/H2 mixture at high pressure and doing some calculations we obtain the number of moles of hydrogen which were available to react, so we can know the yield of the reaction relative to limiting reagent, H2.
Figure 2.6 shows the installation that was created.
17
2.5.
Hydrogenation
Hydrogenations were performed in a high pressure stainless steel reactor, inside a fume hood. This reactor has the volume of 30 cm3, as given in Table 2.1, and it is immersed in a thermostated silicone oil bath. The mixture inside the reactor is stirred, using an external stir plate and a magnetic bar. The scheme of this apparatus is shown in Figure 2.7.
CO2
H2
C
CO2
PT
R
M
EV FM
CV M
V-6
RZ EZ CZ
18
Figure 2.8 – Picture of the apparatus used for hydrogenation.
2.5.1. Hydrogenation Procedure
The reactor was assembled, as show in figure 2.7 and 2.8, it is important to confirm that the output valves are closed. After you make sure that the output valves are closed, we inserted CO2 to a pressure of 30 bar. We wait a few seconds until pressure stabilizes. So, we inserted 20 bar of H2 and look forward a few more seconds until the value of the pressure remained constant. Finally, we insert a further 30 bar of CO2. When the pressure was stable at 80 bar, we put the reactor inside the bath and we turn on the same. Until the temperature inside the reactor reaches 140oC, pressure was increasing. When the pressure reached stabilized we turn on the stirrer inside the reactor and start counting the time of the reaction. Passed 24 or 72 hours, depending on the reaction we wanted to do, we turned off the stirrer and the temperature of silicone oil bath.
19
2.6.
Identification methods
The qualitative identification of products obtained was carried out by Gas Chromatography HeadSpace (HS-GC) and Nuclear Magnetic Resonance (NMR).
The HS-GC used was TRACE GC Ultra. The column used was a 100% Dimethyl Polysiloxane fused silica capillary column (dimensions: 30 m x 0.32 mm internal diameter x 3.0 μm film thickness). The carrier gas was hydrogen (1mL/min) and the oven program was 50ºC (1 min) to 130ºC (2min) at 10ºC/min.
The nuclear magnetic resonance analyses were performed on a Bruker Avance III 400.
The quantitative analysis was carried out by gas chromatography. An Agilent Micro GC 3000 was used equipped with a backflush 1 µl injector. The separation of the compounds present in the gas current was done in two columns. One of the columns was a MolSieve 5A 10 m x 0.32 mm with Plot U 3 m x 0.32 mm pre-column, with argon as carrier gas (Channel 1). The other column is a Plot U 8 m x 0.32 mm column with a Plot Q 1 m x 0.32 mm pre-column with helium as carrier gas (channel 2). After separation on the column, the sample gas flows through a thermal conductivity detector (TCD).
On channel 1, the column and injector temperature were 100°C and 90°C, respectively. Sampling time was 10 s, injector time was 200 ms, run time 180 s and pressure equilibration time was 10s. Column and post-run pressure were 30 psi and 40 psi. Detector sensibility was standard and the data rate was 50 Hz. Baseline off set was 0mV; backflush time was 9.5 s. Channel 2 only differs in the column temperature, this was of 60oC, post-run pressure was 32 psi and the detector sensitivity was high.
21
3. Results and Discussion
The first part of this work addressed the electrochemical reduction of CO2. It is known that different products can result from this type of electrolysis, which depends critically on the materials used to build the electrode. Thus, voltammetric experiments were performed in order to characterize cathodes made of different metals. The influence of the amount of water present in the ionic liquid was also checked, as hydrogen produced at the cathode from water may also influence the products and the yield of reaction. In this way, tests were conducted with three different cathodes, with different amount of water in the liquid.
The second part of this work addressed the chemical reduction of CO2 using homogeneous or heterogeneous catalysis methods. Experiments were conducted with different catalysts, under the same conditions of pressure and temperature. Homogeneous catalysis was carried out using ionic liquids as solvents. In the case of heterogeneous catalysis, catalysts were used as such or coated with ionic liquids.
3.1.
Voltammetric experiments
Cyclic voltammetry is an electrochemical technique where an electric current generated by a varying applied potential is measured. Usually, a cyclical scanning of the potential is implemented, and the result of the experiment is a current versus potential curve. For these experiments, three different electrodes are needed, a working electrode, where the potential is applied, a counter electrode, and a reference electrode, all usually immersed in one liquid solution. Using a potentiostat system, the potential is varied at a certain scan rate (measured in Volts per second), up to a certain pre-defined value, and then brought back to the original value. The imposed electrical potential imposes an electric current that generates electrochemical reactions at the surface of the working electrode. The shape of the curve current vs. applied potential depends critically on these electrochemical phenomena, and may reveal important information concerning the interaction between the electrode materials and the reacting species in solution.
22
Table 3.1 –Voltammetric experiments using the ionic liquid [bmim][BF4] as solvent, in contact with the referred
gases at the stated pressure, silver as the reference electrode and zinc as counterelectrode.
Entry
Working
cathode
Counter anode
Gas
phase
Pressure
(bar)
Water (%)
Scan rate
(mV.s
-1)
1
Carbon fabric
Zn
CO
260
0.5
20; 50; 100
2
Carbon fabric
Zn
Ar
7
0.5
20; 50; 100
3
Ag
3Cu
Zn
CO
260
0.5
20; 50; 100
4
Ag
3Cu
Zn
Ar
7
0.5
20; 50; 100
5
AuPt
Zn
CO
260
0.5
20; 50
6
AuPt
Zn
CO
260
1.7
20; 50
7
Carbon fabric
Zn
CO
260
1.5
20; 50
8
Carbon fabric
Zn
CO
260
2.5
20; 50
9
Carbon fabric
Zn
CO
260
3.5
20; 50
This experiment matrix was set up in order to allow us to compare:
(1) water content, by comparison between runs 1, 7, 8, and 9, and also between runs 5 and 6; (2) carbon dioxide vs. argon, using runs 1 and 2, for carbon fabric; and 3 and 4, for Ag3Cu; (3) electrode materials, using runs 1, 3, and 5.
It should be mentioned that the results of the experiments with the lowest used scan rate, at 20 mV s-1, turned out to be more precise than the others, and so all comparisons were made based on that rate.
Figure 3.1 shows the cyclic voltammograms obtained for runs 5 and 6, with a AuPt working electrode and water contents of 0.5 and 1.7 %, respectively.
Figure 3.1 –Cyclic voltammograms in [bmim][BF4] with a AuPt catalyst and a water content approximately (6)
1,7% and (7) 0,5%. Scan rate, 20 mV s-1.
-100 -80 -60 -40 -20 0 20 40 60 80 100
-4 -3 -2 -1 0 1 2 3 4
Cu rr e n t d e n si ty (m A .cm -2)
Potential vs Ag/Ag+
(6)
23 The water content did not change the electrochemical potential windows. The result is however surprising, because it indicates a current density decrease with increased water content. This result is contrary to what would be expected. In fact, the experiments performed by Schröder et al. [40] show, as expectable, that the current increases with the increase of water in ionic liquid, due to the reduction to hydrogen. On the other hand, comparison between runs 1, 7, 8, and 9 could not be done, due to the highly irregular profiles of the curves obtained in runs 7 to 9.
As a consequence, the only conclusion we may have reached was that experiments with much larger water contents should be performed, in order to try and devise the effect of water content in the presence of dissolved carbon dioxide.
Figure 3.2 shows cyclic voltammograms in [bmim][BF4] with a carbon fabric cathode, runs 1 and 2, and Ag3Cu, runs 3 and 4 in Table 3.1.
Figure 3.2 –Cyclic voltammograms in [bmim][BF4] with a Carbon fabric after 60 minutes exposure to (2) Argon,
(1) CO2; with Ag3Cu after 60 minutes exposure to (4) Argon, (3) CO2; Scan rate, 20 mV.s-1.
-80 -60 -40 -20 0 20 40 60
-4 -3 -2 -1 0 1 2 3 4
Cu rr e n t d e n si ty (m A .cm -2)
Potential vs Ag/Ag+
(2) (1) -20 -15 -10 -5 0 5 10 15 20
-4 -3 -2 -1 0 1 2 3 4
Cu rr e n t d e n si ty (m A .cm -2)
Potential vs Ag/Ag+
(4)
24
These experiments have shown that carbon fabric does promote the electrochemical reduction CO2, with a reaction onset potential around -1 V, while Ag3Cu seems totally ineffective for this purpose.
Figure 3.3 compares the results of the experiments with CO2 for the three different types of cathode used in this work, with all other conditions equal.
Figure 3.3 –Cyclic voltammograms in [bmim][BF4] with a Carbon fabric after 60 minutes exposure to (1) CO2; with Ag3Cu after 60 minutes exposure to (3) CO2; with AuPt after 60 minutes exposure to (5) CO2. Scan rate, 20
mV.s-1.
It is apparent what had already been verified in Figure 3.2, namely that Ag3Cu is not an adequate material for the reduction of CO2. Carbon fabric and AuPt, are both suitable materials, with similar onset potentials. These preliminary findings also indicate that AuPt might be the best of the tested materials, as it generates higher currents.
3.2.
Hydrogenation Experiments
This part of the work aimed at exploring the possibility of reducing carbon dioxide with hydrogen using either homogeneous or heterogeneous catalysts at relatively mild conditions. One of the objectives was to obtain a preliminary assessment of whether the use of ionic liquids as solvents or as catalyst modifiers could prove beneficial for this purpose.
Hydrogenation of CO2 was performed with and without the addition of other solvents. Hydrogenation was carried out with different types of catalysts and ionic liquids.
Tables 3.2 and 3.3 summarize the experiments that were carried out and the respective reaction conditions. -100 -80 -60 -40 -20 0 20 40 60 80 100
-4 -3 -2 -1 0 1 2 3 4
Cu rr e n t d e n si ty (m A .cm -2)
Potential vs Ag/Ag+
(1)
(3)
25 Table 3.2 – Heterogeneous Reaction. * Reaction yield regarding hydrogen as the limiting reagent.
Heterogeneous Reaction Conditions
No. Catalyst Solvent Pressure (bar) Time (h) Temp. (K)
Produced CH4
(mmol)
Yield (%)*
1 Rh/Al3O2 CO2 80 24 413.15 - -
2 Ru/Al3O2 CO2 80 24 413.15 0.694 3.30
3 Pd/Al3O2 CO2 80 24 413.15 0.170 0.81
4 Ru/Al3O2 CO2/[bmim][BF4] 80 24 413.15 - -
5 Rh/Al3O2 CO2/[ bmim][BF4] 80 24 413.15 - -
6 Pd/Al3O2 CO2/[ bmim][BF4] 80 24 413.15 - -
7 Pd/Al3O2 CO2/[ bmim][BF4] 80 72 413.15 - -
8 Pd/Al3O2 CO2 80 72 413.15 0.148 0.70
Table 3.3 –Homogeneous reaction.
Homogeneous Reaction Conditions
No. Catalyst Ligand Solvent Pressure (bar) Time (h) Temp. (K)
9 Ru(methylallyl)2(cod) - CO2/[bmim][BF4] 80 24 323.15
10 Ru(methylallyl)2(cod) PPh
3 CO2/[bmim][NTf2] 80 39 413.15
11 [Ru(cod)Cl2]n PPh3 CO2/[bmim][NTf2] 80 24 413.15
Reaction yields were calculated relative to hydrogen, as this is the limiting reagent. The quantities of hydrogen and carbon dioxide produced in the reaction were obtained by GC analysis. The GC calibration curve is given in Annex 11. Using the calibrated volumes of the sampling apparatus, described in chapter 2, and the density of the carbon dioxide + hydrogen mixtures, calculated using the GERG-2004 equation of state, [41] the GC determined gas concentrations were translated into concentrations in the reaction mixture at the end of the reaction.
100
(100%)
Yield
2 4x
H
mol
produced
CH
mol
Figure 3.4 –Equation for calculating the yield of methane.
26
production of methane in the reactions when ruthenium and palladium catalysts were used. Ruthenium was the most active catalyst.This result was not expected, since rhodium was expected to be one of the most active metals. [8]The smallest yields were obtained with palladium catalysts.
In the three following reactions, ionic liquid-coated catalysts were used. The method of forming the ionic liquid layer is called SCIL or SCILL [36]. In none of these reactions was there any production of methane, even when reactions were repeated allowing longer times.
The experiments with homogenous catalysts were carried out either in [bmim][BF4] or [bmim][Ntf2], under a pressure of 80 bar of carbon dioxide. In reactions 9 and 10 (see Table) Ru(methylallyl)2(cod) and [Ru(cod)Cl2]n precursors were used. In reaction 9, 15 mg of precursor weredissolved in 3 mL of IL. For reaction 10, a ruthenium phosphine complex [39] was previously prepared. In order to do this, we used toluene, because triphenylphosphine and Ru(methylallyl)2(cod) are not miscible. Finally, for reaction 11, IL, triphenylphosphine and [Ru(cod)Cl2]n were added to the reactor, without pretreatment.
We start by analyzing the results obtained by GC. These show that there was no formation of methane, only H2 and CO2 were detected. The following analysis was done with HS-GC. For reaction 9, we can observe two peaks, one peak at 6.45 minutes and another at 9.53 minutes (Annex 5). The results do not allow us to conclude if other potential compounds, such as methanol, were present in the sample, so we did an analysis of NMR.
We start by analyzing the proton NMR spectrum (Figure 3.6). To facilitate the interpretation a letter was assigned to each proton.
The sign at 0.9 is a triplet, so we can say that this corresponds to the a proton. The next peak, with an area of 2.17 is a sextet, therefore corresponds to the proton b, the quintet, also with two protons, so with an area approximately equal to 2 (2.24) corresponds to the c. The peak at 4 ppm corresponds to proton d. To complete the analysis of aliphatic protons, we can see that the peak to 1.65 ppm corresponds to e. Between 5 and 10 we can see the peaks corresponding to the protons of the aromatic ring. To 8.80 ppm have the h peak, peak f and g are very close and are located between 7.20 and 7.30. With this analysis we can conclude that the Ionic Liquid when subjected to certain conditions, did not suffer any changes in its structure.
However, there are still two peaks that were not analyzed, one at 3.92 and another at 1.65. Among the possible reaction products, we can say that the peak to 1.65 is water that formed in the reaction. However, nothing we can conclude on another peak because methanol would be expected to
27 3.49 [42], let's analyze this sample carbon spectrum (Annex 6), to try to understand whether it is methanol or not. In this spectrum, we can see the eight peaks of carbon that would be expected, are peaks of [bmim]+ and still a large peak at approximately 77, which corresponds to chloroform. Regarding the methanol, it was expected at 50.04, however, this peak is also observed for the ionic liquid, thus, we cannot conclude whether or not there was formation of methanol.
Analyzing the spectrum obtained in HS-GC for the Ionic Liquid after reaction 10 (Annex 7), we can see that there are 3 peaks. The highest peak, to 6.44 minutes is mostly toluene, but only, because the previous reaction also gets a peak in that area and no toluene was added. This represents 79.37% of the sample. There is another peak in common to both reactions, at 9.53 minutes. This peak is possibly methanol, but it is not yet possible to say with any certainty, so we went to the NMR analysis. Comparing the proton spectrum of reactions 9 and 10 (Figure 3.7), we can see that the peaks in common are Ionic Liquid, once again, the liquid is not decomposed under the conditions of the reaction. We can also see a few more peaks: at 3.4 ppm should be methanol, toluene at 2.36 ppm. Analyzing the carbon spectrum of reaction 10 (Annex 8), we can see the peaks of toluene and Ionic Liquid. If you increase the zoom, we can see that there is a small peak at 50, but as we have a large peak for the IL in this area, we cannot say that it is methanol.
With respect to reaction 11, comparing the proton spectrum of this reaction and reaction 9 (Figure 3.8), we see that the peaks of the ionic liquid are maintained. There are other two peaks, one can be methanol (3.25 ppm) and an unknown peak at 2.2 ppm. Analyzing the carbon spectrum (Annex 10), we see the peaks corresponding to the Ionic Liquid and to chloroform, once again we can not confirm that there was formation of methanol.
28
Figure 3.7 –ProtonNMR spectrum, reaction 9 (red) and 10 (blue).
30
4. Conclusions
In the first part of this work, we established that two materials, carbon fabric and a gold-platinum alloy are potentially interesting cathode constituents for carbon dioxide electrochemical reduction. Cyclical voltammetry at high pressures was proven to be a good technique for exploratory work in this area.
As to direct hydrogenation of CO2, heterogeneous catalysis with palladium, rhodium and ruthenium was carried out in an atmosphere of supercritical carbon dioxide and hydrogen, in a ratio of 3:1. Reactions were performed at low temperature, 140oC, at high pressure, 80 bar, during different periods of time.
Of all catalysts tested, the most active is ruthenium, followed by palladium. The yields of the reactions were 3.30% and 0.81%, respectively. For rhodium, there was no production of methane, therefore it can be said that the catalyst does not have activity under the reaction conditions.
In the reactions carried out with the impregnated catalyst, there was no production of methane because the catalyst clogs pores, creating a barrier to the mass transfer. The increased reaction time does not cause the barrier to break. Reactions were performed in batch, which means that CO2 was not available to react to all; it would be possible to increase the yield of the reaction if we had a thin layer of ionic liquid by the catalyst and a continuous flow of carbon dioxide was passing, so that the whole was available to react.
We have also homogeneous transition-metal catalyst systems based on a single ruthenium phosphine complex, with the objective of producing methanol. In relation to these catalysts we cannot reach definite conclusions about their activity for methanol production, since in all the reactions we may have reached the desired product, but the analysis results are not conclusive. It would be necessary to perform other tests, as well as use different ionic liquids.
32
5. References
[1] U. E. I. Administration, “Annual Energy Review 2009,” Washington, DC, 2010.
[2] A. E. Ashley, A. L. Thompson e D. O'Hare, “Non-Metal-Mediated Homogeneous Hydrogenation of CO2 to CH3OH,” Angewandte Chemie, vol. 48, pp. 9839 - 9843, 2009.
[3] C. o. W. G. t. t. F. A. R. o. t. IPCC, Climate Change 2007: The physycal science basis, Intergovernmental Panel on Climate Change (IPCC): Cambridge University Press, 2007.
[4] “CO2 Emissions from fuel combustion,” International Energy Agency - Statistics, 2012.
[5] I. P. o. C. Change, Carbon Dioxide Capture and Storage, B. Metz, O. Davidson, H. de Coninck, M. Loos e L. Meyer, Edits., New York: Intergovernmental Panel on Climate Change, 2005, p. 443.
[6] J. Lee, Y. Kwon, R. L. Machunda e H. J. Lee, “Electrocatalytic Recycling of CO2 and Small Organic Molecules,” Chemistry an Asian Journal, vol. 4, pp. 1516-1523, 2009.
[7] J.-N. Park e E. W. McFarland, “A highly dispersed Pd-Mg/SiO2 catalyst active for methanation of CO2,” Journal of Catalysis, vol. 266, pp. 92-97, 2009.
[8] A. Karelovic e P. Ruiz, “CO2 hydrogenation at low temperature over Rh/γ-Al2O3 catalysts: Effect of the metal particle size on catalytic performances and reaction mechanism,” Applied Catalysis B: Environmental, Vols. %1 de %2113,114, pp. 237-249, 2012.
[9] F. Solymosi, A. Erdöhelyi e M. Kocsis, “Methanation of CO2 on supported Ru catalysts,” Journal of the Chemical Society, vol. 77, pp. 1003-1012, 1981.
[10] S. Eckle, Y. Denkwitz e R. Behm, “Activity, selectivity, and adsorbed reaction intermediates/reaction side products in the selective methanation of CO in reformate gases on supported Ru catalysts,” Journal of Catalysis, vol. 269, pp. 255-268, 2010.
[11] D. L. Nobuyuki Ichikuni, S. Shimazu e T. Uematsu, “Catalytic properties of sprayed Ru/Al2O3 and promoter effects of alkali metals in CO2 hydrogenation,” Applied Catalysis A: General, vol. 172, pp. 351-358, 1998.
[12] A. Erdöhelyi, M. Pásztor e F. Solymosi, “Catalytic hydrogenation of CO2 over supported palladium,” Journal of Catalysis, vol. 98, pp. 166-177, 1986.
[13] F. Solymosi, A. Erdöhelyi e T. Bánsági, “Methanation of CO2 on supported rhodium catalyst,”
Journal of Catalysis, vol. 68, pp. 371-382, 1981.
[14] T. Iizuka, Y. Tanaka e K. Tanabe, “Hydrogenation of carbon monoxide and carbon dioxide over supported rhodium catalysts,” Journal of Molecular Catalysis, vol. 17, pp. 381-389, 1982.
[15] P. G. Jessop, T. Ikariya e R. Noyori, “Homogeneous catalytic hydrogenation of supercritical carbon dioxide,” Nature 368, pp. 231-233, 1994.
33 [17] J. Z. Zhang, Z. Li, H. Wang e C. Y. Wan, “Homogeneous catalytic synthesis of formic acid (salts) by hydrogenation of CO2 with H2 in the presence of ruthenium species,” Journal of Molecular Catalysis A: Chemical, vol. 112, p. 9–14, 1996.
[18] C.-C. Tai, J. Pitts, J. C. Linehan, A. D. Main, P. Munshi e P. G. Jessop, “In situ formation of ruthenium catalysts for the homogeneous hydrogenation of carbon dioxide,” Inorganic Chemistry, vol. 41, pp. 1606-1614, 2002.
[19] A. M. O'Mahony, D. S. Silvester, L. Aldous, C. Hardacre e R. G. Compton, “Effect of Water on the Electrochemical Windows and Potential Limits of Room-Temperature Ionic Liquids,” J. Chem. Eng., vol. 53, pp. 2884-2891, 2008.
[20] L. A. Blanchard, D. Hancut, E. J. Backman e J. F. Brennecke, “Green processing using ionic liquids and CO2,” Nature, vol. 399 (6731), pp. 28-29, 1999.
[21] H. Yang, Y. Gu, Y. Deng e F. Shi, “Electrochemical activation of carbon dioxide in ionic liquid: synthesis of cyclic carbonates at mild reaction conditions,” Chem. Commun., p. 274–275, 2002.
[22] Q. Feng, S. Liu, X. Wang e G. Jin, “Nanoporous copper incorporated platinum composites for electrocatalytic reduction of CO2 in ionic liquid BMIMBF4,” Applied Surface Science, vol. 258, pp. 5005-5009, 2012 .
[23] Z. Zhang, Y. Xie, W. Li, S. Hu, J. Song, T. Jiang e B. Han, “Hydrogenation of Carbon Dioxide is Promoted by a Task-Specific Ionic Liquid,” Angew. Chem., vol. 120, pp. 1143-1145, 2008.
[24] Y. S. Sistla, L. Jain e A. Khanna, “Validation and prediction of solubility parameters of ionic liquids for CO2 capture,” Separation and Purification Technology, vol. 97, p. 51–64, 2012.
[25] G. Zhao, T. Jiang, B. Han, Z. Li, J. Zhang, Z. Liu, J. He e W. Wu, “Electrochemical reduction of supercritical carbon dioxide in ionic liquid 1-n-butyl-3-methylimidazolium hexafluorophosphate,”
The Journal of Supercritical Fluids, vol. 32, pp. 287-291, 2004.
[26] J. L. Anderson, J. K. Dixon e J. F. Brennecke, “Solubility of CO2, CH4, C2H6, C2H4, O2, and N2 in 1-Hexyl-3-methylpyridinium Bis(trifluoromethylsulfonyl)imide: Comparison to Other Ionic Liquids,” Acc. Chem. Res., vol. 40, pp. 1208-1216, 2007.
[27] Y.-F. Hu, Z.-C. Liu, C.-M. Xu e X.-M. Zhang, “The molecular characteristics dominating the solubility of gases in ionic liquids,” Chem. Soc. Rev., vol. 40, pp. 3802-3823, 2011.
[28] N. V. Rees e R. G. Compton, “Electrochemical CO2 sequestration in ionic liquids; a perspective,”
Energy Environ. Sci, vol. 4, pp. 403-408, 2011.
[29] K. Ogura e M. Takagi, “Electrocatalytic reduction of carbon dioxide to methanol Part III. Use of an electrochemical photocell,” Journal of Electroanalytical Chemistry and Interfacial Electrochemistry, vol. 201, pp. 359-365, 1986.
[30] A. Naitoh, K. Ohta, T. Mizuno, H. Yoshida e M. Saka, “Electrochemical reduction of carbon dioxide in methanol at low temperature,” Electrochimica Acta, vol. 38, pp. 2177-2179, 1993.
![Figure 1.2 – CO 2 capture systems. Adapted from [5].](https://thumb-eu.123doks.com/thumbv2/123dok_br/16473162.731788/22.892.92.831.322.751/figure-capture-systems-adapted.webp)
![Figure 1.3 – Reaction products and intermediates for CO 2 reduction reactions. Adapted from [6]](https://thumb-eu.123doks.com/thumbv2/123dok_br/16473162.731788/24.892.267.621.703.904/figure-reaction-products-intermediates-reduction-reactions-adapted.webp)