1. Bauru Integrated College – Cepaf, Bauru, SP.
2. Mato Grosso do Sul Federal University – UFMS, Campo Grande, MS. 3. Biodynamics Laboratory, IB, Unesp, Rio Claro, SP.
4. Laboratory for Instrumentation in Exercise Physiology, Unicamp, Campi-nas, SP.
5. Laboratory for Movement Studies, IB, Unesp, Rio Claro, SP.
Received in 15/10/04. 2nd version received in 27/12/04. Approved in 11/2/05. Correspondence to: Claudio Alexandre Gobatto, Universidade Estadual Paulista (Unesp), Instituto de Biociências, Departamento de Educação Físi-ca, Av. 24a, 1.515, Bela Vista – 13500-230 – Rio Claro, SP. E-mail: mpapoti @yahoo.com.br
Use of the y-intercept in the evaluation of the anaerobic
fitness and performance prediction of trained swimmers
Marcelo Papoti1,3, Alessandro Moura Zagatto2,3, Paulo Barbosa de Freitas Júnior5,
Sergio Augusto Cunha3, Luiz Eduardo Barreto Martins4 and Claudio Alexandre Gobatto3
O
RIGINALA
RTICLEKey words: Swimming anaerobic capacity. Anaerobic fitness. Tied swimming. Critical velocity. Performance. Lactate.
ENGLISH VERSION
ABSTRACT
The objective of this study was to verify the use of y-intercept from the critical velocity model in the evaluation of the anaerobic fitness and prediction of maximal performance in trained swim-mers in crawl style. Fourteen swimswim-mers with ages ranging from 15 to 18 years participated in this study. The athletes performed the tied swimming test, maximal performances tests and critical velocity (CV) for the determination of anaerobic swimming capac-ity (AWC). 1) The tied swimming test was applied through maxi-mal effort during 30 seconds fixed to the equipment with load cells for the measurement of the peak force, anaerobic fitness and peak lactate. 2) The subjects also performed maximal performances at distances of 100, 200, 300, 400 and 600 meters with two hours interval between each swim. 3) AWC at CV model was determined utilizing all possible combinations by maximal performances apply-ing the distance-time linear regression model. The AWC value ob-tained was of 25.07 ± 4.22 m, with linear regression coefficient between 0.99 and 1.00, and linear coefficient error of 19.30 ± 5.9%. AWC was not correlated with all maximal performances, peak force (227.81 ± 63.02 N), anaerobic fitness (85.55 ± 13.05 N), and peak lactate (6.80 ± 1.08 mM). However, the anaerobic fitness was cor-related with all maximal performances. Thus, it was concluded that the AWC obtained by y-intercept of the distance/time of swim re-lation does not seem to be a good parameter for the anaerobic fitness evaluation neither to predict the maximal performances between 100 and 600 meters in crawl style.
INTRODUCTION
In swimming, the methods used to measure anaerobic variables are not quite well developed such as those that evaluate the aero-bic qualities, although these variables are important aspects for the swimmer evolution(1). Maglischo(2) suggested the
determina-tion of the blood lactate concentradetermina-tion after maximal efforts as a way to evaluate the anaerobic capacity, where low lactate values along with unsatisfactory performances could indicate deteriora-tion of this capacity. Although the use of the lactacidemia is a tool sensible to small adaptations in the swimmers training(3), its
reduc-tion after maximal efforts may also be a result of an overtraining state(4-7). Methodologies that evaluate the strength of swimmers
out of the water through the use of the swim bench(8) and in the
water through semi tied swim(9) and tied swim(10-12) situations are
also frequent. The latter, besides presenting higher specificity when compared with the swim bench, is a reproducible ergometer(11,13),
highly correlated with the swim velocity at distances between 25 and 400 m in crawl style(10,11), and sensible to variations on the
training volume and intensity(12,14).
Unfortunately, not all swimming teams count on the financial support required for the acquisition of specific equipment for strength and power measurement or for the performance of con-stant evaluations using lactacidemia.
The critical power test, initially proposed by Monod and Scher-rer(15) and validated by Moritani et al.(16), has as concept the
maxi-mal exercise intensity that can theoretically be maintained for a long period of time with no fatigue. This evaluation method has been objective of many studies, not only for being a low-cost non invasive test, but also for providing indicatives of aerobic and anaer-obic capacities.
Wakayoshi et al.(17) linearized the hyperbolic equation applied in
the prediction of the critical power and verified whether the critical velocity (CV) may be used to estimate the performance of high-level swimmers. In this study for the CV and the anaerobic swim-ming capacity (AWC) determination, the swimmers were submit-ted to six efforts until exhaustion in the swimming flume. The six points obtained from the relation between the limit time (Tlim) and the swim distance (SD) were submitted to linear regression proce-dure, where the angular coefficient represented the CV and the linear coefficient (y-intercept) represented the AWC. The authors observed high correlation of CV with lactate threshold for concen-tration of 4 mM (r = 0.95) with the oxygen uptake at the anaerobic threshold intensity (r = 0.82) and with maximal velocity of 400 m (r = 0.86). Later, these authors made available and popular the use of the CV by determining this parameter in conventional swimming pool using the linear relation between prefixed distance (200 m and 400 m) and swim time(18).
As previously mentioned, the AWC, represented by the linear coefficient (y-intercept), when determined with stimuli in which the participants perform efforts until exhaustion, seems to corre-spond to the anaerobic variable of the CV model. It has been dem-onstrated that this parameter is sensible to eight high-intensity train-ing weeks with intervals(19) and to six endurance training weeks(20).
Furthermore, the AWC was significantly correlated with the Win-gate test(21), anaerobic production of muscular ATP (r = 0.70),
anaer-obic capacity determined through the ATP change and phospho-creatine (r = 0.73) in well-trained cyclists(22), and with the maximal
accumulated oxygen deficit (MAOD), demonstrating that the y-in-tercept may be a valid index to represent the anaerobic work ca-pacity(22,23).
However, other studies did not demonstrate association between AWC with MAOD(24), and the Wingate test average power(25). In
asso-ciation between AWC and performance(26-28), thus emphasizing the
necessity of researches aimed at investigating the meaning of the AWC as performance predictor in swimming. Thus, the objective of the present study was to verify the use of the y-intercept in the evaluation of the anaerobic fitness and in the performance predic-tion of trained swimmers.
METHODOLOGY
Participants
Fourteen state and national level swimmers (three female and 11 male) from the city of Bauru-SP with ages ranging from 15 to 18 years and minimum swimming competition time of two years, who trained approximately 5000 m.d-1 with frequency of six days.week-1
were evaluated. The participants were only confirmed after autho-rization through the consent form, approved by the Unesp Ethics Committee, campus of Rio Claro, signed by parents and team coach-es.
Tests
The swimmers were evaluated during three days, when the anaerobic fitness and maximal performances tests were conduct-ed.
No exercises of any type were performed during the 24 hours preceding the tests. This caution was taken so that no acute effect as result of training sessions could influence the results.
Before the beginning of tests, a warm-up period with duration of ten minutes at moderate intensity subjectively determined by swimmers in crawl style was performed.
Determination of anaerobic fitness (FITANA), peak force (Fpeak) and lactate peak concentration ([la-]
peak) in tied swim
For the anaerobic fitness determination (FITANA), a tied swim pro-tocol standardized by Papoti et al.(11) was used due to the high
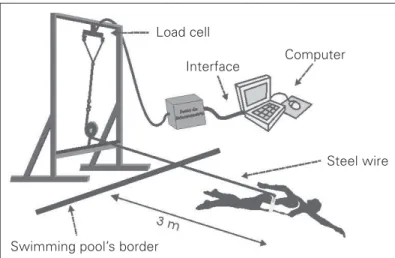
stability and reproducibility of measurements (r = 0.93). This sys-tem contains load cells (strain gages) as primary sensor element, being suspended on two wooden beams fixed to the ground at a distance of one meter parallel to the border of the swimming pool. A steel wire of 4.08 m length was connected to the center of the dynamometer with a nylon belt at its opposite extremity around the swimmer’s waist at a distance of three meters in relation to the border of the swimming pool and four meters in relation to the equipment (figure 1).
ginning and end of the test were determined by a sound signal (whistle). The deformation detected by the load cells (strain gages) due to the tension generated by the swimmer’s effort was ampli-fied through a portable extensometry source (Sodmex ME-01D). The values obtained during efforts were sent to a computer by an interface and stored in the Lab View data acquisition at 400 Hz. The values were submitted to the residual analysis process and soothed using the fourth order “butterworth” filter with frequency of three hertz (Hz). The 400 initial points were disregarded so that the peak force values (Fpeak) were not overestimated in function of the transition from moderate swim to intense swim(11,29).
With the use of the calibration straight line (obtained through the superposition of known weights), the values obtained were converted into force units (N) through the Matlab 5.3 program, thus enabling the determination of peak force (Fpeak) and average force (AFNA). Fpeak was determined as the average of the five highest values during the test. AFNA was considered as indicative of anaer-obic fitness (FITANA)(11). One, three and five minutes after FIT
ANA
test, blood samples were collected from the ear lobe (25 µL),
dilut-ed into 50 µL of NaF 1% and analyzed in electrochemical
lactime-ter (YSI model Sport 1500, Yellow Spring Co., USA) for lactate peak concentration determination ([la-]
peak).
Determination of anaerobic swimming capacity (AWC) and maximal performances (PMAX)
For the determination of the maximal performance (PMAX), five maximal efforts randomly established at distances of 100 m, 200 m, 300 m, 400 m and 600 m in crawl style were performed in 25 m swimming pools at temperature of 27 ± 1oC with a minimum rest
period of two hours.
The distance and time values were submitted to linear regres-sion procedure for the estimation of AWCs (distance-time model), where the linear coefficient (y-intercept) of each individual regres-sion represented the anaerobic swimming capacities (AWCs) (fig-ure 2).
Fig. 1 – Schematic model of the system used to determine anaerobic fit-ness of swimmers(11)
Load cell
Interface Computer
Steel wire
Swimming pool’s border
The test itself consisted of the application of a maximum effort in crawl style with duration of 30 s with swimmers tied to the measurement apparatus. During the entire test, the participants were verbally encouraged to perform maximum efforts. The
be-Fig. 2 – Representative model of anaerobic swimming capacity determina-tion (AWC) through the linear regression model between distance and time
Distance (m)
Time (s)
Distance = CV x time + AWC
Angular coefficient (CV) y-intercept
(AWC)
Using all possible combinations with number of points ranging from three to five, besides the AWC originated from protocol pro-posed by Wakayoshi et al.(18), which only uses distances of 200 m
and 400 m, 16 AWCs were obtained (AWC12346, AWC1234, AWC1246, AWC1346, AWC123, AWC124, AWC126, AWC134, AWC136, AWC146, AWC234, AWC236, AWC2346, AWC246, AWC346 and AWC24).
Statistical treatment
Values are presented as average + standard deviation. The one-way analysis of variance (ANOVA) was used with post hoc New-man Keuls test if necessary for all AWC obtained in this study. The relations between AWCs with Fpeak, FitANA, [la-]
peak and
performanc-es (P100, P200, P300, P400 and P600), as well as the crossing between Fpeak, FitANA, [la-]
peak and performances were obtained from the
Pear-son correlation analysis. In all cases, the significance level adopted was of 5%.
With the use of the Origin 6.0 program, the linear coefficient errors (LCE) for the AWCs obtained from three to six velocities, called by Hill et al.(32) as estimation standard error.
RESULTS
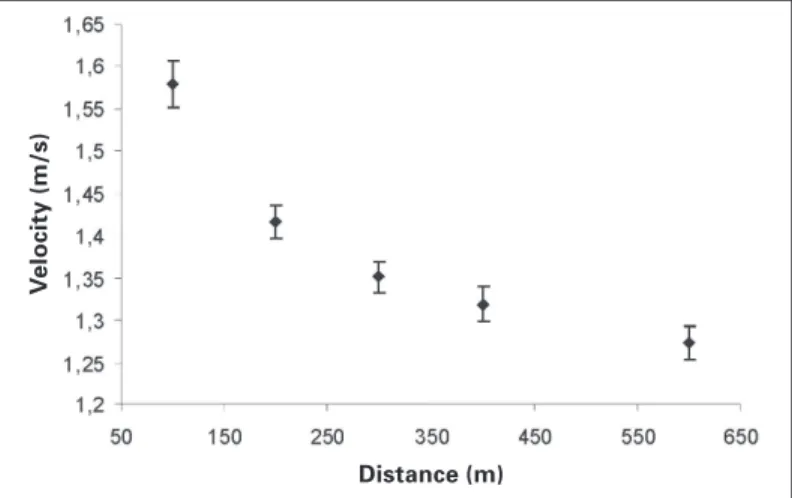
Figure 3 presents the performance values (m.s-1) used for the
determination of the anaerobic swimming capacities, while table 1 presents the values of Fpeak, FitANA, [la-]
peak, respectively.
Fig. 3 – Average values + standard deviation of velocity obtained during the performance of maximal efforts at distances of 100 m, 200 m, 300 m, 400 m and 600 m in crawl style
V
elocity (m/s)
Distance (m)
TABLE 1
Average values ± standard deviation of the peak force (Fpeak), anaerobic fitness (FitANA) and peak lactate concentration [la-]peak
after 30-second maximal effort
Fpeak (N) FitANA (N) [la-]peak (mM)
227.81 ± 63.02 86.55 ± 13.05 6.80 ± 1.03
TABLE 2
Pearson correlation coefficient (r) of anaerobic swimming capacities (AWCs) with maximal performances (m.s-1) at distances of 100 m,
200 m, 300 m, 400 m and 600 m, and with the peak force (Fpeak), anaerobic fitness (FitANA) and peak lactate concentration [la-]peak
AWCs P100 P200 P300 P400 P600 Fpeak FitANA [la-]peak
AWC12346 0.00 –0.16 –0.28 –0.47 –0.54 0.16 0.30 0.37
AWC1234 0.02 –0.11 –0.20 –0.51 –0.45 0.23 0.14 0.48
AWC1246 0.04 –0.14 –0.30 –0.41 –0.52 0.13 0.35 0.37
AWC1346 –0.03 –0.19 –0.31 –0.48 –0.56 0.12 0.27 0.35
AWC123 0.12 –0.06 –0.29 –0.22 –0.34 0.04 0.33 0.35
AWC124 0.01 –0.13 –0.22 –0.53 –0.47 0.22 0.13 0.50
AWC126 0.03 –0.13 –0.29 –0.45 –0.52 0.16 0.32 0.41
AWC134 –0.01 –0.14 –0.21 –0.54 –0.47 0.21 0.08 0.46
AWC136 –0.04 –0.19 –0.29 –0.52 –0.56 0.16 0.22 0.39
AWC146 0.01 –0.17 –0.34 –0.50 0.03 0.03 0.35 0.28
AWC234 0.02 –0.08 –0.13 –0.49 –0.39 0.27 0.10 0.45
AWC236 –0.00 –0.14 –0.24 –0.48 –0.52 0.20 0.29 0.38
AWC2346 –0.02 –0.16 –0.27 –0.47 –0.53 0.18 0.31 0.37
AWC246 0.06 –0.09 –0.26 –0.33 –0.47 0.13 0.42 0.31
AWC346 –0.06 –0.18 –0.25 –0.41 –0.51 0.11 0.29 0.23
AWC24 0.03 –0.08 –0.16 –0.49 –0.41 0.27 0.15 0.49
No significant correlations were observed between AWCs and maximal performances or between AWCs and Fpeak, FitANA and [la-]
peak
(table 2). Fpeak and [la-]
peak did not present significant correlation with
PMAX either. However, FitANA was significantly correlated with all PMAX (table 3).
The relation between distance and swimming time seems to be highly linear with determination coefficient (r2) ranging from 0.99
to 1.00. Average AWC and LCE values of 25.07 ± 4.22 m and 19.30 ± 5.9%, respectively, were observed, so that only AWC236 presented error below 10% (8.86%). Significant differences between AWCs (P < 0.05) were observed. However, these values were highly cor-related (r ≅ 0.80).
TABLE 3
Pearson correlation coefficient (r) of peak force (Fpeak), anaerobic fitness (FitANA) and peak lactate concentration [la-]
peak with maximal performances (m.s-1) at distances of 100 m (P
100), 200 m (P200), 300 m (P300), 400 m (P400) and 600 m (P600) in crawl style
P100 P200 P300 P400 P600
Fpeak (N) –0.63* –0.56* 0.53* –0.38* –0.41*
FitANA (N) –0.78* –0.82* 0.75* –0.74* –0.70*
[la-]
peak (mM) –0.22* –0.21* 0.29* –0.36* –0.33*
* Indicates significant correlation for P < 0.05.
DISCUSSION
The main finding of the present study was that the AWC pre-sented no significant correlation with anaerobic fitness and swim-mers performance. Experimental and literature review studies have demonstrated significant associations between AWC and the Win-gate test(16,21,23), the total accumulated intermittent work(19) and the
muscular ATP production(22), besides demonstrating the significant
AWC contribution to the performance in running above eight km(31).
It was yet demonstrated that the AWC is a reproducible and sensi-ble parameter(23) to the effects of enduring(20), intense(19) training,
and to the creatine supplementation(32), emphasizing the
possibili-ty of this parameter being used as indirect measurement in the evaluation and prediction of anaerobic performances(22,30,33).
It is interesting to observe that the AWC values in the present study, unlike most investigations previously mentioned, present-ed no significant correlations with any of the maximal performanc-es and anaerobic fitnperformanc-ess tperformanc-est that used the same duration time as the Wingate test.
Guglielmo and Denadai(34) found no correlations between AWC
of swimmers with the average power determined during 30-sec-ond maximal efforts in isokinetic arm ergometer. Papoti et al.(27)
used a tied swim system and verified significant correlation be-tween average force (FNA) during 30-second maximal efforts and performances of 100 m and 200 m in crawl style, but not between FNA and AWC obtained through the y-intercept of the distance x time linear relation using distances of 200 m and 400 m, proposed by Wakayoshi et al.(18). In the present investigation, the FNA,
as-sumed by Papoti et al.(11) as Fit
ANA indicative, was also significantly
correlated with performances between 100 m and 600 m in crawl style.
Soares et al.(35) found no significant correlations between AWC
(determined through the relation obtained between the prefixed distance and the swimming time) and the average power in swim bench during 45-second maximal effort in children and adult swim-mers. Those authors concluded that the AWC provides no consis-tent information on the anaerobic capacity of swimmers, regard-less the age range considered.
Dekerle et al.(26) also verified no significant correlation between
AWC and the maximal anaerobic distance in swimmers, which was considered as the distance in which the swimming maximal veloc-ity may be maintained, and suggested the non utilization of this parameter to control anaerobic variables.
A possible explanation for the contradiction observed in litera-ture with regard to the use of AWC as parameter for the prediction of anaerobic performances(19-21,32) may be that the relation used for
the linear regression procedure considers the limit time (Tlim). The fixed-distance model proposed by Wakayoshi et al.(18) considers in
swim-ming velocity imposed during efforts at any distance above the prefixed distance (200 m and 400 m). This hypothesis seems to limit the use of this model, considering the anaerobic aspect only, once some swimmers are capable to support the swimming ve-locity obtained at distances of 200 m and 400 m for a few more meters, probably due to the lactate tolerance capacity.
Green(33) verified that the higher accuracy on the AWC
determi-nation of well-trained cyclists was obtained when the exhaustion criterion for the attainment of limit times was extended until the intensity corresponding to the VO2 peak rather than the
impossibil-ity of maintaining a prefixed rhythm (90 rpm). The author believes that this criterion enables maximizing the use of substrates gener-ally used in the performance of anaerobic exercises and, hence, the attainment of more accurate AWC values.
Toussaint et al.(28) investigated whether the concepts of critical
power and AWC could be used to evaluate the aerobic and anaer-obic capacities of swimmers. To do so, the authors developed a mathematical model related to the mechanics and energetics in-volved in the crawl style, based on previous studies and evalua-tions performed in the swimming flume. The authors also mod-eled the release of aerobic and anaerobic energy in relation to the swimming time. The authors concluded that, although the critical velocity is an indicative of the aerobic system, the AWC is influ-enced by variations of energy from both the aerobic and anaerobic systems, thus providing no actual estimation of the anaerobic ca-pacity. Furthermore, the results found in literature on its reproduc-ibility range from r = 0.62(36) to r = 0.87(23).
Other hypothesis to explain the non representativeness of AWC as performance predictive parameter of swimmers is the great fluc-tuation on the y-intercept values to small variations on the swim-ming velocity. In addition, Bishop and Jenkins(20) found high
nega-tive correlation (r = –0.94) between alterations on the critical power (CP) and on AWC after six weeks of endurance training. These
authors believe that a great change on CP or AWC may influence both variables due to the rotative effect of the mathematical mod-el emphasizing a limitation to the linear modmod-el to determine the critical power and AWC.
Hill et al.(32) reported that the AWC is a parameter sensible to
measure the anaerobic capacity only when this one presents a linear coefficient standard error below 10%. In the present study, the average of the linear coefficient errors remained between 9% and 29%. Only the AWC determined with distances of 200 m, 300 m and 600 m presented error below 10% (9%). However, this AWC presented no correlation with FitANA and performance. Bullbulian et al.(25) found no associations and significant relation between AWC
and the anaerobic capacity in the Wingate test (r = 0.07), and very low when corrected by the body weight (r = 0.41), and suggested that AWC could not be an indicative of the glycolytic anaerobic via. Although more researches comparing AWC with validated anaero-bic evaluation methods are required as, for instance, the oxygen maximal deficit accumulated, one may conclude that the AWC rep-resented by the y-intercept of the distance x swimming time rela-tion does not seem a good parameter in the evaluarela-tion of the anaer-obic fitness and in the performance prediction between 100 m and 600 m in crawl style.
ACKNOWLEDGMENTS
The authors would like to thank technicians André Barbosa and Oscar Fleury from the Bauru Lusitanian-Brazilian Association for the important aid in the performance of this study.
Fapesp (process-01/08295-2) and CNPq (process-130841/2003-0).
All the authors declared there is not any potential conflict of inter-ests regarding this article.
REFERENCES
1. Smith DJ, Norris RS, Hogg MJ. Performance evaluation of swimmers: scientific tools. Sports Med 2002;32:539-54.
2. Maglischo EW. Nadando ainda mais rápido. São Paulo, SP: Manole, 1999. 3. Pyne BD, Lee HE, Swanwick KM. Monitoring the lactate threshold in
world-ranked swimmers. Med Sci Sports Exerc 2001;33:291-7.
4. Fry RW, Morton AR, Garcia-Webb P, Crawford GPM, Keast D. Psychological and immunological correlates of acute overtraining. Br J Sports Med 1994;28:241-6. 5. Jeukendrup AE, Hesselink MK. Overtraining – What do lactate curves tell us? Br
J Sports Med 1994;28:239-40.
6. Snyder AC, Jeukendrup AE, Hesselink MKC, Kuipers H, Foster CA... A physiolog-ical/psychological indicator of over-reaching during intensive training. Int J Sports Med 1993;14:29-32.
7. Lehmann M, Baumgart P, Wiesenack C. Training overtraining: influence of a de-fined increase in training volume vs training intensity on performance, catechola-mines and some metabolic parameters in experienced middle and long-distance runners. Eur J Appl Physiol 1992;64:169-77.
8. Sharp RL, Troup JP, Costill DL. Relationship between power and sprint freestyle swimming. Med Sci Sports Exerc 1982;14:53-6.
9. Costill DI, Reifield F, Kirwan J, Thomas R. A computer based system for the measurement of force and power during front crawl swimming. J Swim Res 1986;2:16-9.
10. Marinho PC, Andries Jr O. Avaliação da força propulsora do nadador: validação e reprodutibilidade de uma metodologia específica. Rev Bras Ciên e Mov (Supl) 2001:79.
11. Papoti M, Martins L, Cunha S, Zagatto A, Gobatto C. Padronização de um proto-colo específico para determinação da aptidão anaeróbia de nadadores utilizando célula de carga. Revista Portuguesa de Ciências do Desporto 2003;3:36-42. 12. Raglin JS, Koceja DM, Stanger JM, Harms CA. Mood, neuromuscular function,
and performance during training in female swimmers. Med Sci Sports Exerc 1996;28:372-7.
13. Hooper SL, Mackinnon IT, Ginn EM. Effects of three tapering techniques on the performances, forces and psychometric measures of competitive swimmers. Eur J Appl Physiol 1998;78:258-63.
14. Papoti M, Martins LEB, Cunha SA, Freitas Jr PB, Gobatto C. Effects of taper on
swimming force and performance after a 10-wk training program. 7th Annual
Congress of the European College of Sport Science, 2002;470.
15. Monod H, Scherrer J. The work capacity of a synergic muscular group. Ergo-nomics 1965;8:329-37.
16. Moritani T, Nagata A, DeVries HA, Muro M. Critical power as a measure of phys-ical work capacity and anaerobic threshold. Ergonomics 1981;24:339-50. 17. Wakayoshi K, Ikuta K, Yoshida T, Udo M, Moritani T, Mutoh Y, et al.
Determina-tion and validity of critical velocity as an index of swimming performance in the competitive swimmer. Eur J Appl Physiol 1992;64:153-7.
18. Wakayoshi K, Yoshida T, Udo M, Harada T, Moritani T, Mutoh Y, et al. Does critical swimming velocity represent exercise intensity at maximal lactate steady state? Eur J Appl Physiol 1993;66:90-5.
19. Jenkins DG, Quigley BM. The influence of high-intensity exercise on the Wlim-Tlim relationship. Med Sci Sports Exerc 1993;25:275-82.
20. Bishop D, Jenkins DG. The influence of resistance training on the critical power function & time to fatigue at critical power. Aust J Sci Med Sport 1996;28:101-5. 21. Jenkins DG, Quigley BM. The y-intercept of the critical power function as a
measure of anaerobic work capacity. Ergonomics 1991;31:1413-9.
22. Green S, Dawson BT, Goodman, C, Carey MF. Y-intercept of the maximal work-duration relationship and anaerobic capacity in cyclists. Eur J Appl Physiol 1994; 69:550-6.
23. Nebelsick-Gullett LJ, Housh TJ, Johnson GO, Bauge SM. A comparison between methods of measuring anaerobic work capacity. Ergonomics 1988;31:1413-9.
24. Berthoin S, Baquet G, Dupont G, Blondel N, Mucci P. Critical velocity and anaer-obic distance capacity in prepuberal children. Can J Appl Physiol 2003;28:561-75.
25. Bulbulian R, Jeong JW, Murphy M. Comparison of anaerobic components of the Wingate and critical power tests in males and females. Med Sci Sports Exerc 1996;28:1336-41.
27. Papoti M, Martins LEB, Cunha AS, Zagatto AM, Pereira RR, Gobatto CA. Valida-de na Valida-determinação das capacidaValida-des aeróbia e anaeróbia Valida-de nadadores. Motriz 2003;9:56.
28. Toussaint HM, Wakayoshi K, Hollander PA, Ogita F. Simulated front crawl swim-ming performance related to critical speed and critical power. Med Sci Sports Exerc 1998;30:144-51.
29. Trappe S, Costill D, Thomas R. Effect of swim taper on whole muscle and single muscle fiber contractile properties. Med Sci Sports Exerc 2001;32:48-56.
30. Hill DW, Jimmy C, Smith C. A method to ensure the accuracy of estimates of anaerobic capacity derived using the critical power concept. J Sports Med Phys Fit 1994;34:23-37.
31. Bulbulian R, Wilcox AR, Darabos BI. Anaerobic contribution to distance running performance of trained cross-country athletes. Med Sci Sports Exerc 1986;18: 107-13.
32. Smith JC, Stephens DP, Hall EL, Jackson AW, Earnest CP. Effect of oral creatine ingestion on parameters of the work rate-time relationship an time to exhaus-tion in high-intensity cycling. Eur J Appl Physiol 1998;77:360-5.
33. Green S. Measurement of anaerobic work capacities in humans. Sports Med 1995;19:32-42. Review.
34. Guglielmo LGA, Denadai BS. Correlação do teste de Wingate de braço com a capacidade de trabalho anaeróbio determinada através do conceito de velocida-de crítica na natação. Motriz (Suplemento) 1999;5:92.
35. Soares S, Vilar S, Bernardo C, Campos A, Fernandes R, Vilas-Boas JP. Using data from the critical velocity regression line for the estimation of anaerobic capacity in infant and adult swimmers. Revista Portuguesa de Ciências do Despor-to 2003;3:108-10.