w w w . r e u m a t o l o g i a . c o m . b r
REVISTA
BRASILEIRA
DE
REUMATOLOGIA
Original
article
Association
between
body
mass
index
and
osteoporosis
in
women
from
northwestern
Rio
Grande
do
Sul
夽
Letícia
Mazocco
a,
Patrícia
Chagas
a,b,∗aUniversidadeFederaldeSantaMaria(UFSM),ProgramadePós-Graduac¸ãoemGerontologia,SantaMaria,RS,Brazil bUniversidadeFederaldeSantaMaria(UFSM),DepartamentodeAlimentoseNutricão,PalmeiradasMissões,RS,Brazil
a
r
t
i
c
l
e
i
n
f
o
Articlehistory:
Received25August2014 Accepted23July2016
Availableonline9November2016
Keywords: Osteoporosis Bodymassindex Women
Bonemineraldensity
a
b
s
t
r
a
c
t
Objective:Toinvestigatetheassociationbetweenbodymassindex(BMI)andbonemineral density(BMD)inpostmenopausalwomen.
Methods:Observationalstudywithpostmenopausalwomenwhounderwentbone densito-metryinPalmeiradasMissões–RS.Sociodemographicdata,riskforosteoporosisandfood intakewereassessedthroughaspecificform.BMIwascalculatedaccordingtoWHO crite-ria.TheassessmentofBMDwasperformedbydual-energyX-rayabsorptiometry(DXA)and classifiedaccordingtoWHO.Statisticalanalysiswasperformedusingprevalenceratios(PR) andtheirrespective95%confidenceintervalsforthefactorsstudied.Variablesassociated withp<0.20withthedifferentoutcomes(osteopeniaandosteoporosis)wereincludedina Poissonregressionmodelwithrobustvariancetoadjustforpotentialconfoundingfactors. A5%significancelevelwasconsidered.
Results:393postmenopausalwomenwithameanageof59.6±8.2yearsparticipated. Aftertheadjustments,thenormalweightwomenhad1.2timestheprevalenceof osteope-niaofobesewomen(PR=1.2;CI95%1.3–1.5).Consideringosteoporosis,thePRofeuthophic womenwastwicethePRofobesewomen(PR=2;CI95%1.4–2.9)andwas1.7timesgreater foroverweightgroupcomparedtoobesecategory(PR=1.7;CI95%1.2–2.5).
Conclusion: Obesewomenhadlowerprevalenceofosteopeniacomparedwithnormalweight subjectsandalsowithlowerprevalenceofosteoporosisascomparedtonormal-and over-weightwomen.
©2016PublishedbyElsevierEditoraLtda.ThisisanopenaccessarticleundertheCC BY-NC-NDlicense(http://creativecommons.org/licenses/by-nc-nd/4.0/).
夽
StudyconductedwithFundodeIncentivoàPesquisa(FIPE),UniversidadeFederaldeSantaMaria(UFSM)support,SantaMaria,RS, Brazil.
∗ Correspondingauthor.
E-mail:[email protected](P.Chagas). http://dx.doi.org/10.1016/j.rbre.2016.10.002
Associac¸ão
entre
o
índice
de
massa
corporal
e
osteoporose
em
mulheres
da
região
noroeste
do
Rio
Grande
do
Sul
Palavras-chave: Osteoporose
Índicedemassacorporal Mulheres
Densidademineralóssea
r
e
s
u
m
o
Objetivo:Verificaraassociac¸ãoentreoíndicedemassacorporal(IMC)eadensidademineral óssea(DMO)emmulherespós-menopáusicas.
Métodos: Estudoobservacional, commulherespós-menopáusicassubmetidas à densit-ometria ósseaem PalmeiradasMissões(RS).Dadossociodemográficos,de riscoparaa osteoporoseedoconsumoalimentarforamavaliadospormeiodeformulárioespecífico. OIMCfoicalculadodeacordocomaOrganizac¸ãoMundialdeSaúde(OMS).Aavaliac¸ãoda DMOfoifeitapormeiodeabsorciometriaporduplaemissãoderaios-X(DXA)eclassificada deacordocomaOMS.Aanáliseestatísticafoifeitapormeioderazõesdeprevalência(RP)e osseusrespectivosintervalosde95%deconfianc¸aparaosfatoresemestudo.Variáveisque seassociaramcomp<0,20comosdiferentesdesfechos(osteopeniaeosteoporose)foram incluídasemummodeloderegressãodePoissoncomvariânciarobustaparaajustepara potenciaisfatoresdeconfusão.Foiconsideradoumníveldesignificânciade5%.
Resultados: Participaram393mulherespós-menopáusicas,commédiade59,6±8,2anos. Apósosajustes,asmulhereseutróficasapresentaram1,2vezaprevalênciadeosteopenia dasmulheresobesas(RP=1,2;IC95%1,3-1,5).Eemrelac¸ãoàosteoporose,nogrupodas eutróficasaRPfoiduasvezesaRPdasobesas(RP=2;IC95%1,4-2,9)e1,7nogrupocom sobrepesoemrelac¸ãoàcategoriaobesidade(RP=1,7;IC95%1,2-2,5).
Conclusões: As mulheres obesas apresentaram menor prevalência de osteopenia em comparac¸ãocomaseutróficas,bemcomotiverammenorprevalênciadeosteoporoseem comparac¸ãocomasmulhereseutróficasecomsobrepeso.
©2016PublicadoporElsevierEditoraLtda.Este ´eumartigoOpenAccesssobuma licenc¸aCCBY-NC-ND(http://creativecommons.org/licenses/by-nc-nd/4.0/).
Introduction
Osteoporosisisabonemetabolicdisorderthatischaracterized byreducedbonemineraldensity(BMD),withdeteriorationof bonemicroarchitecture,leadingtoincreasedskeletalfragility andriskoffracture.1Osteoporosisisthemostcommonbone
diseaseinhumansandisbeingconsideredasoneofthemajor publichealthproblemsworldwide,duetoanincreaseinlife expectancyofthepopulationandtothehighrateofmorbidity andmortalityrelatedtofractures,especiallythoseinthehip.2
InBrazil,itisestimatedthatthereareapproximately10 mil-lionpeoplewithosteoporosis,3 affectingindividualsofboth
gendersandallraces,anditsprevalenceincreasesasthe pop-ulationages.4About25%ofpost-menopausalwomenand15%
ofmenover50areaffectedbythedisease.3
According to the Ministry of Health of Brazil, in 2012 about1.6millionfracturesfromosteoporosiswereregistered.3
Fractures, especially in the hip, are associated with falls, regardlessofbonedensity,5andultimatelyreducethequality
oflife.6 Eachyear,theUnifiedHealthSystem(SUS)inBrazil
has shown increasing costs of fracture treatment in older people.Onlyin2009R$57,610,000.00werespentwith admis-sions and R$24,770,000.00 with drugs for the treatment of osteoporosis.3
AmongthedeterminantsofBMD,onecanfindgenetic fac-tors(familyhistoryoffractureandosteoporosisinfirst-degree relatives),advancedage,whiteandorientalrace,andchronic estrogendeprivation– andall ofthesevariables cannotbe modified.7 But in fact, there are modifiable factors: eating
habits, sedentarylifestyle,bodycomposition,smoking, pro-longedcorticosteroidtherapy,excessiveintakeofalcoholand coffee,andlowsunlightexposure.7,8
Bonedensityisthemainmeasurabledeterminantofrisk ofoccurrenceofafragilityfracture9whereinlowerbodymass
index(BMI)isassociatedwithasubstantiallyincreasedrisk offractures.10Thisstudyaimstoinvestigatetheassociation
betweenBMIandBMDinasampleofpostmenopausalwomen
undergoingbonedensitometryinPalmeiradasMissões–RS.
Materials
and
methods
We conducted an observational study of postmenopausal
womenwhounderwentbonedensitometryinaclinic special-izinginimagingdiagnosticofthecityofPalmeiradasMissões –RSbetweenOctober2012andDecember2013.
Thesampleconsistedof393womenwhoagreedto partic-ipateinthestudyandsignedaninformedconsent.
Socio-demographic data (age, marital status, education, andoccupation)andriskfactorsforlowBMD(smoking, seden-tarylifestyle,andconsumptionofcertainfoods:milk,yogurt, cheese,alcoholandcoffee)wereevaluatedbyusinga stan-dardizedquestionnaire.Inthissample,womenwhodidnot performexercisewereclassifiedassedentarysubjects.
The anthropometric parameters assessed were weight,
height, and BMI. Weight was measured using a calibrated
anthropometric scale,with the barefooted patient wearing
a hospital gown for the measurement. Height was
scale, with the woman in an upright position, with arms
hanging along the body and with heels together. BMIwas
calculated by applying the Quetelét equation, that is, the divisionofweight(kg)byheight(m)squared.Forthe classi-ficationofnutritionalstatus,theWHO’sreferencewasused11:
underweight: ≤18.5kg/m2, normal weight: 18.5–24.9kg/m2,
overweight:25.0–29.9kg/m2,obesity:≥30.0kg/m2.
TheassessmentofBMDwasperformedbydual-energy
X-rayabsorptiometry(DXA).Thedensitometricmeasurements
oflumbarspine,femoralneckandtotalfemurwereevaluated withtheuseofaGELunarDPX-NT150951device.Thevalues foundwere classified according to the World Health Orga-nization(WHO)inT-score≤(−2.5):osteoporosis,andT-score between(−1.01)and(−2.49):osteopenia.12Thebone
densito-metryresultsarepresentedusingtheabsolutevaluesofBMD (g/cm2).
Data were entered in Excel and exported to the SPSS
software, version 18, for subsequent statistical analysis.
Quantitative variables were described as mean±standard
deviation, and categoricalvariables were described as fre-quencies and percentages. Prevalence ratios (PR) and their respective95% confidence intervals forthe factors studied werecalculated.Variablesassociatedwithp<0.20and with
the outcomes studied (osteopenia and osteoporosis) were
includedinaPoissonregressionmodelwitharobustvariance toadjustmentforpotentialconfounders. A5%significance levelwasconsidered.
AllparticipantsreceivedguidanceregardingtheTenSteps foraHealthyNutritionoftheMinistryofHealthofBrazil.
Thisstudyispartofalargerprojectthatwasapprovedby theResearchEthicsCommitteeoftheUniversidadeFederalde SantaMaria,undernumberCAEE05494112.0.0000.5346, opin-ion119405ofOctober10,2012.AllprovisionsofResolutionNo. 466/12oftheNationalHealthCouncilwerefollowed.
Results
Thesampleconsistedof393postmenopausalwomen
under-goingbonedensitometry.Themeanagewas59.6±8.2years. Theprevalenceofosteopeniawas45%(n=222)andof osteo-porosiswas23.3%(n=113).
Table1presentsthesocio-demographiccharacteristicsand riskfactorsforosteoporosisinoursample.Womenwitha part-ner(68.7%),withfourtoeightyearsofeducation(51.7%),and retirees(46.3%)weremorefrequent.Themajorityofthe sam-plewere sedentary(58.5%)andaminoritywereofsmokers (11.5%).
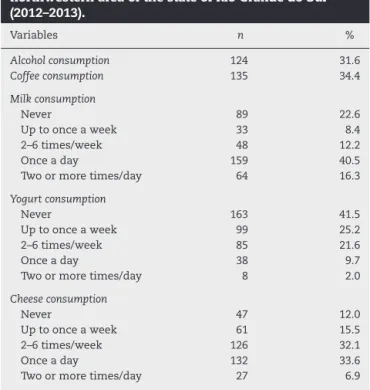
InTable2,itwasfoundthat31.6%consumedalcoholic bev-erages,and34.4%werecoffeedrinkers.Asfordairyproducts evaluated,itwasfoundthatmostofthesample(40.5%) con-sumedmilkonceaday,neverconsumedyogurt(41.5%),and consumedcheeseonceaday(33.6%).
In Table 3, PR for osteopenia versus BMI and age was
checked. After the adjustments, it was found that PR for
osteopeniaineutrophicwomenissignificantlyhigherversus obesewomen.Eutrophicwomenhave1.2timestheprevalence ofosteopeniaofobesewomen,aftertheadjustmentforage. Withregardtoage,itwasfoundthatadvancingage signifi-cantlyincreasestheprevalenceofosteopenia.Womenaged
Table1–Sociodemographiccharacteristicsandrisk factorsof393post-menopausalwomenfromthe northwesternareaofthestateofRioGrandedoSul (2012–2013).
Variables n %
Maritalstatus
Withacompanion 270 68.7
Nocompanion 123 31.3
Educationallevel
<4yearsofstudy 136 34.6
4–8yearsofstudy 203 51.7
>8yearsofstudy 54 13.7
Occupation
Unemployed 7 1.8
Employedwithaformalcontract 18 4.6
Employedunregistered 78 19.8
Householdduties 108 27.5
Retired 182 46.3
Smoker 45 11.5
Sedentarylifestyle 230 58.5
Table2–Consumptionofalcohol,coffeeanddairy productsfrom393post-menopausalwomenfromthe northwesternareaofthestateofRioGrandedoSul (2012–2013).
Variables n %
Alcoholconsumption 124 31.6
Coffeeconsumption 135 34.4
Milkconsumption
Never 89 22.6
Uptoonceaweek 33 8.4
2–6times/week 48 12.2
Onceaday 159 40.5
Twoormoretimes/day 64 16.3
Yogurtconsumption
Never 163 41.5
Uptoonceaweek 99 25.2
2–6times/week 85 21.6
Onceaday 38 9.7
Twoormoretimes/day 8 2.0
Cheeseconsumption
Never 47 12.0
Uptoonceaweek 61 15.5
2–6times/week 126 32.1
Onceaday 132 33.6
Twoormoretimes/day 27 6.9
50–59yearshave1.5timestheprevalenceofosteopeniawhen
comparedwithwomen under49;womenaged60–69years
have1.7timestheprevalenceofosteopeniawhencompared
withwomenunder49,andwomenover70have1.8timesthe
prevalenceofosteopeniaversuswomenunder49,regardless ofBMI.
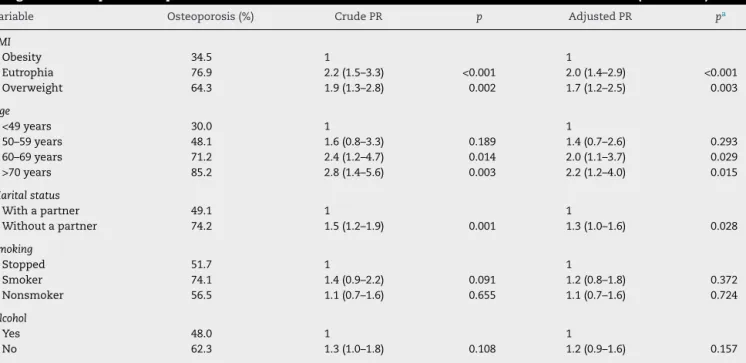
Table4showsPRforosteoporosisrelatedtoBMI,age, mar-italstatusandsmokingstatus.Aftertheadjustments,itwas foundthat,withrespecttoBMI,thePRforosteoporosisinthe
groupofnormal-weightedwomenistwicethePRforobese
years.WomenwithoutapartneralsohadahigherPRfor osteo-porosisversuswomenwithapartner,aftertheadjustmentfor potentialconfounders.Therewasnosignificantassociationin relationtosmokingandalcoholconsumption.
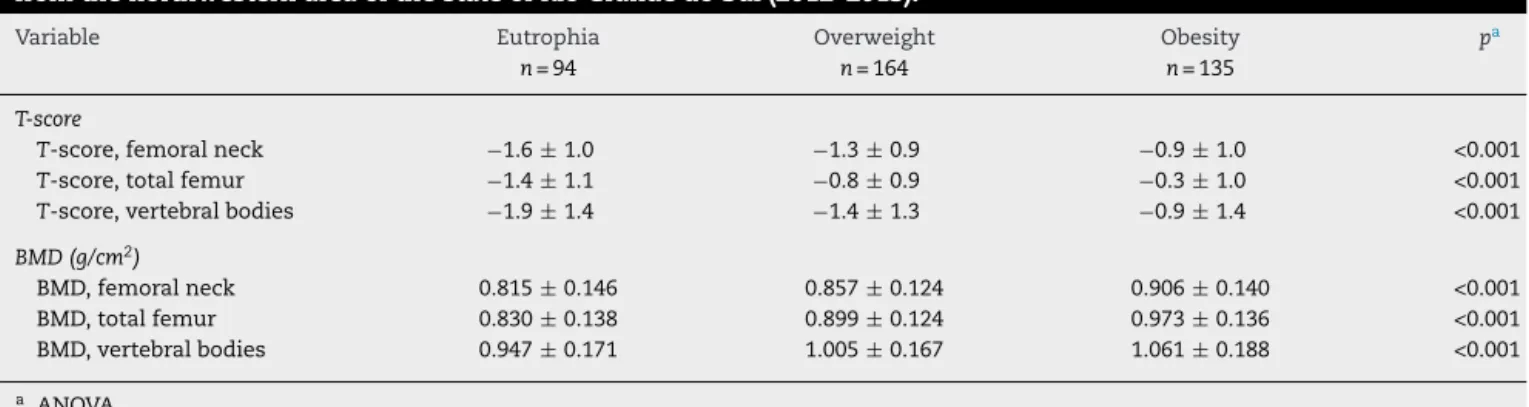
Table5showstheT-scorevaluesandBMDforfemoralneck, totalfemurandvertebralbodiesineutrophic,overweightand obesewomen.Allvaluesweresignificantlydifferent(p<0.001).
Discussion
This is one ofthe few studies evaluating the relationship betweenBMIversusosteopeniaandosteoporosisinBrazil.PR forosteopeniaandosteoporosiswaslowerinobesewomen.In additiontoBMI,advancingagealsoshowedacorrelationwith
higher prevalenceof osteopenia and osteoporosis. Women
withoutapartnerhadahigherprevalenceofosteoporosis. AnalyzingtheassociationofBMIwithBMD,itwasfound
thatobese womenhad lesserosteopenia andosteoporosis,
confirming the findings of previous studies, in which the presenceofahighBMIhasapositiveeffectonBMD.13A
cross-sectionalstudywith588patientsconfirmstheinfluenceofBMI onBMDandindicatesthelowerprevalenceofosteoporosisin the obesegroup.9 Ina case–controlstudy conductedinRio
GrandedoSul,itwasobservedthatthegroupofpatientswith fractureshad lowerBMIversuspatientswithoutfractures10;
furthermore,otherstudiesindicateaprotectiveeffectofahigh BMI.14,15
Therelationshipbetweenbodyweightandosteoporosisis widelydebated,13butthistopichasnotyetbeenfully
eluci-dated,althoughseveralexplanationshavebeenproposed:a higherbodyweightimposesagreatermechanicalloadonthe bone,withanincreaseofbonemassinordertoaccommodate thisload,16andbodyfatseemstoexertaprotectivefactorfor
fractures.13Furthermore,adipocytesareimportantestrogen
productionsources, causinganincrease inserum levelsof
this hormoneand also ofother hormones, such as leptin,
insulin, preptin, and amylin, and may act directly and/or
Table3–Crudeandadjustedprevalenceratio(PR)ofosteopeniainbodymassindex(BMI)andagegroupcategoriesof 393post-menopausalwomenfromthenorthwesternareaofthestateofRioGrandedoSul(2012–2013).
Variable Osteopenia(%) CrudePR p AdjustedPR pa
BMI
Obesity 67.0 1 1
Eutrophia 77.8 1.2(1.0–1.4) 0.126 1.2(1.1–1.5) 0.048
Overweight 79.0 1.2(1.1–1.4) 0.041 1.2(1.0–1.3) 0.096
Age
<49years 48.1 1 1
50–59years 71.4 1.5(1.0–2.2) 0.056 1.5(1.0–2.2) 0.046
60–69years 82.4 1.7(1.1–2.6) 0.009 1.7(1.2–2.5) 0.008
>70years 86.2 1.8(1.2–2.7) 0.006 1.8(1.2–2.7) 0.004
a AdjustedforBMIandage.
Table4–Prevalenceratio(PR)ofosteoporosisinbodymassindex(BMI),age,maritalstatus,smokingandalcohol categoriesof393post-menopausalwomenfromthenorthwesternareaofthestateofRioGrandedoSul(2012–2013).
Variable Osteoporosis(%) CrudePR p AdjustedPR pa
BMI
Obesity 34.5 1 1
Eutrophia 76.9 2.2(1.5–3.3) <0.001 2.0(1.4–2.9) <0.001
Overweight 64.3 1.9(1.3–2.8) 0.002 1.7(1.2–2.5) 0.003
Age
<49years 30.0 1 1
50–59years 48.1 1.6(0.8–3.3) 0.189 1.4(0.7–2.6) 0.293
60–69years 71.2 2.4(1.2–4.7) 0.014 2.0(1.1–3.7) 0.029
>70years 85.2 2.8(1.4–5.6) 0.003 2.2(1.2–4.0) 0.015
Maritalstatus
Withapartner 49.1 1 1
Withoutapartner 74.2 1.5(1.2–1.9) 0.001 1.3(1.0–1.6) 0.028
Smoking
Stopped 51.7 1 1
Smoker 74.1 1.4(0.9–2.2) 0.091 1.2(0.8–1.8) 0.372
Nonsmoker 56.5 1.1(0.7–1.6) 0.655 1.1(0.7–1.6) 0.724
Alcohol
Yes 48.0 1 1
No 62.3 1.3(1.0–1.8) 0.108 1.2(0.9–1.6) 0.157
Table5–T-scoreandbonemineraldensity(BMD)valuesinbodymassindexcategoriesof393postmenopausalwomen fromthenorthwesternareaofthestateofRioGrandedoSul(2012–2013).
Variable Eutrophia Overweight Obesity pa
n=94 n=164 n=135
T-score
T-score,femoralneck −1.6±1.0 −1.3±0.9 −0.9±1.0 <0.001
T-score,totalfemur −1.4±1.1 −0.8±0.9 −0.3±1.0 <0.001
T-score,vertebralbodies −1.9±1.4 −1.4±1.3 −0.9±1.4 <0.001
BMD(g/cm2)
BMD,femoralneck 0.815±0.146 0.857±0.124 0.906±0.140 <0.001 BMD,totalfemur 0.830±0.138 0.899±0.124 0.973±0.136 <0.001 BMD,vertebralbodies 0.947±0.171 1.005±0.167 1.061±0.188 <0.001
a ANOVA.
indirectlyonosteoblastand osteoclastactivity,resulting in thedevelopmentofbonemass.13
Despite a lower prevalence of osteoporosis in obesity
found in this study, it is important to note that not all typesoffatarebeneficialforbonemass.Subcutaneousand visceralfathasopposite effectsonthebonestructure.
Vis-ceral fat promotessystemic inflammation, which can lead
toboneloss,17besideshavinganassociationwithincreased
levels ofproinflammatory cytokinessuch asTNF and IL-6, whichincreaseboneresorptionandpromoteosteoporosis.18
Hypercortisolism, which is associated with lower levels of bone mass, also displays an association with visceral fat accumulation.19Ontheotherhand,subcutaneousfatappears
tobebeneficialforpeakbonemass,consideringthatproteins that are potentially protective against the development of osteoporosis,forinstance,adiponectin,arepresentathigher levelsinvisceralversussubcutaneousfat.18
Obesity is also associated with many diseases, e.g.,
hypertension,20 acutemyocardialinfarction,21
atherosclero-sis,22 diabetes mellitus type II,23 cardiovascular diseases,23
metabolicsyndromes,24andsomecancers.16,20–25Current
evi-dencehasshownthatanexcessofadiposetissue,observed in obesity, is responsible for the uncontrolled secretion of inflammatorymediators,whichleadstoachronicstateof low-intensitysystemicinflammationthatunderliesthemetabolic andcardiovascularoutcomes.26
Theconsumptionofdairyproductsshowednosignificant correlationwithBMD,possiblyduetothedailyconsumptionof milkandcheeseforalargenumberofsubjectsinoursample. Itisknownthat,insomeindividuals,anadequateintakeof calciumiseffectiveinpreventingboneloss.27
Inthisstudy,therewasnosignificantrelationshipofcoffee withBMD.Choietal.,28inarecentstudythatevaluated11,064
womenand9213men,alsofoundnoassociationbetweenBMD andcaffeine.Furthermore,aprospectivestudyof96women over65years,followedduring3yearsshowedthatacaffeine intake>300mg/dayacceleratedspinalboneloss.6
Older age proved to be a very significant factor for
decreased bone mass, which agrees with other published
studies.6,29–31 Peakbone massis achievedbetween
adoles-cenceandtheageof35,1andatleasthalfoftheadultbone
massisacquiredduringadolescence.32Henceforth,thebone
massremainsrelativelyconstantuntilthewomanentersthe menopause.Aftermenopause,thereisaphaseofrapidbone
lossover5–10years,followedbyasomewhatslower phase inducedbyage.33Intheelderly,theultimategoalofprevention
istominimizebonelossandpreventfalls.Theexercisesalso aimtoimprovebalanceandgaitpattern,withaviewtoabetter independencestatus;furthermore,theexercisecontributesto abetterqualityoflife.1
Menopause is alsoa risk factor that is associatedwith animbalance inbonemetabolism,and thefirst fivetoten postmenopausalyearsconstitutetheperiodinwhichoccurs thelargestamountofboneloss.Approximately35%of
post-menopausalwomensufferingfromlowBMDareatincreased
riskofosteoporosisandofsufferingfracturesovertheyears. Thedeclineinestrogenproductionisthemaindeterminant of this imbalance,9 coincidingwith a reduced level of
cal-ciumabsorbedbytheintestine,duetothelowproductionof calcitonin,ahormonethatinhibitsbonedemineralization,34
althoughmanyotherfactorsmaycontribute.9Estrogendeficit
isanimportantdeterminantofbonelossduringmenopause, andinearlycases,theriskismuchhigher.34
Women without partners showed more osteoporosis in
ourstudy.Thereisevidenceofanassociationbetween mar-riagewithreducedriskofosteoporosisfracturesversusliving alone.35,36Apparently,marriageprovides“protection”against
adversehealthoutcomesthroughachangeofhealth behav-iorsandthroughsocialnetworksstemmedfromthatunion.37
Thisassociationcanbeexplainedbytwoprocesses: oneof themisthatmarriageprovidesaprotectiveeffect,composed ofacomplexsetofenvironmental,socialandpsychological factors;andtheotherprocessisthatunmarriedindividuals arelesshealthy.37,38
Themaritaldisruptionthroughdivorceorwidowhoodcan beasourceofpsychologicalstressthatcaninfluencebone quality.Ontheother hand,marriageistraditionally associ-atedwithgreatereconomicsecurityforthewomanandcan leadtodecreasedpsychologicalstress,whichcaninfluence theoverall/bonehealth;however,maritalqualityisassociated withbetterbonehealthforwomen.39
Conclusion
Inasampleofwomenundergoingbonedensitometryinthe
northwesternareaofthestateofRioGrandedoSul,obese
womenhad alower prevalenceofosteopenia comparedto
normal-weightwomen;moreover,thisgroupshowedalower
prevalenceofosteoporosisascomparedtonormal-weightand
overweightwomen.Theprevalenceofosteopeniaincreased
withadvancedage,andincasesofosteoporosis,PRwashigher inthoseagedover60years.PRforosteoporosiswas signifi-cantlyhigherinwomenwithoutapartner.
Conflicts
of
interest
Theauthorsdeclarenoconflictsofinterest.
Acknowledgements
WethankClinicaDiagimage,especiallytoDr.SérgioDanilo
Aragonez, by encouraging this clinical research. We also
appreciatetheassistancereceivedfromAEX-CAPESand FIPE-UFSM.
r
e
f
e
r
e
n
c
e
s
1. NetoAMP,SoaresA,UrbanetzAA,SouzaACDA,FerrariAEM, AmaralB,etal.BrazilianConsensusonOsteoporosis2002. RevBrasReumatol.2002;42:343–54.
2. FortesEM,RaffaelliMP,BraccoOL,TakataETT,ReisFB,Santili C,etal.Elevadamorbimortalidadeereduzidataxade diagnósticodeosteoporoseemidososcomfraturadefêmur proximalnaCidadedeSãoPaulo.ArqBrasEndocrinolMetab. 2008;52:1106–14.
3. PORTALBRASIL.Saúde,2012.Availableat:http://www.brasil. gov.br/saude/2012/10/acoes-no-proximo-sabado-20-marcam-o-dia-contra-a-osteoporose[accessed10.10.13].
4. NOFoundation.Clinican’sguidetopreventionandtreatment ofosteoporosis;2013.p.1–53.
5. PinheiroMDM,EisSR.Epidemiologyofosteoporoticfractures inBrazil:whatwehaveandwhatweneed.ArqBras EndocrinolMetab.2010;54:164–70.
6. CuryAF,ZacchelloKP.Prevalênciaefatoresderiscoem mulheresdeclínicaprivadamaioresde49anosdeidade. ActaOrtopBras.2007;15:146–50.
7. PinheiroMM,CiconelliRM,JacquesNDO,GenaroPS,Martini LA,FerrazMB.OimpactodaosteoporosenoBrasil:dados regionaisdasfraturasemhomensemulheresadultos–The BrazilianOsteoporosisStudy(BRAZOS).RevBrasReumatol. 2010;50:113–20.
8. RipkaWL,MatosOD.Relac¸ãoentreíndicedemassacorporal edensidademineralósseaemosteoporóticaspós
menopáusicas.RevUniandrade.2009;10:45–51.
9. SilvaHGVD,Mendonc¸aLMC,Conceic¸ãoFL,ZaharSEV,Farias MLF.Influenceofobesityonbonedensityinpostmenopausal women.ArqBrasEndocrinolMetab.2007;51:943–9.
10.PaganiRC,KunzRF,GirardiR,GuerraM.Bodymassindexasa prognosticfactorforfracturingoftheproximalextremityof thefemur:acase–controlstudy.RevBrasOrtop.2014;49:461–7. 11.NationalInstitutesofHealth.Thepracticalguide
identification,evaluation,andtreatmentofoverweightand obesityinadults.Bethesda,MD:NationalInstitutesofHealth,
NationalHeart,Lung,andBloodInstituteandNorth AmericanAssociationfortheStudyofObesity;2000. 12.BrandãoCMA,CamargosBM,ZerbiniCA,PlaplerPG,
Mendonc¸aLMDC,AlbergarlaBH,etal.Posic¸õesoficiais2008 daSociedadeBrasileiradeDensitometriaClínica(SBDens). ArqBrasEndocrinolMetab.2009;10:7–12.
13.MartiniLA,MouraECD,SantosLCD,MaltaDC,PinheiroMDM. Prevalênciadediagnósticoautorreferidodeosteoporose, Brasil,2006.RevSaúdePública.2009;43:107–16.
14.LaetCD,KanisJA,OdénA,JohansonH,JohnellO,DelmasP, etal.Bodymassindexasapredictoroffracturerisk:a meta-analysis.OsteoporosInt.2005;16:1330–8.
15.PremaorMO,PilbrowL,TonkinC,ParkerRA,CompstonJ. Obesityandfracturesinpostmenopausalwomen.JBone MinerRes.2010;25:292–7.
16.ZhaoLJ,LiuYJ,LiuPY,HamiltonJ,ReckerRR,DengHW. Relationshipofobesitywithosteoporosis.JClinEndocrinol Metab.2007;92:1640–6.
17.FontanaL,EagonJC,TrujilloME,SchererPE,KleinS.Visceral fatadipokinesecretionisassociatedwithsystemic
inflammationinobesehumans.Diabetes.2007;56:1010–3. 18.GilsanzV,ChalfantJ,MoAO,LeeDC,DoreyFJ,MittelmanSD.
Reciprocalrelationsofsubcutaneousandvisceralfattobone structureandstrength.JClinEndocrinolMetab.
2009;94:3387–93.
19.ChoiHS,KimKJ,KimKM,HurNW,RheeY,HanDS,etal. Relationshipbetweenvisceraladiposityandbonemineral densityinKoreanadults.CalcifTissueInt.2010;87: 218–25.
20.ObesityinAsiaCollaboration.Iscentralobesityabetter discriminatoroftheriskofhypertensionthanbodymass indexinethnicallydiversepopulations?JHypertension. 2008;26:169–77.
21.YusufS,HawkenS,OunpuuS,BautistaL,FranzosiMG, CommerfordP,etal.Obesityandtheriskofmyocardial infarctionin27000participantsfrom52countries:a case–controlstudy.Lancet.2005;366:1640–9.
22.SeeR,AbdullahSM,GuireDKM,KheraA,PatelMJ,LindseyJB, etal.Theassociationofdifferingmeasuresofoverweightand obesitywithprevalentatherosclerosis:theDallasHeartstudy. JAmCollCardiol.2007;50:752–9.
23.BalkauB,DeanfieldJE,DesprésJP,BassandJP,FoxAA,Smith SC,etal.InternationalDayfortheEvaluationofAbdominal Obesity(IDEA):astudyofwaistcircumference,cardiovascular disease,anddiabetesmellitusin168,000primarycare patientsin63countries.CircJ.2007;116:1942–51.
24.FoxCS,MassaroJM,HoffmannU,PouKM,HorvatPM,LiuCY, etal.Abdominalvisceralandsubcutaneousadiposetissue compartments:associationwithmetabolicriskfactorsinthe FraminghamHeartStudy.CircJ.2007;116:39–48.
25.OhtaniN,YoshimotoS,HaraE.Obesityandcancer.Agut microbialconnection.CancerRes.2014;74:1885–9.
26.IkeokaD,MaderJK,PieberTR.Adiposetissue,inflammation, andcardiovasculardisease.RevAssocMedBras.
2010;56:116–21.
27.MaltaMB,PapiniSJ,CorrenteJE.Avaliac¸ãodaalimentac¸ãode idososdomunicípiodePaulista–Aplicac¸ãodoÍndicede Alimentac¸ãoSaudável.CienSaudeColet.2013;18: 377–84.
28.ChoiEJ,KimKH,KohYJ,LeeJS,LeeDR,ParkSM.Coffee consumptionandbonemineraldensityinKorean premenopausalwomen.KoreanJFamMed.2014;35:11–8. 29.KanisJA.Diagnosisofosteoporosisandassessmentof
fracturerisk.Lancet.2002;359:1929–36.
31.FrazãoP,NaveiraM.Fatoresassociadosàbaixadensidade mineralósseaemmulheresbrancas.RevSaúdePública. 2007;41:740–8.
32.IlichJZ,KerstetterJE.Nutritioninbonehealthrevisited:a storybeyondcalcium.JAmCollNutr.2000;19:715–37. 33.PatelS.Currentandpotentialfuturedrugtreatmentsfor
osteoporosis.AnnRheumDis.1996;55:700–14.
34.LanzillottiHS,LanzillottiRS,TrotteAPR,DiasAS,BornandB, CostaEAMM.Osteoporoseemmulheresnapós-menopausa, cálciodietéticoeoutrosfatoresderisco.RevNutr.
2003;16:181–93.
35.FarahmandBY,PerssonPG,MichaëlssonK,BaronJA,Parker MG,LjunghallS;Swedishhipfracturegroup.Socioeconomic status,maritalstatusandhipfracturerisk:a
population-basedcase–controlstudy.OsteoporosInt. 2000;11:803–8.
36.BenetouV,OrfanosP,FeskanichD,MichaëlssonK,
Pettersson-KymmerU,AhmedLA.Education,maritalstatus, andriskofhipfracturesinoldermenandwomen:the CHANCESproject.OsteoporosInt.2015;26:1733–46.
37.RobardsJ,EvandrouM,FalkinghamJ,VlachantoniA.Marital status,health,andmortality.Maturitas.2012;73:295–9. 38.GoldmanN,KorenmanS,WeinsteinR.Maritalstatusand
healthamongtheelderly.SocSciMed.1995;40: 1717–30.