ABSTRACT: Feed shortages are relatively frequent in subtropical pasture-based dairy production systems. The effect of feed restriction on milk yield and physical-chemical traits was evaluated in this study. The experiment was carried out in Brazil’s south region. Treatments consisted of control and restricted diet. Six multiparous and six primiparous cows, with 499 ± 47.20 kg body weight (BW), at mid-lactation (188 ± 124 days in milk), producing 19.35 ± 4.10 kg of milk were assigned to two groups, balanced for parity, each group receiving a different sequence of the dietary treatments for 56 days, in a crossover design. Diet nominated as control included 8 kg DM 100 kg BW–1 of Bermuda grass var. Tifton pasture (Cynodon dactylon (L.) Pers.), 5.00 kg of concentrate and 2.50 kg of Tifton hay per day. The restriction diet consisted of 50 % of the quantity offered in the control diet. Milk production and physicochemical composition were evaluated. Feed restriction reduced milk production by 40 %, body condition score by 5 %, milk magnesium by 14.3 %, lactose by 1.7 %, titratable acidity by 10 % and stability to the ethanol test by 9 % and it tended to increase (7 %) milk potassium content. No changes were found for the remaining characteristics. Since feed restriction is quite frequent in Brazil’s extensive dairy production systems, our concern is that besides decreased milk production, changes can occur in the physiochemical attributes of the milk, mainly a reduction in the stability to the ethanol test, which may increase the volume of milk rejected by the industry.
Keywords: alcohol test, grazing systems, milk stability, underfeeding
Introduction
In the subtropics and tropics, cold and dry periods are unevenly distributed throughout the year, so that a considerable proportion of the dairy herd undergoes an inadequate nutritional supply, with reduced productiv-ity, mainly due to a combination of low pasture allow-ance, high fiber content and inadequate feeding manage-ment (Verkerk, 2003; Njarui et al., 2011).
The effects of feed restriction may vary according to lactation stage, magnitude and length of the restric-tion. For cows with 162 ± 20 days in milk, restriction of 30 % in the supply of dry matter (DM) during 21 days decrease milk, fat and protein yields in 12.0, 18.0 and 18.5 %, respectively (Guinard-Flament et al., 2007). Feed restriction of 44 % of DM during 14 days reduced milk, fat and protein production in 25.6, 31.6 and 33.3 %, respectively for cows with more than 28 days in milk (DIM) (Burke et al., 2010).
The effects of feed restriction on milk chemical at-tributes are highly variable, e.g. effects on protein con-tent have been reported as negative (Guinard-Flament et al., 2007; Gross et al., 2011), without effect (Zanela et al., 2006) and positive (Auldist et al., 2000; Lacy-Hul-bert et al., 1999). The same effect variability was also reported for fat and lactose contents (Bjerre-Harpøth et al., 2012; Guinard-Flament et al., 2007; Gross et al., 2011). However, the effects of feed restriction on
physi-cal attributes are less well documented. Restriction of 40 % in DM intake increased the frequency of unstable milk to the ethanol test, but decreased titratable acidity without significant effects on the cryoscopy index and density (Zanela et al., 2006). These authors measured stability of milk at just one level of ethanol (76 ˚GL), which is above the official ethanol concentration re-quired in Brazil – 72 ˚GL - (Brasil, 2011) and in several countries of Latin America, impairing its comparison with other studies.
Milk suitability for the dairy industry is tested on-farm and at industry platform and relies on milk stabil-ity to the ethanol test. In order to be accepted by the industry, milk should be stable when mixed with an al-coholic solution with at least 72 ˚GL (Brasil, 2011) as in Argentina (Chavez et al., 2004).
The present study aimed to evaluate the effects of severe feed restriction on milk production and its phys-ical-chemical characteristics on mid-lactation Holstein cows.
Materials and Methods
The experiment was carried out in the south-west region of the Rio Grande do Sul State, Brazil, 27°42'57'' S, 52°37'39'' W, altitude 583 m. Twelve Holstein cows were divided into two groups balanced for parity (six multiparous and six primiparous), with 499 ± 47.20 kg of body weight (BW), 188 ± 124 DIM and individual daily milk yield of 19.35 ± 4.10 kg. All cows were milked twice daily at 05h30 and 17h30. The
Received December 12, 2012 Accepted May 01, 2013
§Present address: Emater/RS, R. Bartolomeu Dias, 03 – 99665-000 – Cruzaltense, RS – Brasil.
UFRGS/Faculdade de Agronomia – Depto. de Zootecnia, Av. Bento Gonçalves, 7712 – 91540-000 – Porto Alegre, RS – Brasil.
*Corresponding author <[email protected]>
Edited by: Daniel Scherer de Moura
Feeding restriction impairs milk yield and physicochemical properties rendering it
feeding trial was conducted during the hot season (Jan and Feb).
The whole experiment was a two-period crossover design and lasted 56 d. Each period lasted 28 d: 14 d for adaptation to the diet and 14 d for data collection (experimental period). Fourteen days before the start of the trial, all cows were fed the same standard diet. They were allowed to graze Tifton 85 (Cynodon dactylon (L.) Pers.) grass with mass availability of 6 to 8 kg DM 100 kg BW day–1 and received 4 kg of concentrate; cows with daily milk production above 18 L received a further 1 kg high-protein supplement.
During the trial, two diets were used: control and restriction. Cows allocated to the control diet grazed Tif-ton 85 pasture with daily herbage mass availability of 8 kg DM 100 kg BW–1 and received 2.5 kg of Tifton hay as well as 5 kg of concentrate. Cows in this group had an estimated daily dry matter intake of 16 kg, with 65 % of the DM derived from the pasture, which supplied approximately 15 % of crude protein, 67 % of TDN, 0.8 % calcium and 0.4 % phosphorus. Cows with daily milk production above 18 L received 2 kg of high-protein sup-plement per day. The cows assigned to the restriction diet grazed Tifton 85 pasture with daily availability of 4 kg DM 100 kg BW–1 and received 50 % of the feed given to the non-restricted group, and we estimated that the nutrient supply was 50 % of the control diet.
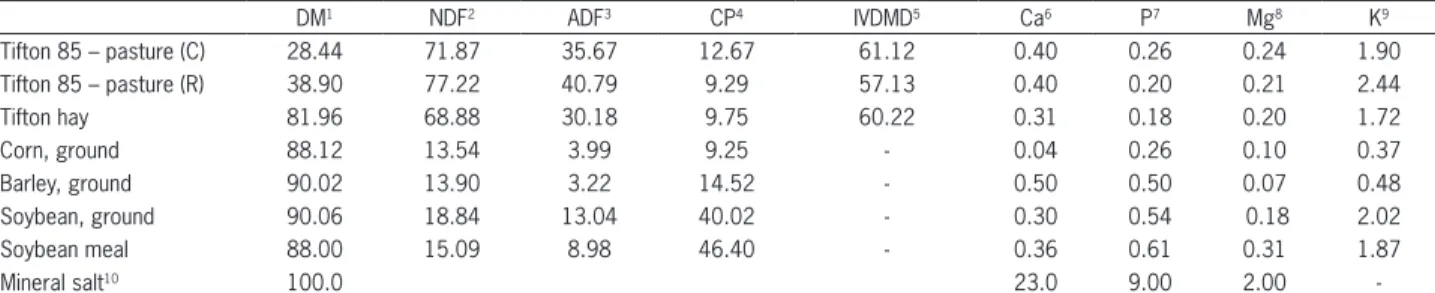
The concentrate consisted of 676 g kg–1 ground corn grain, 290 g kg–1 ground barley grain, 20 g kg–1 mineral salt and 10 g kg–1 limestone. The high-protein supplement was composed of 750 g kg–1 ground soybean and 250 g kg–1 of soybean meal (Table 1). Concentrate, hay and protein supplement were supplied individually, twice a day and during the milking. The paddocks, en-closed by electric fences and with free access to water and shade, were located 150 m from the milking parlor. During the trial, the two groups of cows grazed separately and remained for 24 h in each paddock, with a resting period of 20 d between pasture utilizations. The animals were transferred to a new paddock after the morning milking. Herbage mass was measured before and after grazing on each treatment, every day by cut-ting quadrats at ground level (Combellas and Hodgson,
1979). Pasture availability was calculated considering the weight of the animals’ groups at the beginning of the experimental periods and adjustments were made by modifying the paddock area using the electric fence.
Samples of all individual ingredients (Table 1) were taken weekly and pooled monthly during the study and analyzed for DM content, crude protein (AOAC, 1995), acid detergent and neutral detergent fiber (Goering and Van Soest, 1970), potassium, calcium, sodium and mag-nesium content by atomic absorption spectrometry, and phosphorus levels by colorimetry (Fiske and Subbarow, 1925).
On days 14 and 1 prior to the beginning of treat-ments (d -14, d -1) and on days 14, 28 of each experi-mental period, at each milking, milk yield was recorded and composite milk samples were collected automatical-ly. Daily milk yield was calculated and composite milk samples collected at each milking were analyzed for fat, protein and lactose using an infrared analyzer. Potassi-um, calciPotassi-um, sodium and magnesium were measured by atomic absorption spectrometry. Phosphorus levels were obtained by colorimetry, and somatic cell count (SCC) was determined by flow cytometry. A subset of each composite milk sample was analyzed for titratable acid-ity (expressed as g of lactic acid per 100 mL), densacid-ity, ethanol stability (by mixing 2 mL of milk with 2 mL of alcohol solution in a Petri dish, with ethanol concentra-tions starting at 68 ˚GL and raising until visual detection of clot formation; the result was considered as the mini-mal ethanol concentration that induced precipitation), thermal stability (by boiling milk samples and checking for clot formation; results were expressed as absence or presence of clots) and cryoscopy index (°H).
The data obtained at the end of experimental pe-riods was subjected to analysis of variance, considering the crossover design, testing the effect of diet (control × restriction, n = 2), group (dietary treatment sequence, n = 2), period (n = 2) as fixed effects and cows within group as a random effect. The number of weeks in lacta-tion was used as covariate, using the statistical program SAS®, MIXED procedure. The boiling test values were computed as zero for negative (normal milk) and one for positive milk (coagulated) and frequencies analyzed
Table 1 – Chemical composition of feeds supplied to cows receiving control (C) and restriction (R) diets.
DM1 NDF2 ADF3 CP4 IVDMD5 Ca6 P7 Mg8 K9
Tifton 85 – pasture (C) 28.44 71.87 35.67 12.67 61.12 0.40 0.26 0.24 1.90
Tifton 85 – pasture (R) 38.90 77.22 40.79 9.29 57.13 0.40 0.20 0.21 2.44
Tifton hay 81.96 68.88 30.18 9.75 60.22 0.31 0.18 0.20 1.72
Corn, ground 88.12 13.54 3.99 9.25 - 0.04 0.26 0.10 0.37
Barley, ground 90.02 13.90 3.22 14.52 - 0.50 0.50 0.07 0.48
Soybean, ground 90.06 18.84 13.04 40.02 - 0.30 0.54 0.18 2.02
Soybean meal 88.00 15.09 8.98 46.40 - 0.36 0.61 0.31 1.87
Mineral salt10 100.0 23.0 9.00 2.00
g L–1), sodium (1.38 × 1.50 g L–1; SEM = 0.06 g L–1) and phosphorus (0.81 × 0.85 g L–1; SEM = 0.03 g L–1).
The reduction in milk production and synthesis of lactose, fat and protein is probably due to lower blood flow and mammary uptake of nutrients, although these were not measured. Because glucose is the primary precursor for lactose synthesis and lactose is the major osmotic agent in milk, reduced mammary glucose up-take has a major rate-limiting effect on milk synthesis as pointed out by Guinard-Flament et al. (2007). Although the milk volume was reduced by 40 %, lactose, protein and fat production were reduced to a lesser extent, re-spectively, 21, 22 and 23 %. While lactose content was lowered, milk protein and fat content were not, as also noted by Zanela et al. (2006). However, the effects of un-derfeeding upon milk solids content are highly variable, depending on the length and severity of the restriction and stage of lactation (Auldist et al., 2000; Bjerre-Har-pøth et al., 2012; Guinard-Flament et al., 2007; Gross et al., 2011; Zanela et al., 2006).
As 85 % of the SCC score values were below lin-ear score 5 and as they did not vary among diets, this decrease in lactose content might be caused by either reduction in its synthesis, due to low blood flow and low glucose uptake (Guinard-Flament et al., 2007), or passage of lactose from alveoli lumen to blood, through increased permeability of tight junctions of the mam-mary epithelial cells following stress (Stelwagen et al., 2000) caused by feed restriction (Lacy-Hulbert et al., 1999).
The reduction in Mg content in milk from feed re-stricted cows can be partially related to the increased potassium content observed in the Tifton pasture con-sumed by the feed-restricted cows, when comparing with the Tifton pasture offered to the animals in the control group: 2.44 % × 1.90 %, respectively (Table 1). Potassium absorption is antagonist of Mg, and thus it may have impaired the absorption of Mg, lowering its concentration in milk (NRC, 2001). The probable larger K intake and its high permeability in the apical mem-brane of mammary epithelial cells could also explain the tendency of increase of the potassium in the milk of feed restricted cows. There were no differences in the concentrations of other minerals in the pasture, which might explain the absence of differences regarding other minerals in milk.
Milk stability to ethanol was lower in the re-stricted group than in the control (69.00 × 75.80 ˚GL of ethanol in the alcoholic solution; SEM = 1.05 ˚GL, p <
0.001). The reduction in the ethanol stability was par-tially related to the higher values for potassium content observed in the milk of feed restricted cows. In general, decrease in milk stability is related to several factors: acidity, mono (Na+, K+) and divalent cations (Ca++ and Mg++) contents in milk, levels in milk of anions such as chlorine, citrate and phosphate, which affect the ionic strength and zeta potential, increasing the steric interac-tions between the casein micelles and inducing casein using NPAR1WAY procedure of SAS. Values of SCC were
logarithmically converted to a linear score (0 to 9). The differences between the diets were detected by the Fish-er test; p-values < 0.05 were considered significant and trends towards significance are discussed at p < 0.10. Values for standard errors of the mean (SEM) are pre-sented in the text.
Results and Discussion
Feeding restriction tended to reduce body condi-tion score (BCS): 2.77 (restriccondi-tion group) × 2.92 (Control group) (SEM = 0.18; p = 0.0729) while it did not affect BW: 489.20 × 505.00 kg (SEM = 12.26 kg; p = 0.2165) in the restriction and control groups, respectively. Al-though the reduction of food supply was severe, the ab-sence of BW loss may be due to variation in the gut fill as cows were weighed once at the beginning of each experi-mental period and at the end of the trial. Cows belonged to commercial herd were not fasted prior to weighing. On the other hand, under restricted grazing time cows had lower dry matter intake and presented lower body weight than the unrestricted group (Pérez-Ramirez et al., 2009). Gross et al. (2011) imposed feed restriction during one week, and with more frequent weighings (without previous fasting) they detected differences in BW chang-es between treatment groups.
Cows submitted to feeding restriction showed de-creased daily milk yield compared with cows in the con-trol group (8.70 × 14.37 kg; SEM = 0.92 kg; p = 0.0001). Underfeeding generates a negative energy balance and cows try to cope with the nutritional deficit by lower-ing milk production and mobilizlower-ing body reserves. Their strategy depends upon genotype, DIM and magnitude of the nutritional deficit (Bjerre-Harpøth et al., 2012; NRC, 2001). In the present study, cows were in mid to late lactation and they compensated the nutritional deficit by lowering milk production. Bjerre-Harpøth et al. (2012) and Guinard-Flament et al. (2007) observed reduced milk yield and increased moderate lipid mobilization in feed-restricted cows.
Lactose (4.49 × 4.56 g 100 g–1; SEM = 0.39 g 100 g–1; p = 0.0464) and magnesium (0.12 × 0.14 g L–1; SEM = 0.01 g 100 g–1; p = 0.0108) contents and daily yields of 4 % fat corrected milk (11.47 × 14.63 kg; SEM = 0.77 kg; p = 0.0003), lactose (0.55 × 0.70 kg; SEM = 0.04 kg;
p = 0.0003), fat (0.44 × 0.57 kg; SEM = 0.03 kg; p = 0.0003), crude protein (0.35 × 0.45 kg; SEM = 0.03 kg;
p = 0.0015) and casein (0.18 × 0.32 kg; SEM = 0.18 kg;
aggregation and coagulation (Chavez et al., 2004). How-ever, no difference (Restricted × Control; p > 0.10) was found for thermal stability evaluated by the frequency of clots formation in the boiling test (0.16 × 0.00), probably due to acidity values within the normal range (14 to 18 °D), which shows the lower sensitivity of the boiling test to detect changes in milk stability than the alcohol test (Fonteh et al., 2005; Lewis and Deeth, 2009).
Titratable acidity (15.17 × 16.83 °D; SEM = 0.32 °D; p = 0.0004) was lower in the restricted than in the control group, while values of cryoscopy (-0.54 × -0.55 ˚H; SEM = 0.001 °H; p > 0.10) and density of milk (1030.83 × 1031.25 g L–1; SEM = 0.48 g L–1; p > 0.10) were not different between restricted and control groups, respectively. The reduction in titratable acidity was probably related to the smaller numerical values of phosphorus, total protein and casein in restriction cows compared to control cows. The absence of effects of feed restriction on density and cryoscopic index were probably due to the counteracted effects of decreased protein, lactose and fat contents, besides variation in the minerals contents.
There were no cases of clinical mastitis and the values of SCC were below 400,000 cells mL–1 through-out the experiment. The logarithmic of SCC score (in which 1 is the lower and 9 the higher level) was not dif-ferent between groups: 3.42 × 3.28 (SEM = 0.37; p > 0.10) for restriction and control diet, respectively.
The low values of SCC throughout the experi-ment resulted in minimal change in the production and milk composition due to the health of the mammary gland. Absence of differences for SCC between feed-ing regimens are in agreement with previous results of Zanela et al. (2006), but they are not in agreement with the increase in SCC noticed by Lacy-Hulbert et al. (1999) and O’Brien et al. (1999). In those latter studies, the increase in SCC in feed restricted cows could due to the reduced milk volume, which tended to concentrate SCC values, probably not related to the decreased im-mune response. Moyes et al. (2009) did not find differ-ences in the immune response of Holstein cows in mid lactation submitted or not to 40 % energy restriction for seven days and challenged with injection of Streptococ-cus uberis in one of the mammary glands.
Although feed restriction has altered some milk chemical and physical attributes of milk, most aspects of milk composition were adequate, except for stabil-ity in the alcohol test, concerning the Brazilian legis-lation for milk quality (Brasil, 2011), which requires 2.90, 3.00 and 4.30 g 100 g–1 as minimum values for protein, fat and lactose contents, respectively, besides minimum ethanol stability of 72 °GL. However, as feed restriction reduced the minimum concentration of eth-anol required to induce precipitation, it may lead to an increase in the number of positive samples in the test and, following the Brazilian national legislation on milk quality, increase the volume of milk rejected by the industry.
Conclusions
A short but severe feed restriction in mid-lactation cows resulted in an immediate high decline in milk yield, accompanied by moderate declines in crude pro-tein, casein, fat and lactose yields. Milk stability to the ethanol test was severely hindered and feed restricted cows produced more milk that may be rejected by the dairy industry.
Acknowledgements
Authors gratefully acknowledge the material and financial support from the Federal University of Rio Grande do Sul (UFRGS), Sulina Association of Credit and Rural Assistance (NASCAR), the Cooperative of Small Ranchers at Campinas do Sul (COOPASUL) and CNPq scholarships.
References
Association of Official Analytical Chemistry [AOAC]. 1995. Official Methods of Analysis. 16ed. AOAC, Washington, DC, USA. Auldist, M.J.; Thomson, N.A.; Mackle, T.R.; Hill, J.P.; Prosser,
C.G. 2000. Effects of pasture allowance on the yield and composition of milk from cows of different β-lactoglobulin phenotypes. Journal of Dairy Science 83: 2069-2074.
Bjerre-Harpøth, V.; Friggens, N.C.; Thorup, V.M.; Larsen, T.; Damgaard, B.M.; Ingvartsen, K.L.; Moyes, K.M. 2012. Metabolic and production profiles of dairy cows in response to decreased nutrient density to increase physiological imbalance at different stages of lactation. Journal of Dairy Science 95: 2362-2380.
Brasil. Ministério da Agricultura, Pecuária e Abastecimento. 2011. Alteração do caput da Instrução Normativa MAPA n. 51, de 18 de setembro de 2002 (Instrução Normativa n˚62) = Amendment to the head of MAPA Normative Instruction n. 51 dated 18 September 2002 (Normative Instruction n. 62). Diário Oficial da União, Brasília, DF, Brazil.
Burke, C.R.; Williams, Y.J.; Hofmann, L.; Kay, J.K.; Phyn, C.V.C.; Meier, S. 2010. Effects of an acute feed restriction at the onset of the seasonal breeding period on reproductive performance and milk production in pasture-grazed dairy cows. Journal of Dairy Science 93: 1116-1125.
Chavez, M.S.; Negri, L.M.; Cuatrín, A. 2004. Bovine milk composition parameters affecting the ethanol stability. Journal of Dairy Research 71: 201-206.
Combellas, J.; Hodgson, J. 1979. Herbage intake and milk production by grazing dairy cows 1. The effects of variation in herbage mass and daily herbage allowance in a short-term trial. Grass and Forage Science 34: 209-214.
Fiske, C.A.; Subbarow, I. 1925. The colorimetric determination of phosphorus. The Journal of Biological Chemistry 66: 375-400.
Goering, H.K.; Van Soest, P.J. 1970. Forage Fiber Analysis (Apparatus, Reagents, Procedures and Some Applications). USDA/ARS, Washington, DC, USA.
Gross, J.; Van Dorland, H.A.; Bruckmaier, R.M.; Schwartz, F.J. 2011. Performance and metabolic profile of dairy cows during a lactational and deliberately induced negative energy balance with subsequent realimentation. Journal of Dairy Science 94: 1820-1830.
Guinard-Flament, J.; Delamaire, E.; Lamberton, P.; Peyraud, J.L. 2007. Adaptations of mammary uptake and nutrient use to once-daily milking and feed restriction in dairy cows. Journal of Dairy Science 90: 5062-5072.
Lacy-Hulbert, S.J.; Woolford, M.W.; Nicholas, G.D.; Prosser, C.G.; Stelwagen, K. 1999. Effect of milking frequency and pasture intake on milk yield and composition of late lactation cows. Journal of Dairy Science 82: 1232-1239.
Lewis, M.J.; Deeth, H.C. 2009. Heat treatment of milk. p. 168-204. In: Tamine, A.Y., ed. Milk processing and quality management. Blackwell, Chichester, UK.
Moyes, K.M.; Drackley, J.K.; Salak-Johnson, J.L.; Morin, D.E.; Hope, J.C.; Loor, J.J. 2009. Dietary-induced negative energy balance has minimal effects on innate immunity during a Streptococcus uberis mastitis challenge in dairy cows during midlactation. Journal of Dairy Science 92: 4301-4316. National Research Council [NRC]. 2001. Nutrient Requirements
of Dairy Cattle. 7ed. National Academy Press, Washington, DC, USA.
Njarui, D.M.G.; Gatheru, M.; Wambua, J.M.; Nguluu, S.N.; Mwangi, D.M.; Keya, G. A. 2011. Feeding management for dairy cattle in smallholder farming systems of semi-arid tropical Kenya. Livestock Research for Rural Development. Available at: http://www. lrrd. org/lrrd23/5/njar23111. htm. [ Acessed April 17, 2012]
O’Brien, B.; Dillon, P.; Murphy, J.J.; Mehra, R.K.; Guinee, T.P.; Connolly, J.F.; Kelly, A; Joyce, P. 1999. Effects of stocking density and concentrate supplementation of grazing dairy cows on milk production, composition and processing characteristics. Journal of Dairy Research 66: 165-176.
Pérez-Ramírez, E.; Peyraud, J.L.; Delagard, R. 2009. Restricting daily time at pasture at low and high pasture allowance: Effects on pasture intake and behavioral adaptation of lactating dairy cows. Journal of Dairy Science 92: 3331-3340.
Stelwagen, K.; Hopstert, H.; Van Der Werf, J.T.N.; Blokhuist, H.J. 2000. Short communication: effects of isolation stress on mammary tight junctions in lactating dairy cows. Journal of Dairy Science 83: 48-51.
Verkerk, G. 2003. Pasture-based dairying: challenges and rewards for New Zealand producer. Theriogenology 59: 553-561. Zanela, M.B.; Fischer, V.; Ribeiro, M.E.R.; Barbosa, R.S.; Marques,