Identification of anaerobic threshold
using heart rate response during
dynamic exercise
1Núcleo de Pesquisa em Exercício Físico, Departamento de Fisioterapia, Universidade Federal de São Carlos, São Carlos, SP, Brasil
2Curso de Fisioterapia, Centro Universitário de Anápolis, UniEvangélica, Anápolis, GO, Brasil
3Laboratório de Fisioterapia Cardiovascular e de Provas Funcionais,
Faculdade de Ciências da Saúde, Universidade Metodista, Piracicaba, SP, Brasil 4Departamento de Estatística, 5Departamento de Física,
Universidade Federal de São Carlos, São Carlos, SP, Brasil 6Divisão de Cardiologia, Departamento de Clínica Médica, Hospital das Clínicas, Faculdade de Medicina de Ribeirão Preto, Universidade de São Paulo, Ribeirão Preto, SP, Brasil
V.R.F.S. Marães1,2, E. Silva1,3, A.M. Catai1, L.D. Novais1, M.A.S. Moura4, L. Oliveira5 and L. Gallo Jr.6
Abstract
The objective of the present study was to characterize the heart rate (HR) patterns of healthy males using the autoregressive inte-grated moving average (ARIMA) model over a power range as-sumed to correspond to the anaerobic threshold (AT) during dis-continuous dynamic exercise tests (DDET). Nine young (22.3 ± 1.57 years) and 9 middle-aged (MA) volunteers (43.2 ± 3.53 years) performed three DDET on a cycle ergometer. Protocol I: DDET in steps with progressive power increases of 10 W; protocol II: DDET using the same power values as protocol 1, but applied randomly; protocol III: continuous dynamic exercise protocol with ventila-tory and metabolic measurements (10 W/min ramp power), for the measurement of ventilatory AT. HR was recorded and stored beat-to-beat during DDET, and analyzed using the ARIMA (protocols I and II). The DDET experiments showed that the median physical exercise workloads at which AT occurred were similar for protocols I and II, i.e., AT occurred between 75 W (116 bpm) and 85 W (116 bpm) for the young group and between 60 W (96 bpm) and 75 W (107 bpm) for group MA in protocols I and II, respectively; in two MA volunteers the ventilatory AT occurred at 90 W (108 bpm) and 95 W (111 bpm). This corresponded to the same power values of the positive trend in HR responses. The change in HR response using ARIMA models at submaximal dynamic exercise powers proved to be a promising approach for detecting AT in normal volunteers. Correspondence
L. Gallo Jr.
Divisão de Cardiologia Departamento de Clínica Médica FMRP, USP
Av. Bandeirantes, 3900 14049-900 Ribeirão Preto, SP Brasil
Fax: +55-16-633-1144 E-mail: [email protected]
Presented at the XIX Annual Meeting of the Federação de Sociedades de Biologia Experimental, Águas de Lindóia, SP, Brazil, August 25-29, 2004.
Research supported by FAPESP, CNPq and CAPES.
Received April 15, 2004 Accepted March 9, 2005
Key words
•Heart rate
•Anaerobic threshold •Dynamic physical exercise •Autonomic nervous system •Healthy male volunteers
During the performance of dynamic ex-ercise (DE) there is a point above a given power value when the production of lactic acid is greater than the capacity for its utili-zation by body tissues: this corresponds to
have been developed to detect the AT (5,6). Recently, some studies have been performed to demonstrate the importance of the heart rate (HR) response for the measurement of AT (3,7). Among the advantages of these procedures, it should be emphasized that HR is a physiological variable that can be re-corded non-invasively with a small method-ological error using inexpensive equipment. At the beginning of DE, during the initial 10-20 s, tachycardia is due to the withdrawal of vagal tonus acting on the sinus node. At low workloads, this is the only significant mechan-ism responsible for the increase in HR induced by DE. By using discontinuous DE protocols (step test), a full stabilization of the HR re-sponse can be observed after 2 min of DE. At medium and high powers, sympathetic stimu-lation of the sinus node is responsible for the appearance of a slow tachycardia from 1 to 4 min of DE. In this situation the HR response does not attain a steady-state condition (8-11). An important finding related to the autonomic control of HR during DE is the observation that the sympathetic contribution of exercise tachy-cardia appears above the AT (4). Thus, the loss of HR stabilization and changes in the variabil-ity of this parameter have been evaluated in our laboratory using standardized DE protocols as possible markers of AT in normal subjects (3). The objective of the present study is to characterize the HR patterns of healthy males using the autoregressive integrated moving average (ARIMA) model over a power range
assumed to correspond to the AT during discontinuous DE tests (DDET).
The study was conducted on 18 male volunteers. Two different age groups were compared: 9 young (22.3 ± 1.57 years) and 9 middle-aged volunteers (43.2 ± 3.53 years). Their physical characteristics, HR and blood pressure at rest are shown on Table 1. All volunteers were in good health as determined by clinical and physical examination and by laboratory tests that included a standard electrocardiogram (ECG), maximum exer-cise test, total blood count, urinalysis, and clinical biochemical screening tests (glu-cose, uric acid, total cholesterol and frac-tions (LDL, HDL and VLDL), and triglycer-ides). The volunteers had an active life pat-tern, i.e., they performed physical exercises 3 h per week.
The volunteers were informed about the experimental protocols and their objectives and signed a formal consent form as required by the local Ethics Committee who approved the study (405/97).
The experiments were carried out in a climatically controlled room at 22ºC and 60% humidity, always at the same time of day in order to avoid different response due to circadian changes. The volunteers were stud-ied during three dynamic exercise tests in the seated position on a calibrated cycle ergom-eter using discontinuous (protocols I and II) and continuous (protocol III) protocols on different days separated by 2-5-day inter-vals. A brake electromagnetic cycle ergom-eter equipped with a microprocessor (model Corival 400, Quinton, Seattle, WA, USA) facilitated the precise application of individu-alized power values. During the exercises (protocols) the volunteers pedaled at a rate of 60 rpm. The purpose of protocols II and I was to signal AT through the HR response and the purpose of protocol III was to measure ventilatory AT.
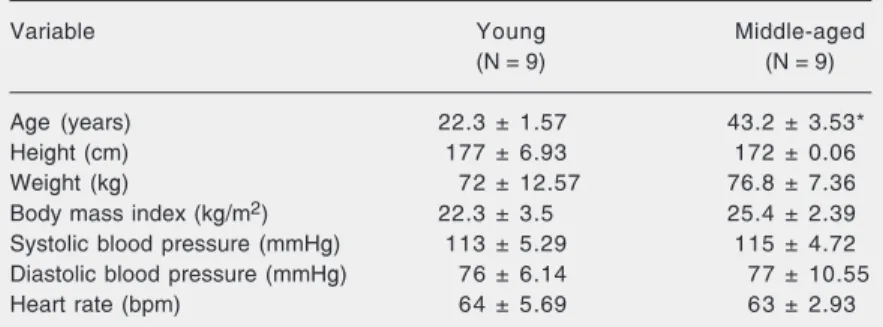
Protocol I. The initial power value was 25 W, followed by discontinuous steps with progressive power increments of 10 W of 6-Table 1. Physical characteristics, heart rate and blood pressure of the volunteer
subjects studied.
Variable Young Middle-aged
(N = 9) (N = 9)
Age (years) 22.3 ± 1.57 43.2 ± 3.53*
Height (cm) 177 ± 6.93 172 ± 0.06
Weight (kg) 72 ± 12.57 76.8 ± 7.36 Body mass index (kg/m2) 22.3 ± 3.5 25.4 ± 2.39
Systolic blood pressure (mmHg) 113 ± 5.29 115 ± 4.72 Diastolic blood pressure (mmHg) 76 ± 6.14 77 ± 10.55 Heart rate (bpm) 64 ± 5.69 63 ± 2.93
min duration, until a tendency to inclination of HR data was observed.
Protocol II. The same power values as protocol I were used, but were randomly applied.
During protocols I and II, varying resting periods were allowed between the different powers, permitting HR to return to control levels. The volunteers were monitored at the CM5 lead at rest and during exercise. The ECG and HR were obtained from a channel heart monitor (ECAFIX TC500, ECAFIX Ind. e Com. Ltda., São Paulo, SP, Brazil) and pro-cessed using an analog-digital converter La. PC+ (National Instruments, Co., Austin, TX, USA), representing an interface between the heart monitor and a Pentium II microcom-puter. Starting from the identification of “R” peaks of the ECG waves, the R-R intervals were calculated on a beat-to-beat basis from the ECG using signal-processing software (12). Recordings were obtained for 1 min prior to each exercise level throughout the 6-min dynamic exercise (protocols I and II), and for 1 min during the recovery period. Subse-quently, the HR was adjusted using temporal series methodology (13) with ARIMA. Finally, the procedure included the search for a specif-ic workload at whspecif-ich the series showed a tendency towards inclination.
Protocol III. Only two middle-aged volun-teers performed protocol III involving the continuous DE test and oxygen uptake test. The volunteers performed an oxygen uptake test using a progressive incremental exercise protocol, which consisted of a 3-min warm-up period at 4 W followed by a continuous power increase set at a value of 10 W/min up to physical exhaustion. During the performance of protocol III the volunteers breathed through a low-resistance valve (Hans Rudolph 2900 device, Kansas City, MO, USA) with a small dead space; their metabolic and ventilatory variables and parameters were calculated us-ing a specific metabolic analyzer (MMC Hori-zon System, Sensormedics, Yorba Linda, CA, USA) supplying average values at 15-s
inter-vals. The individual values of minute ventilation (V. E), CO2 production (V
.
CO2) and oxygen
uptake (V. O2) at each power were plotted as a
function of time. In this protocol the ventila-tory AT was measured when V. E and V. CO2
began to increase non-linearly as compared to V. O2 (visual analysis) (1).
The results are reported as medians, quartiles (1st and 3rd quartiles) and mini-mum and maximini-mum values using Tukey’s box-plot. Due to the non-Gaussian distribu-tion and/or non-homogeneity of variance of the data, nonparametric tests were selected for statistical analysis. The Wilcoxon and Mann-Whitney nonparametric tests were used for intra-group and inter-group com-parisons, respectively, with the level of sig-nificance set at 5%.
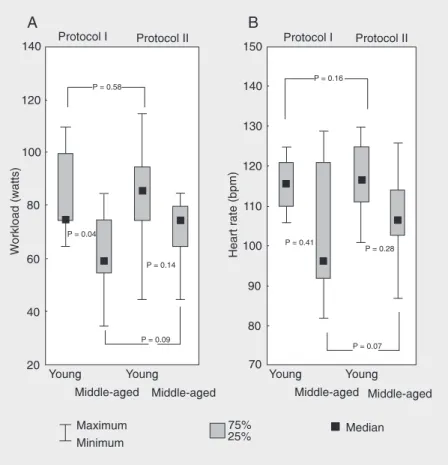
Figure 1A shows that the workload val-ues (W) at the AT level determined by the
ARIMA model of adjustment to the HR data set during DDET (protocols I and II) were similar for both protocols (P > 0.05). How-ever, when the groups studied were com-pared, significant differences were only ob-served in protocol I.
Figure 1B shows that there were no statistically significant differences in HR val-ues at the AT level (P > 0.05) between groups and protocols (I and II).
In two middle-aged volunteers the venti-latory AT occurred at 90 W (HR = 108 bpm) and 95 W (HR = 111 bpm), corresponding to the same power values at which the positive trend in HR response was observed, i.e., AT. The AT is an important parameter signal-ing a person’s physical condition. It corre-sponds to a point above a determined power value when the production of lactic acid is greater than the capacity of its utilization by body tissues (1,14). AT shows a good cor-relation with V. O2max and has been proven to
be very useful in quantifying oxygen trans-port and its modifications following physi-ological and pathphysi-ological conditions (1,14). Several methods can be used to detect AT, including blood lactic acid sampling (inva-sive) (15) and changes in the response pat-tern of the ventilatory curves during continu-ous and incremental (non-invasive) dynamic physical exercise (1). Another method used to determine AT is the study of the HR response to DE. HR becomes non-linear at a workload equal to AT (3,16,17). Linnarsson (18) evaluated in detail the HR response to DE in healthy subjects. The HR response was subdivided into 3 phases; 1) from 10 to 15 s after the beginning of exercise, when a fast increase in HR due to the removal of vagal tonus of the heart was observed inde-pendently of the applied workload; 2) a slow increase in HR between 60 and 90 s of exercise, and 3) a very slow, almost linear, increase lasting throughout exercise, and depending on the intensity of the physical exercise, on the sympathetic stimulation of the heart, and on AT (16,17). However, we
the middle-aged group, as also reported else-where (3,17).
Another important factor to be consid-ered in the present study is that the ventila-tory AT, obtained in two random cases, was very close to the ventilatory AT determined by ARIMA. Therefore, AT determination by ARIMA proved to be a promising methodol-ogy in view of its good performance com-pared to that of the standard method of
ventilatory AT determination. However, a larger number of volunteers should be stud-ied in order to determine the equivalence of AT determined by the methodologies men-tioned with a higher degree of confidence.
The change in HR response using ARIMA models at submaximal DE powers appears to be a promising approach for determining AT in normal volunteers.
References
1. Wasserman K, Hansen JE, Sue D, Whipp BJ & Casaburi R (1999).
Principles of Exercise Testing and Interpretation. 3rd edn. Lea &
Febiger, Philadelphia, PA, USA.
2. Ekkekakis P, Hall EE & Petruzzello S (2004). Practical markers of the transition from aerobic to anaerobic metabolism during exercise: rationale and a case for affect-based exercise prescription.
Preven-tive Medicine, 38: 149-159.
3. Marães VRFS, Teixeira LCA, Gallo Jr L, Catai AM, Oliveira L, Milan LA, Rojas FR & Silva E (2003). Determinação e validação do limiar de anaerobiose a partir de métodos de análise da freqüência cardíaca e de sua variabilidade. Revista da Sociedade de
Cardiolo-gia do Estado de São Paulo, 13 (Suppl 4): 1-16.
4. Gallo Jr L, Maciel BC, Marin Neto JA, Martins LEB, Lima Filho EC, Golfetti R, Chacon MPT & Forti VAM (1995). Control of heart rate during exercise in health and disease. Brazilian Journal of Medical
and Biological Research, 28: 11-12.
5. Myers J & Ashley E (1997). A perspective on exercise, lactate and the anaerobic threshold. Chest, 111: 787-795.
6. Jammes Y, Caquelard F & Badier M (1998). Correlation between surface electromyogram, oxygen uptake and blood lactate concen-tration during dynamic leg exercises. Respiration Physiology, 11: 167-174.
7. Conconi F, Grazzi G, Casoni I et al. (1996). The Conconi test: methodology after 12 years of application. International Journal of
Sports Medicine, 17: 509-519.
8. Maciel BC, Gallo Jr L, Marin-Neto JA, Lima Filho EC & Martins LEB (1986). Autonomic nervous control of the heart rate during dynam-ic exercise in normal man. Clinical Science, 71: 457-460. 9. Silva E (1988). Modelos matemáticos da resposta da freqüência
cardíaca ao exercício físico dinâmico em indivíduos normais. Master’s thesis, Universidade Estadual de Campinas, Campinas, SP, Brazil.
10. Gallo Jr L, Morelo Filho J, Maciel BC, Marin Neto JA, Martins LEB & Lima Filho EC (1987). Functional evaluation of sympathetic and parasympathetic system in Chagas’ disease using dynamic exer-cise. Cardiovascular Research, 21: 922-927.
11. Catai AM (1992). Adaptações cárdio-respiratórias em atletas: es-tudo em diferentes fases do treinamento físico. Master’s thesis,
Faculdade de Educação Física, Unicamp, Campinas, SP, Brazil. 12. Silva E, Catai AM, Trevelin LC, Guimarães JO, Silva Jr LP, Silva LMP,
Oliveira L, Milan LA, Martins LEB & Gallo Jr L (1995). Design of a computerized system to evaluate the cardiac function during dy-namic exercise. Annals of the World Congress on Medical, Physical
and Biomedical Engineering, 1: 409 (Abstract).
13. Box GEP & Jenkins GM (1970). Time Series Analysis. Holden-Day, San Francisco, CA, USA.
14. Chacon-Mikahil MPT, Forti VAM, Catai AM et al. (1998). Cardiores-piratory adaptations induced by aerobic training in middle-aged men: the importance of a decrease in sympathetic stimulation for the contribution of dynamic exercise tachycardia. Brazilian Journal
of Medical and Biological Research, 31: 705-712.
15. Brooks GA (1991). Current concepts in lactate exchange. Medicine
and Science in Sports and Exercise, 23: 895-906.
16. Alonso DdeO, Forjaz CL, Rezende LO, Braga AM, Barretto AC, Negrão CE & Rondon MU (1998). Heart rate response and its variability during different phases of maximal graded exercise.
Arquivos Brasileiros de Cardiologia, 71: 787-792.
17. Petto J, Ribeiro TF, Gomes VR et al. (1999). Determinação do limiar de anaerobiose (LA) pela variabilidade da freqüência cardíaca (VFC), utilizando-se o modelo autorregressivo integrado médias móveis. Revista da Sociedade de Cardiologia do Estado de São
Paulo, 9: 33 (Abstract).
18. Linnarsson D (1974). Dynamics of pulmonary gas exchange and the heart rate changes at start and end of exercise. Acta
Physi-ologica Scandinavica, 415 (Suppl): 1-68.
19. Ribeiro TF, Gomes VR, Moura MAS et al. (1998). Estudo do limiar de anaerobiose em mulheres sedentárias durante esforço físico dinâmico. Anais da XIII Reunião da Federação de Sociedades de
Biologia Experimental, August 26-29,258 (Abstract).
20. Takahashi ACM, Novais LD, Iwai Sakabe D, Salvino FMS, Oliveira L, Milan AL, Silva E & Catai AM (2004). Análise da freqüência cardíaca e sua variabilidade no limiar de anaerobiose de homens de meia idade saudáveis e coronariopatas. Anais daXIX Reunião da
Federa-ção de Sociedades de Biologia Experimental, August 25-29,