D iagno sing de m e ntia and no rm al
aging: clinical re le vance o f brain
ratio s and co gnitive pe rfo rm ance
in a Brazilian sam ple
1Programa de Ciências do Comportamento,
Curso de Pós-Graduação em Medicina, Clínica Médica,
2Serviços de Neurologia and 3Radiologia,
Departamento de Medicina Interna, Hospital de Clínicas de Porto Alegre, Universidade Federal do Rio Grande do Sul, Porto Alegre, RS, Brasil M.L.F. Chaves1,2, D. Ilha3,
A.L.G. Maia1, E. Motta1,
R. Lehmen1 and
L.M. O liveira1
Abstract
The main objective of the present study was to evaluate the diagnostic value (clinical application) of brain measures and cognitive function. Alzheimer and multiinfarct patients (N = 30) and normal subjects over the age of 50 (N = 40) were submitted to a medical, neurological and cognitive investigation. The cognitive tests applied were Mini-Men-tal, word span, digit span, logical memory, spatial recognition span, Boston naming test, praxis, and calculation tests. The brain ratios calculated were the ventricle-brain, bifrontal, bicaudate, third ven-tricle, and suprasellar cistern measures. These data were obtained from a brain computer tomography scan, and the cutoff values from receiver operating characteristic curves. We analyzed the diagnostic parameters provided by these ratios and compared them to those obtained by cognitive evaluation. The sensitivity and specificity of cognitive tests were higher than brain measures, although dementia patients presented higher ratios, showing poorer cognitive perfor-mances than normal individuals. Normal controls over the age of 70 presented higher measures than younger groups, but similar cognitive performance. We found diffuse losses of tissue from the central nervous system related to distribution of cerebrospinal fluid in demen-tia patients. The likelihood of case identification by functional impair-ment was higher than when changes of the structure of the central nervous system were used. Cognitive evaluation still seems to be the best method to screen individuals from the community, especially for developing countries, where the cost of brain imaging precludes its use for screening and initial assessment of dementia.
Co rre spo nde nce
M.L.F. Chaves Serviço de Neurologia
Hospital de Clínicas de Porto Alegre R. Ramiro Barcelos, 2350, Sala 2040 90035-003 Porto Alegre, RS Brasil
Fax: + 55-51-311-4684 E-mail: mchaves@ vanet.com.br
Received O ctober 22, 1998 Accepted June 18, 1999
Ke y wo rds
·Brain ratios
·Aging
·Dementia
·Cognition
Intro ductio n
In 1942, Evans (1) developed a ratio of linear measures to quantify the amount of ventricular enlargement in the pneumoen-cephalogram. With the advent of computer tomography scanning (CT) and magnetic
resonance imaging (MRI), several similar measures were developed. The most com-monly used ones are the intercaudate dis-tance (CC), the bifrontal disdis-tance (FH), and some estimates of brain width to correct for overall brain size.
in the bicaudate and bifrontal measures be-tween various patient groups and normal controls. Some investigators studied the ef-fects of aging on the volume of the basal ganglia in individuals with Down syndrome (DS) and the relationship between basal gan-glion volumes, neuropsychological test per-formance, and dementia status. DS subjects showed larger putamen volumes despite sig-nificantly smaller total brain volumes. The association between neuropsychological test performance and dementia status in the DS subjects appeared to be a reflection of neurodevelopmental or atrophic reductions in overall brain volume rather than a reflec-tion of specific basal ganglion abnormality. The results suggested that volume reduc-tions of the basal ganglia are not a salient feature of aging or of the dementia associ-ated with DS (2).
Clinical and neuropathological evalua-tion of elderly subjects with dementia has been traditionally based on focal signs of brain disease. The clinical observation of severe memory impairment in patients with Alzheimers disease and localization of se-nile plaque and neurofibrillary tangle forma-tions in hippocampi implicate focal tempo-ral lobe pathology and help to explain severe memory dysfunction (3). The suprasellar cis-tern (SSC), an area at the base of the brain, is assumed to reflect the integrity of its sur-rounding structures, which include the amyg-dala, hippocampus, entorhinal cortex, or-bital and straight gyri of the frontal lobe, pons and midbrain. Measures of the SSC may reflect the extent of atrophy in the struc-tures that surround it, primarily in the medial temporal lobes (3) and possibly in basal forebrain and brainstem structures.
The application of brain measure ratios depends on appropriate rater training and knowledge of the normal variability of the population under study. Although these ra-tios are used to enhance diagnostic accuracy, the lack of adequate diagnostic evaluations of this method makes it uncertain.
Develop-ing countries should invest in procedures like this only after all aspects of their use have been properly defined and shown to be relevant especially in terms of clinical appli-cation.
Variables other than diseases, such as age, nutrition, socioeconomic conditions (education), and environmental characteris-tics (rural and urban area), may produce significant ratio differences among groups of the same population (4).
The main purpose of the present study was to investigate the diagnostic value of brain ratios (sensitivity and specificity) and compare it to neuropsychological evalua-tion. Cerebral ratios from CT scans, as well as cognitive function, were obtained from dementia patients and normal aged subjects to detect and quantify the influence of aging and dementia in a Brazilian sample. Sex, educational level, age, socioeconomic and health conditions were recorded to analyze their relations to brain structure and func-tion.
Subje cts and Me tho ds
The patient group was composed of 30 subjects, 17 Alzheimers disease (8 males, 9 females; age range, 54 to 89 years) and 13 multiinfarct (7 males, 6 females; age range, 50 to 74 years) from the Dementia Outpa-tient Clinic of Hospital de Clínicas de Porto Alegre. The diagnostic criteria for Alz-heimers disease were those of the National Institute of Neurological and Communica-tive Disorders and Stroke (5), and the crite-ria for vascular dementia (multiinfarct) clas-sification were those of NINDS-AIREN (6), Gustafson (7) and the Hachinski ischemic score (8). All patients had a mild degree of dementia according to the Blessed scale (9) (scores of less than 10). The complete evalu-ation of cases followed a standard protocol used in this clinic (10), where CT scans are part of the investigation.
com-munity subjects (19 males, 21 females, mean age 65 years, range 51 to 90) without any chronic, neurologic or psychiatric symptoms. They answered a call for healthy subjects over the age of 50 for the present study. The subjects were submitted to a standardized interview (11) and examination for the de-termination of their medical, neurological and psychiatric conditions. Subjects selected after complete evaluation were submitted to a CT scan without administration of intrave-nous contrast (12).
The sample was divided into three groups according to age for the analysis of normal aging. Group 1 consisted of 15 subjects 50 to 60 years old, group 2, of 13 subjects 61 to 70 years old, and group 3, of 12 subjects 71 to 90 years old. Research assistants performed the neurological and physical examination of all participants. Fourteen percent of de-mentia patients presented normal neurologi-cal examination, 43% soft signs, 7% loneurologi-cal- local-ized deficit and 29% diffuse, severe abnor-malities. Volunteers had normal neurologi-cal performances. The physineurologi-cal examination did not reveal abnormalities in any of the participants (dementia and controls). All pa-tients and normal controls were right handed. A battery of memory, language, visuo-spatial abilities, calculation, abstraction, praxis and gnosis tests (10,13) were applied to assess cognition, with the Mini-Mental state examination included (14). Copying the pictures of a house and a clock (15) was used to evaluate visuo-constructional abili-ties. We applied an adapted version of the Boston naming test (16) to check this lan-guage function. The spatial recognition span test (17) was used to test visual memory span. Mini-Mental scores were used to evalu-ate the severity of cognitive deficit. Moder-ate impairment scores were from 10 to 17, and severe from zero to 10 (14).
We applied the Bronfman scale (18) for classification of sociocultural status. This scale was developed for epidemiological re-search in Brazil, and was based on the
indi-vidual/family salary (minimum wages), type of activity (entrepreneurs, liberal profession-als, employees, etc.), and house conditions (light and sewage), among other socioeco-nomic parameters. Classes may range from lower low to upper high, representing 9 dif-ferent groups. Subjects belonged to the up-per low (uL), lower, middle and upup-per middle (lM, M, uM) classes, indicating the middle to low social background origin of the sample, similar to the general population of the area. Dementia patients were distributed as fol-lows: uL, 12%; lM, 35%; M, 35%, and uM, 19%. Frequencies among normal controls were: uL, 16%; lM, 43%; M, 27%, and uM, 14%. Normal volunteers grouped by age were distributed as follows: age 1: uL, 27%; lM, 27%; M, 33%, and uM, 13%. Age 2: lM, 39%; M, 39%, and uM, 23%. Age 3: uL, 22%, and lM, 78%.
The Committee for the Ethics in Re-search of Hospital de Clínicas de Porto Alegre approved the research project and all partici-pants gave signed consent after the nature of the procedures had been fully explained.
Brain ratios were determined from CT scans using a standard technique (12,19,20) by measuring distances and areas of some regions of interest adjusted to brain size. The measures used were the ventricle-brain (VBr), bicaudate (BCr), bifrontal (BFr), su-prasellar cistern (SSCr), and third-ventricle (IIIVr) ratios. BCr is CC divided by the distance between the inner tables of the skull at CC, and BFr is FH divided by the distance between the inner table of the skull at the FH line (21-26). SSCr is the area of the suprasel-lar cistern divided by the brain area (at the level of frontal horns) (19,27). VBr was obtained by dividing the lateral ventricle area by the brain area (at the same level) (28).
The scans were obtained approximately 15o to the canthomeatal line starting at the level of the chiasmatic cistern and proceeding to the level of the superficial sulci at the vertex. We obtained approximately 12 slices per subject (8 mm thick). The radiologist who performed the exams was blind to diagnosis of subjects.
Data were analyzed statistically by the Student t-test for independent samples,
one-way ANOVA followed by the Tukey test and MANOVA with covariance and multi-variate procedures (29,30). All variables were submitted to a pegboard test (normal prob-ability plot) before being analyzed by MANOVA (30). MANOVA coefficients (re-verse Helmert) were used for the identifica-tion of differences (a positive coefficient expresses greater mean among the class fac-tor of higher order). Sensitivity and specific-ity analysis of brain ratios, as well as the Mantel-Haenszel chi-square test (Yates cor-rected and exact confidence limits due to the small size of the sample) were applied to patients with dementia and aging patients (31,32). Cutoff points for brain ratios were obtained by analysis of Gaussian distribu-tions for multiples of the median (the ob-served measure was divided by the expected value, controlled for age) and receiver oper-ating characteristic curves (33).
Re sults
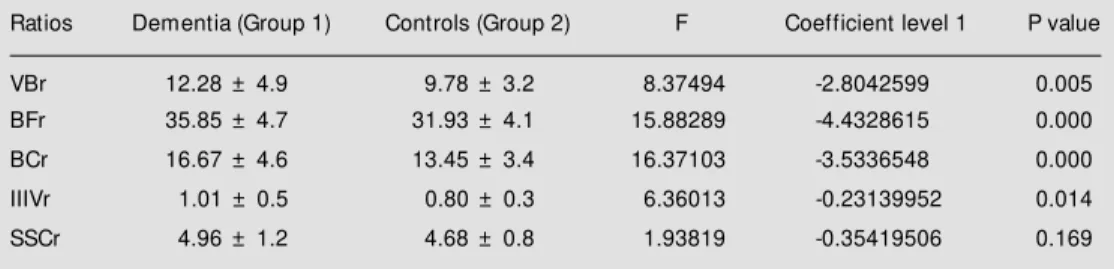
Table 1 shows the analyses of brain ra-tios controlled for the age effect for demen-tia and normal controls. All but SSCr were higher in dementia patients. Bi-caudate, bi-frontal and ventricle-brain ratios presented salient magnitudes among dementia subjects, but not among normal individuals, suggest-ing more diffuse, telencephalic and dien-cephalic losses of tissue from the CNS of dementia patients.
Brain ratios from Alzheimer and vascu-lar patients were not significantly different (MANOVA, age controlled). Covariance
a-nalysis showed significant regression of VBr (B = 0.177, beta = 0.427, P = 0.001), IIIVr (B = 0.018, beta = 0.458, P = 0.000), SSCr (B = 0.034, beta = 0.326, P = 0.011), and BCr (B = 0.225, beta = 0.555, P = 0.000) with age.
Performances in the Mini-Mental test were different between groups, and were impaired in dementia patients (Alzheimer and vascular). The range of scores within the dementia groups suggested moderate to se-vere levels of impairment (34). Alzheimer patients presented lower scores than multi-infarct patients. The analysis of cognitive performance between subgroups of patients defined by Mini-Mental cutoffs demonstrated significantly lower performance for digit span, famous faces, visual recognition, nam-ing, abstraction and calculation among se-verely impaired patients than among moder-ately impaired patients, regardless of diag-nosis (MANOVA, P<0.05).
Age, educational level (one-way ANOVA followed by the Tukey test, P>0.05) and social conditions (Mantel-Haenszel chi-square with Yates correction, P>0.05) were similar for all groups.
Brain ratios were compared among nor-mal aging subjects (Table 2). The BCr was significantly different among the 3 groups, with the oldest, group 3, having higher di-mensions than group 2, which had higher dimensions than group 1. Age group 3 (older subjects) presented higher third ventricle and suprasellar ratios than groups 1 and 2, while no differences were observed between the latter two groups in these measures. VBr and BFr were similar for all age groups.
The suprasellar cistern ratio did not dif-fer between dementia and controls, or a-mong age groups and dementia patients (as the fourth class of factor) by a multivariate MANOVA (Table 3).
(1 = upper low and lower middle; 2 = middle and upper middle), showed a significant ef-fect on SSCr (F = 4.51203; P = 0.038; coef-ficient = 0.370767), while VBr, IIIVr, BFr, and BCr did not (F = 1.53198, P = 0.219; F = 0.15887, P = 0.692; F = 1.10917, P = 0.297; F = 0.45959, P = 0.501, respectively). We
did not observe any further effect of age or social conditions on brain ratios (VBr: F = 1.67192, P = 0.184; IIIVr: F = 1.36200, P = 0.264; SSCr: F = 0.51732, P = 0.672; BFr: F = 1.04661, P = 0.380; BCr: F = 0.78754, P = 0.506).
The scores for the Mini-Mental test were
Table 1 - Brain ratios obtained for dementia patients and normal controls (M ANOVA F-values, coefficients of the tw o-level factor comparison, and P value).
Results are reported as means ± SD. VBr: Ventricle brain ratio; BFr: bifrontal ratio; BCr: bicaudate ratio; IIIVr: third ventricle ratio; SSCr: suprasellar cistern ratio.
Ratios Dementia (Group 1) Controls (Group 2) F Coefficient level 1 P value
VBr 12.28 ± 4.9 9.78 ± 3.2 8.37494 -2.8042599 0.005
BFr 35.85 ± 4.7 31.93 ± 4.1 15.88289 -4.4328615 0.000
BCr 16.67 ± 4.6 13.45 ± 3.4 16.37103 -3.5336548 0.000
IIIVr 1.01 ± 0.5 0.80 ± 0.3 6.36013 -0.23139952 0.014
SSCr 4.96 ± 1.2 4.68 ± 0.8 1.93819 -0.35419506 0.169
Table 2 - Brain ratios obtained for normal controls: age groups (M ANOVA multivariate F-values, coefficients of each tw o-level factor comparison w ith significance, and P value for the 3 levels).
Results are reported as means ± SD. Age 1: 50-60 years; age 2: 61-70 years; age 3: 71-90 years; VBr: ventricle brain ratio; BFr: bifrontal ratio; BCr: bicaudate ratio; IIIVr: third ventricle ratio; level 1: comparison betw een age 1 and age 2; level 2: comparison betw een age 3 and ages 1 and 2.
Variable Age 1 Age 2 Age 3 F Coefficient P value
Level 1 Level 2
VBr 8.63 ± 2.40 9.46 ± 2.66 11.49 ± 4.81 2.22333 0.3747 (0.773) 2.5376 (0.049) 0.124
BFr 30.98 ± 4.08 31.17 ± 4.64 34.05 ± 4.29 1.70060 -0.0319 (0.076) 2.9593 (0.985) 0.198
BCr 11.01 ± 2.46 14.64 ± 2.25 15.62 ± 4.60 6.80377 2.8602 (0.024) 2.9947 (0.015) 0.003
IIIVr 0.66 ± 0.18 0.78 ± 0.30 1.07 ± 0.46 5.28714 0.1131 (0.364) 0.3558 (0.005) 0.010
Table 3 - Suprasellar cistern ratios (SSCr) for the dementia and age groups of normal controls (M ANOVA multivariate F-values, coefficients of each tw o-level factor comparison w ith significance and P value of the 3 levels).
Results are reported as means ± SD. Age 1 = 50 to 60 years; Age 2 = 61 to 70 years; Age 3 = 71 to 90 years; SSCr: suprasellar cistern ratio; level 1: comparison betw een age groups 1 and 2; level 2: comparison betw een age group 3 and groups 1 and 2; level 3: comparison betw een dementia group and age groups 1, 2 and 3.
Age 1 Age 2 Age 3 Dementia F Coefficient P value
Level 1 Level 2 Level 3
SSCr 4.31 ± 0.71 4.69 ± 0.69 5.25 ± 0.95 4.96 ± 1.23 2.225 0.3798 0.753 0.248 0.095
similar for age groups 1, 2, and 3 of normal controls, but were significantly lower among dementia patients (Alzheimer and vascular). Complete cognitive evaluation showed no significant differences between age groups. This indicates normal cognitive function in-dependent of changes in brain size produced by aging.
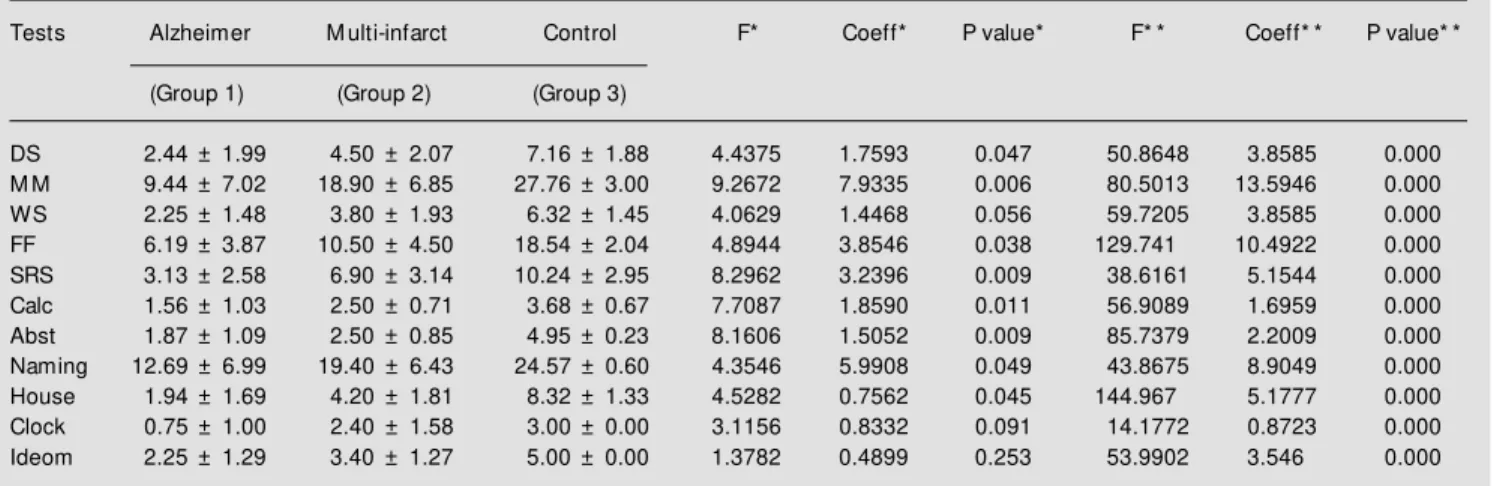
Neuropsychological evaluation showed marked differences in all cognitive tests be-tween dementia and normal controls by MANOVA controlled for age and educa-tion. Dementia patients presented lower scores in the cognitive tests. Comparisons between the Alzheimer and multiinfarct groups demonstrated (Table 4) significantly lower test performances for the first group.
Covariance analysis showed significant regressions between years of schooling and Mini-Mental state examination (B = 0.389, beta = 0.336, P = 0.010) and calculation (B = 0.091, beta = 0.259, P = 0.043). Age was correlated with digit span (B = -0.054, beta = -0.281, P = 0.036), word span (B = -0.050, beta = -0.325, P = 0.015), calculation (B = -0.052, beta = -0.341, P = 0.009), copy of the house (B = -0.023, beta = -0.291, P = 0.031), and copy of the clock (B = -0.032, beta =
-0.374, P = 0.005). The other tests did not present significant regressions for age and/ or schooling.
D iagno stic value o f ratio s and
ne uro psycho lo gical e valuatio n
Cutoff values for brain ratios obtained by Gaussian distribution of multiples of the median were: 1) VBr: 12.00, 2) BCr: 15.00, 3) BFr: 34.00, 4) IIIVr: 1.00, and 5) SSCr: 5.00.
The sensitivity and specificity of the ra-tios are shown in Table 5. The sensitivity of the brain ratios was low for all measures, although specificity was higher. This was observed especially when dementia patients were compared to control age group 1 (younger individuals) (Table 6).
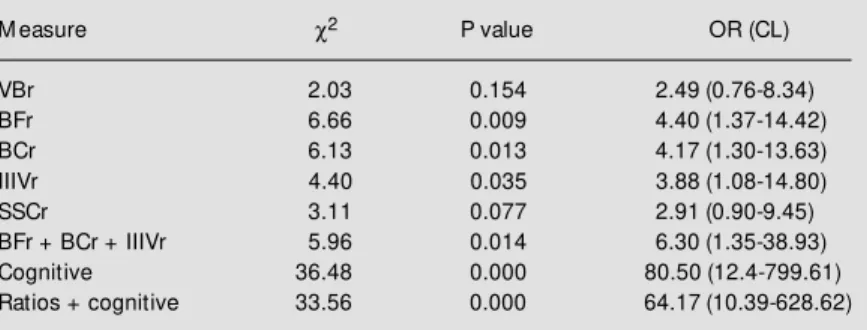
We evaluated the correlation of the diag-nosis of dementia with the brain ratios by the Mantel-Haenszel chi-square test with Yates correction. Each brain measure was tested individually and was followed by stepwise analysis (32) (Table 7). Individual analysis presented higher associations between BCr, BFr and IIIVr with the diagnosis of demen-tia, and the stepwise analysis showed an
Table 4 - Results of the neuropsychological evaluation (Alzheimer, multiinfarct and normal volunteers) reported as mean ± standard deviation (controlled for age and years of education) (M ANOVA F-values, coefficients of the tw o-level factor comparison, and P value).
Coeff = Coefficient; DS = digit span; M M = M ini-M ental; WS = w ord span; FF = famous faces; SRS = spatial recognition span; Calc = calculation; Abst = abstraction; Ideom = ideomotor. * Comparison betw een Alzheimer and multiinfarct patients; * * comparison betw een dementia (Alzheimer and multiinfarct together) and normal controls.
Tests Alzheimer M ulti-infarct Control F* Coeff* P value* F* * Coeff* * P value* *
(Group 1) (Group 2) (Group 3)
DS 2.44 ± 1.99 4.50 ± 2.07 7.16 ± 1.88 4.4375 1.7593 0.047 50.8648 3.8585 0.000
M M 9.44 ± 7.02 18.90 ± 6.85 27.76 ± 3.00 9.2672 7.9335 0.006 80.5013 13.5946 0.000
WS 2.25 ± 1.48 3.80 ± 1.93 6.32 ± 1.45 4.0629 1.4468 0.056 59.7205 3.8585 0.000
FF 6.19 ± 3.87 10.50 ± 4.50 18.54 ± 2.04 4.8944 3.8546 0.038 129.741 10.4922 0.000
SRS 3.13 ± 2.58 6.90 ± 3.14 10.24 ± 2.95 8.2962 3.2396 0.009 38.6161 5.1544 0.000
Calc 1.56 ± 1.03 2.50 ± 0.71 3.68 ± 0.67 7.7087 1.8590 0.011 56.9089 1.6959 0.000
Abst 1.87 ± 1.09 2.50 ± 0.85 4.95 ± 0.23 8.1606 1.5052 0.009 85.7379 2.2009 0.000
Naming 12.69 ± 6.99 19.40 ± 6.43 24.57 ± 0.60 4.3546 5.9908 0.049 43.8675 8.9049 0.000
House 1.94 ± 1.69 4.20 ± 1.81 8.32 ± 1.33 4.5282 0.7562 0.045 144.967 5.1777 0.000
Clock 0.75 ± 1.00 2.40 ± 1.58 3.00 ± 0.00 3.1156 0.8332 0.091 14.1772 0.8723 0.000
increase of association with dementia, with an odds ratio of 6.30 (Mantel-Haenszel odds ratio, with exact confidence limits).
We used the same technique to analyze the association of cognitive performance with dementia, whose cutoffs were previously studied for detection of dementia produced by organic diseases (i.e., Alzheimer, vascu-lar, Parkinson, etc.) (11). We applied a mul-tiple parallel strategy for test positivity (50% + 1 tests should be positive, i.e., below cut-off) to identify positive individuals for cog-nitive deficit (11,35). The association ob-served by this method was higher, as also was the odds ratio (Table 7). The sensitivity of cognitive performance was 87% and the specificity 98%.
To increase the effectiveness of the par-allel strategy we mixed cognitive tests and brain ratios; however, sensitivity, specificity and odds ratio were lower than cognitive tests alone (Table 7). Sensitivity was 76% and specificity 90%.
D iscussio n
CT and MRI, which are currently the most commonly used imaging techniques, provide optimal visualization of brain im-ages. CT and especially MRI should recog-nize and differentiate the changes seen in normal aging from pathological brain anoma-lies. However, those demonstrated by CT and MRI in the most commonly encountered types of dementia are still poorly specific and never pathognomonic. Some authors have suggested that CT and MRI should be promptly performed in demented patients in order to rule out diseases curable by surgery, which CT and MRI demonstrate particularly well (36), although they infrequently cause dementia.
The present results suggest diffuse losses of CNS tissue, especially related to the dis-tribution of cerebrospinal fluid (CSF) in mentia patients. Ratios were higher in de-mentia patients, except for the suprasellar
Table 7 - Analysis of brain measure correlations, individually and in a stepw ise-stratified w ay (dementia and controls).
Cognitive measures: M ini-M ental, digit span, w ord span, famous faces, calculation, abstraction and praxis. Ratios + cognitive measures: combination of brain measures (BFr, BCr, IIIVr) and cognitive tests in a multiple parallel w ay. c2 = Chi-square (M antel-Haenszel). OR (CL) = odds ratio and confidence limits. For abbreviations, see legend to Table 1.
M easure c2 P value OR (CL)
VBr 2.03 0.154 2.49 (0.76-8.34)
BFr 6.66 0.009 4.40 (1.37-14.42)
BCr 6.13 0.013 4.17 (1.30-13.63)
IIIVr 4.40 0.035 3.88 (1.08-14.80)
SSCr 3.11 0.077 2.91 (0.90-9.45)
BFr + BCr + IIIVr 5.96 0.014 6.30 (1.35-38.93)
Cognitive 36.48 0.000 80.50 (12.4-799.61)
Ratios + cognitive 33.56 0.000 64.17 (10.39-628.62)
Table 6 - Sensitivity and specificity of brain ratios (dementia and controls by age groups).
1 - Dementia x age group 1; 2 - Dementia x age group 2; 3 - Dementia x age group 3. For abbrevia-tions, see legend to Table 1.
Ratio Sensitivity Specificity
1 2 3 1 2 3
VBr 44 44 44 87 77 56
BCr 61 61 61 93 54 67
BFr 68 68 68 80 69 44
IIIVr 43 43 43 93 92 56
SSCr 52 52 52 93 62 56
Table 5 - Sensitivity and specificity of brain ratios comparing dementia patients to normal controls.
For abbreviations, see legend to Table 1.
Ratio Sensitivity Specificity
VBr 44 76
BCr 39 73
BFr 32 78
IIIVr 57 84
SSCr 48 73
either SSCr is not influenced by Alzheimers or multiinfarct dementias, or the changes produced by aging beyond a threshold (age and/or tissue involvement) also include the mesial temporal region. This second hypoth-esis seems more appropriate and may sup-port the conclusion of Kasahara and co-workers (38) that some changes seemingly representing physiological aging might be promoted by pathologic processes.
Most studies employing CT demonstrate highly significant increases in the distribu-tion of CSF in patients with Alzheimers disease (39). The regions that showed the greatest difference were the lateral and third ventricles (40,41) and parts of the temporal lobe, such as the CSF areas around the Sylvian fissures and the tips of the temporal horns (42,43). Alzheimers, but not Huntingtons, disease affects the suprasellar cistern (12), suggesting that atrophy of the frontal-tempo-ral basal forebrain areas could be associated with cognitive decline in Alzheimers dis-ease (12). A technique to estimate CSF vol-umes from CT scans in Alzheimer patients and normal elderly individuals was evalu-ated in a longitudinal design (44). The rate of CSF volume showed greater annual increases among Alzheimers disease patients than among elderly individuals. The enlargement was region specific, with marked annual changes occurring in the ventricular system and the Sylvian fissures. Younger patients showed more rapid progression in the ven-tricular and frontal sulcal regions than did older patients.
MRI scans may be used to distinguish possible parenchymal abnormalities between different dementia processes. A study car-ried out on patients with probable Alzhei-mers disease, vascular dementia, and nor-mal controls with MRI scans showed signif-icantly more abnormalities (thromboembo-lic infarctions, confluent white matter, and irregular periventricular hyperintensities) in vascular dementia than in the other subsets. Signal abnormalities on intermediate
T2-weighted scans in the uncal-hippocampal or insular cortex were frequent and almost ex-clusive in Alzheimers disease. Moderate and severe cortical and ventricular atrophy and a third ventricular to intracranial width ratio higher than 7% were good discrimina-tors between demented groups and normally aging controls. Selective atrophy measure-ments, however, failed to separate dementia syndromes, but the authors suggested that MRI has the potential to increase the accu-racy of the clinical diagnosis of Alzheimers disease and vascular dementia (45). Never-theless, the small number of normal controls could be criticized for these conclusions re-lated to normal aging.
risk factors are transient ischemic attacks, hypertension, heart disease, hyperlipidemia, smoking, heavy alcohol consumption, male gender, low educational status, family his-tory of cerebrovascular disease and absence of estrogen replacement therapy among women. Brain degenerative alterations meas-ured by neuroimaging may be premorbid markers for depleted neuronal and synaptic reserves, which predispose to the onset of dementia of both vascular and Alzheimer types (46). Normal subjects at risk for cogni-tive decline include those with transient is-chemic attacks, hypertension and heart dis-ease, because these risk factors accelerate cerebral atrophy, ventricular enlargement, leukoaraiosis, and a decline in cortical per-fusion. However, the findings of the present study did not show a significant effect of health or social conditions on brain degen-eration or function. The main interpretation of this result is that elderly controls were in very good health, and patients presented ei-ther clear probable Alzheimer diagnosis (i.e., exclusion of co-morbidity) or vascular dis-ease.
The analysis of case detection by brain measures and/or cognitive evaluation is the main clinical application of the present find-ings. Although brain ratios produce interest-ing data for the purpose of research on patho-logical mechanisms of dementing illnesses, their clinical impact is not very high. Cogni-tive evaluation still seems the best method to screen individuals from the community for detection of intellectual decline and demen-tia, independent of the quality of the health system. For developing countries like Brazil, the cost of investigation with brain imaging should be avoided for screening and initial assessment of dementia, and may be carried out during the further process of diagnosis confirmation. The Agency for Health Care Policy and Research of the US Department of Health and Human Service strongly sup-ports the use of clinical methods (focused history, focused physical examination, and
assessments of functional and mental status) for this purpose (35). The mental status is the most critical component of physical exami-nation.
There is evidence suggesting an impor-tant role for a measure of the medial tempo-ral lobe as a screening test to detect Alzheimers disease (47). Whether atrophy of the medial temporal lobe could be de-tected in life in patients, for whom a diagno-sis of Alzheimers disease was subsequently established by histopathological examina-tion, was the aim of the present study. The minimum width of the medial temporal lobe was measured by temporal-lobe-oriented CT about one year before death. Although lim-ited, there was overlap in the distribution of measures of cases and controls. Two cutoff values (<0.79 and <0.70) yielded 5 and 1% false-positive rates (specificity of 95 and 99%) and gave expected detection rates (sen-sitivity) of 92 and 79%. Among non-Alzheimer dementia patients (non-Alzheimers disease histopathologically excluded, but not clinically excluded), the ratio was signifi-cantly different from that observed in Alz-heimer patients, but was not different from that observed in controls. The ratio showed high specificity for Alzheimers disease and has been suggested to play the role of a screening tool. Screenings are tests of very high sensitivity, because they are expected to identify all real cases in the community even if false-positives are also screened (not so high specificity). This is almost the oppo-site of what was observed by Jobst and co-workers (47). Furthermore, screening indi-viduals from the community is usually the process of identification of mild cases, which increases the difficulty for this type of test. What will happen for the negative non-Alz-heimer demented individuals in the commu-nity after the test? Moreover, how do very mild, initial cases of Alzheimer patients per-form five or more years before death?
al-though its diagnostic accuracy must be prop-erly evaluated. The use of expensive tests (CT scanning) for first detection of suspected cases, i.e., as a screening test instead of a confirmation test (gold standard), should be extensively studied. Comparison of this method with neuropsychological evaluation may be imperative. The possibility of screen-ing demented individuals from the commu-nity by cognitive tests will always be less time and money consuming. Any health pro-fessional can be trained for this purpose and be able to correctly apply these instru-ments.
Another issue of interest is the determi-nation of the place of brain structure alter-ations related to abnormal cognitive func-tion in non-demented elderly people. Fac-tors such as systemic diseases (hyperten-sion, diabetes, coronary diseases, etc.) and social conditions must be better analyzed in community-based samples especially from various cultures. Definition of their role in determining brain dysfunction is very im-portant for an understanding of the develop-ment of abnormal cognitive function in the elderly (differentiation between normal se-nescence from vascular dementia).
Co nclusio ns
1) The data suggest diffuse losses of CNS tissue in dementia patients, especially re-lated to the distribution of cerebrospinal fluid; 2) the similarities observed in the medial temporal region observed in the aged and dementia groups suggest that the changes produced by aging beyond a threshold (age and/or tissue involvement) may also include this region; 3) dementia patients showed great cognitive impairment compared to con-trols; 4) cognitive performance did not show the influence of aging among normal con-trols. With the appearance of disease, like Alzheimers or multiinfarct, critical regions for cognitive function are affected progres-sively to the point of clinical manifestations; 5) diagnostic values of brain ratios were low (for IIIVr, sensitivity was 57% and specific-ity 84%), although interesting for research on pathological mechanisms of dementing illnesses, and 6) cognitive evaluation proved to be the best index for case detection (87% sensitivity and 98% specificity) and seems to be the best method to screen individuals from the community.
Re fe re nce s
1. Evans W (1942). An encephalographic ra-tio for estimating ventricular enlargement and cerebral atrophy. Archives of Neurol-ogy and Psychiatry, 47: 931-937. 2. Aylw ard EH, Li Q, Habbak QR, Warren A,
Pulsif er M B, Bart a PE, Jerram M & Pearlson G (1997). Basal ganglia volume in adults w ith Dow n syndrome. Psychia-try Research, 74: 73-82.
3. Cummings JL & Benson DF (1983). De-m ent ia: A Clinical Approach. But t er-w orths, Boston.
4. Friedland RP (1993). Epidemiology, edu-cation, and the ecology of Alzheimer’s disease. Neurology, 43: 246-249. 5. M cKhann G, Drachman D, Folstein M ,
Katzman R, Price D & Stadlan EM (1984). Clinical diagnosis of Alzheimer’s disease: report of NINCDS-ADRDA w ork group un-der the auspices of Department of Health and Hum an Services Task Force on
Alzheimer’s disease. Neurology, 34: 939-944.
6. Román GS, Tatemichi TK, Erkinjuntti T, Cummings JL, M asdeu JC, Garcia JH, Amaducci L, Orgogozo JM , Brun A & Hofman A (1993). Vascular dementia: di-agnostic criteria for research studies (NINDS-AIREN). Neurology, 43: 250-260. 7. Gustafson L (1992). Clinical classification
of dementia conditions. Acta Neurologica Scandinavica, S139: 391-399.
8. Hachinski VC, Iliff LD, Zilkha E, Du Boulay GH, M cAllister VL, M arshall J, Russell RW & Symon L (1975). Cerebral blood flow in dementia. Archives of Neurology, 32: 632-637.
9. Blessed G, Tom linson BE & Roth M (1968). The association betw een quanti-tative measures of dementia and senile change in the cerebral gray matter of eld-erly subjects. British Journal of
Psychia-try, 114: 797-811.
10. Chaves M LF & Izquierdo I (1992). Differ-ential diagnosis betw een dementia and depression: a study of efficiency incre-ment. Acta Neurologica Scandinavica, 85: 378-382.
11. Chaves M LF, Bianchin M , Peccin S, Rotta F, Jardim C, Gianiup A & Eidt L (1993). Chronic use of benzodiazepines and cog-nitive complaints: a risk factor study. Ital-ian Journal of Neurological Sciences, 14: 429-435.
12. Aylw ard EH, Schw artz J, M achlin S & Pearlson G (1991). Bicaudate ratio as a measure of caudate volume on M R im-ages. American Journal of Neuroradiol-ogy, 12: 1217-1222.
func-tion in normal subjects. International Jour-nal of M ethods in Psychiatric Research, 5: 195-203.
14. Folstein M , Folstein S & M cHugh P (1975). M ini-M ental state: a practical method for measuring the cognitive state of patients for the clinician. Journal of Psychiatric Research, 12: 189-198. 15. Henderson VW, Wendy M & Williams BW
(1989). Spatial disorientation in Alzhei-mer’s disease. Archives of Neurology, 46: 391-394.
16. Kaplan E, Goodglass H & Weintraub ST (1976). Boston Naming Test, Experimen-tal Edition. Veterans Administrations Hos-pital, Boston.
17. Rebok G, Brandt J & Folstein I (1990). Logitudinal Cognitive Decline in patients w ith Alzheimer’s disease. Journal of Geri-atric Psychology and Neurology, M osby-Year Book, Inc. 3: 91-97.
18. Lombardi C, Bronfman M , Facchini LA, Victora CG, Barros FC, Béria JU & Teixeira AM (1988). Operacionalização do conceito de classe social em estudos epidemioló-gicos. Revista de Saúde Pública de São Paulo, 22: 253-265.
19. Aylw ard EH, Karagiozis H, Pearlson G & Folstein M F (1991). Suprasellar cistern measures as a reflection of dementia in Alzheimer’s disease but not Huntington’s disease. Journal of Psychiatric Research, 25: 31-47.
20. Ford C & Winter J (1981). Computerized axial tomograms and dementia in elderly patients. Journal of Gerontology, 36: 164-169.
21. Largen JW , Sm it h RC, Calderon M , Baumgartner R, Lu RB, Schoolar JC & Ravichandran GK (1984). Abnormalities of brain structure and density in schizophre-nia. Biological Psychiatry, 19: 991-1013. 22. Starkstein S, Folstein S, Brandt J, Pearlson
G, M cDonnell A & Folstein I (1989). Brain atrophy in Huntington’s disease: a CT-scan study. Neuroradiology, 31: 156-159. 23. Starkstein S, Brandt J, Folstein S, Strauss M , Berthier M L, Pearlson GD, Wong D, M cDonnell A & Folstein M (1988). Neuro-psychological and neuroradiological corre-lates in Huntington’s disease. Journal of Neurology, Neurosurgery and Psychiatry, 51: 1259-1263.
24. Woods B & Wolf J (1983). A reconsidera-tion of the relareconsidera-tion of ventricular enlarge-ment to duration of illness in schizophre-nia. American Journal of Psychiatry, 140: 1564-1570.
25. Pearlson GD, Warren A, Starkstein SE, Aylw ard EH, Kumar AJ, Chase GA & Folstein M F (1990). Brain atrophy in 18
patients w ith Dow n syndrom e: a CT study. American Journal of Neuroradiol-ogy, 11: 811-816.
26. Folstein M , Brandt J & Starkstein S (1990). Cognition in Huntington’s disease: char-acteristics and correlates. In: Franks A, Ironside J, M indham R, Smith R, Spokes E & Wilow W (Editors), Function and Dys-function in the Basal Ganglia. University Press, M anchester, 224-229.
27. LeM ay M (1986). VT changes in dementing diseases: a review . American Journal of Radiology, 147: 963-975. 28. Pearlson G, Kim W, Kubos KL, M oberg
PJ, Jayaram G, Bascom M , Chase G, Goldfinger A & Tune L (1989). Ventricle-brain ratio, computed tomographic den-sity, and brain area in 50 schizophrenics.
Archives of General Psychiatry, 46: 690-697.
29. Fleiss JL (1986). The Design and Analysis of Clinical Experiments. Wiley, New York. 30. Norusis M J (1986). Statistical Package for Social Sciences (SPSS)/PC for the IBM PC/XT/AT. SPSS Inc., Chicago.
31. Schlesselman JJ (1982). Case-Control Studies. Oxford University Press, New York.
32. M antel N & Haenszel W (1959). Statistical aspects of the analysis of data from retro-spective studies of disease. Journal of the National Cancer Institute, 22: 719-748. 33. Fletcher RH, Fletcher SW & Wagner EH (1996). Epidemiologia Clínica: Bases da Conduta M édica. Editora Artes M édicas, Porto Alegre.
34. Tombaugh TN & M cIntyre NJ (1992). The M ini-M ental state examination: a compre-hensive review . Journal of the American Geriatric Society, 40: 922-935.
35. Costa Jr PT, Williams TF, Somerfield M , Albert M , Folstein M , Gilman S, Gurland BJ, Gw yther LP, Heyman A, Kaszniak AW, Katz I, Lanska D, Levy LL, Lombardo N & Storandt M (1996). Recognition and Initial Assessment of Alzheimer’s Disease and Relat ed Dem ent ias. Clinical Pract ice Guideline No. 19. U.S. Department of Health and Human Services, Public Health Service, Agency for Health Care Policy and Research (AHCPR). Rockville, M D, Publication No. 97-0702. November, 56. 36. Baleriaux D, Widelec J & Aguilera Grijalvo
C (1989). The contribution of computer-ized tomography and M RI in the diagno-sis of degenerative dementia. Acta Neu-rologica Belgica, 89: 156-160.
37. Sandor T, Albert M , Sttaford J & Harpley S (1988). Use of computerized CT analysis to discriminate betw een Alzheimer’s pa-tients and normal control subjects.
Ameri-can Journal of Neuroradiology, 9: 1181-1187.
38. Kasahara H, Yam ada H, Tanno M , Kobayashi M , Karasaw a A, Endo K & Ushijima S (1995). M agnetic resonance imaging study of the brain in aged volun-teers: T2 high intensity lesions and higher order cortical function. Psychiatry and Clinical Neuroscience, 49: 273-279. 39. Sandor T, Jolesz F, Tieman J, Kikinis R,
Jones K & Albert M (1992). Comparative analysis of computed tomographic and magnetic resonance imaging scans in Alzheimer’s patients and controls. Ar-chives of Neurology, 49: 381-384. 40. Gado M , Hughes CP, Danziger W & Chi D
(1983). Aging, dementia and brain atro-phy: a longitudinal computed tomography study. American Journal of Neuroradiol-ogy, 4: 699-702.
41. Albert M , Naeser M A, Levine HL & Garvey AJ (1984). Ventricular size in patients w ith presenile dementia of the Alzheimer type.
Archives of Neurology, 41: 1258-1263. 42. LeM ay M , Stafford J, Sandor T, Albert M ,
Haykal H & Samani A (1986). Statistical assessment of perceptual CT scan ratings in patients w ith Alzheimer type dementia.
Journal of Computer Assisted Tomogra-phy, 10: 802-809.
43. George AE, deLeon M J, Stylopouos LA, M iller J, Kluger A, Smith G & M iller DC (1990). CT diagnostic features of Alzhei-mer’s disease: importance of the choroi-dal/hippocampal fissure complex. Ameri-can Journal of Neuroradiology, 11: 101-107.
44. Shear PK, Sullivan EV, M athalon DH, Lim KO, Davis LF, Yesavage JA, Tinklenberg JR & Pfefferbaum A (1995). Longitudinal volumetric computed tomographic analy-sis of regional brain changes in normal aging and Alzheimer’s disease. Archives of Neurology, 52: 392-402.
45. Schmidt R (1992). Comparison of mag-netic resonance imaging in Alzheimer’s disease, vascular dementia and normal aging. European Neurology, 32: 164-169. 46. M eyer JS, Terayama Y, Konno S, Akiyama H, M argishvili GM & M ortel KF (1998). Risk factors for cerebral degenerative changes and dementia. European Neurol-ogy, 39 (Suppl 1): 7-16.