(COPEPODA: CALANOIDA) IN THE CAETÉ RIVER
ESTUARY (AMAZON REGION - NORTH OF BRAZIL)
MAGALHÃES, A., COSTA, R. M., LIANG, T. H., PEREIRA, L. C. C. and RIBEIRO, M. J. S.
Laboratório de Plâncton e Cultivo de Microalgas, Campus de Bragança, Universidade Federal do Pará, Alameda Leandro Ribeiro, s/n, Aldeia, CEP 68600-000, Bragança, PA, Brazil
Correspondence to: André Magalhães, Laboratório de Plâncton e Cultivo de Microalgas, Campus de Bragança, Universidade Federal do Pará, Alameda Leandro Ribeiro, s/n, Aldeia, CEP 68600-000,
Bragança, PA, Brazil, e-mail: [email protected]
Received May 18, 2004 – Accepted August 31, 2004 – Distributed May 31, 2006 (With 5 figures)
ABSTRACT
Spatial and temporal density and biomass distribution of the planktonic copepods Pseudodiaptomus richardi and P. acutus along a salinity gradient were investigated in the Caeté River Estuary (North-Brazil) in June and December, 1998 (dry season) and in February and May, 1999 (rainy season). Copepod biomass was estimated using regression parameters based on the relation of dry weight and body length (prosome) of adult organisms. The Caeté River Estuary was characterized by high spatial and temporal variations in salinity (0.8-37.2‰). Exponential length-weight relationships were observed for both Pseudodiaptomus species. Density and biomass values oscillated between 0.28-46.18 ind. m-3 and 0.0022-0.3507 mg DW. m-3
for P. richardi; and between 0.01-17.02 ind. m-3 and 0.0005-0.7181 mg DW. m-3 for P. acutus. The results showed that the contribution of P. richardi for the secondary production in the Caeté River Estuary is more important in the limnetic zone than in other zones where euhaline-polyhaline regimes were predominant. However, it was not possible to observe a clear pattern of spatial and temporal distributionfor P. acutus. Keywords: Pseudodiaptomus, Caeté River Estuary, biomass, spatial and temporal distribution, Brazil.
RESUMO
Variação espacial e temporal da densidade e biomassa de duas espécies de Pseudodiaptomus (Copepoda, Calanoida) no estuário do rio Caeté (Região Amazônica - Norte do Brasil)
INTRODUCTION
Among other organisms, copepods are involved in the turnover of nutrients and regulation of phytoplanktonic populations on which they feed. As part of the food chain, they contribute to transferring energy and organic matter from the primary producers to the main consumers of the aquatic system, including various fish species of commercial value (Parsons et al., 1984). Recent studies have also highlighted the role of copepods when using carbon produced by the microbial loop (Pace & Cole, 1996; Champalbert & Pagano, 2002; Osidele & Beck, 2004).
Planktonic copepods of the Pseudodiaptomus genus are worldwide distributed and commonly found in estuarine waters (Walter, 1986). Along the Brazilian coastline, four species (Pseudodiaptomus richardi Dahl, Pseudodiaptomus acutus Dahl, Pseudodiaptomus marshi Wright and Pseudodiaptomus gracilis Dahl) were recorded (Björnberg, 1981). Among them, P. richardi and P. acutus were noted to be widely distributed, spreading in many tropical and subtropical Brazilian estuarine waters from the Tocantins River Estuary, Pará (Cipólli & Carvalho, 1973), North of Brazil, to the Patos Lagoon, Rio Grande do Sul (Montú, 1980), South of Brazil.
Spatial and temporal studies of copepod biomass, production and distribution, are of major importance to assess copepods 1) contribution in the production and flux of particulate/ dissolved organic matter and 2) role in estuary trophodynamics (Froneman, 2001; Perissinotto et al., 2003). Copepods are also known as key factors in controlling fish stock size (Payne & Rippingale, 2001; Evjemo et al., 2003). From the larval to the adult stage, they constitute a major component in the diet of numerous zooplanktophage fish (Nielsen & Munk, 1998; Xie & Yang, 2000).
Most studies on copepods from the North Brazilian coast focused mainly on the specific composition of these organisms (Wright, 1936a,b; Calef & Grice, 1967), providing little data on copepod biomass and production in Amazonian estuaries. The aim of the present work is to study spatial and temporal distribution patterns in terms of density and biomass of two species of planktonic copepods (P. richardi and P. acutus), regarding the salinity gradient in the Caeté River Estuary.
MATERIAL AND METHODS
Study area
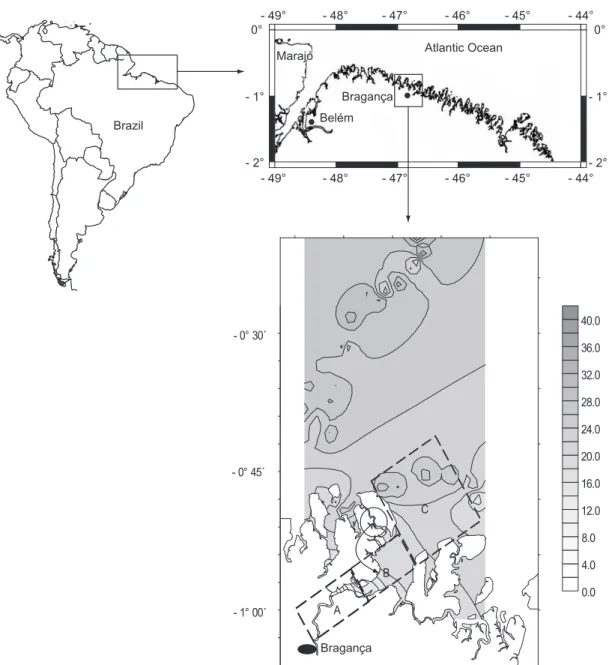
The Caeté River Estuary (0° 45’ - 1° 07’ S and 46° 50’ - 46° 30’ W), in the municipality of Bragança (Pará-Brazil), is situated approximately 150 km south of the Amazon River Delta and is a permanently open estuary characterized by high turbidity and shallow waters of approximately 10 m depth (Lara, 2003). It is dominated by a semi-diurnal tidal cycle, with tides ranging between 2.5 and 5.5 m. The Caeté River is 100 km long, with a freshwater catchment basin of 3.000 km2
(Schwendenmann, 1998) and a flooded area of approximately 110 km2 (Cohen et al., 1999). The
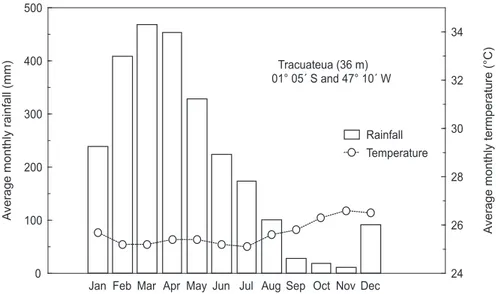
climate is equatorially humid, with a rainy season that usually extends from January to May, while the dry or less rainy season is from June to December. This seasonal pattern is a result of the convergence zone drift above the region. Long-term data from the Tracuateua Meteorological Station located 50 km south-west of Bragança are presented (Fig. 1). Annual average rainfall and temperature are about 2,500 mm and 25.5 °C, respectively, with 75% of the precipitation falling in the rainy season (INMET, 1992). The discharge of the Caeté River ranges from 180 m3. s-1 in the rainy season
to 0.3 m3. s-1 in the dry season (Lara & Dittmar,
1999).
Sampling methods
The sampling area was divided into three regions, according to the salinity gradient of the estuary: upper (A), middle (B) and lower estuary (C) (Fig. 2).
Three replicates were taken consecutively in each studied area (upper, middle and lower estuary), in the spring tide and sampled in the downstream direction, producing a total of 36 plankton samples. Plankton hauls were performed using a small powerboat at an average speed of 1.5 Knots.
Laboratory procedures
Subsamples were obtained to determine numerical density and biomass using a Folsom plankton splitter. Copepods were counted and identified under a stereoscopic microscope. In the present study, only the adult stages of P. richardi and P. acutus were considered, as the use of a 300 µm mesh-size net did not allow for a proper sampling of the juvenile stages (CI-CV).
The length of the specimens (prosome length) was measured using an eyepiece micrometer with the animals placed in a lateral position to avoid possible errors that could be triggered by the body curvature. After being measured, the animals were rinsed with a small amount (0.5-1 mL) of distilled water and placed in small, pre-weighed, aluminum foil dishes (40 mm in diameter). The latter were then dried at 60 °C in an electric oven for 24 h and then cooled in a desiccator with silica gel at room temperature, and their dry weights were measured using an electronic microbalance (Sartorius, Model BP-410S). Weight loss subsequent to formalin use
was not taken into consideration (Chisholm & Roff, 1990).
Individuals were divided into different length classes (15 classes represented by three replicate groups of 100 individuals for P. richardi and 14 classes with three replicate groups of 10 individuals for P. acutus). The smaller number of individuals used from P. acutus was due to their lower density. Class intervals were of 40 µm and different numbers of classes are related to the dimensions of different species.
Biomass was estimated by the product of density (ind. m-3) of each length class and the
average dry weight of individuals sampled in each class (DW, µg), which was calculated from prosome length (L, µm), by an exponential length-weight regression equation, shown as:
DW = aebL (1)
Where a,b and e are constant.
Statistical analysis
Correlation between the density of Pseudodiaptomus species and salinity were assessed using the Spearman rank correlation analysis. A Kruskal-Wallis non-parametric ANOVA was used to test differences in density and biomass of Pseudodiaptomus on a spatial and temporal scale
24 26 28 30 32 34
0 100 200 300 400 500
Jan Feb Mar Apr May Jun Jul Aug Sep Oct Nov Dec Tracuateua (36 m) 01° 05´ S and 47° 10´ W
Rainfall Temperature
A
verage monthly termperature (°C)
A
verage monthly rainfall (mm)
0.0 4.0 8.0 12.0 16.0 20.0 24.0 28.0 32.0 36.0 40.0
- 1° 00´ - 0° 45´ - 0° 30´
C
B
A
Bragança Belém
Bragança Marajó
Marajó 0°
- 1°
- 2°
0°
- 1°
- 2°
- 49° - 48° - 47° - 46° - 45° - 44°
- 49° - 48° - 47° - 46° - 45° - 44°
Atlantic Ocean
Brazil
Fig. 2 — Geographical location of the Caeté River Estuary and position of the three sampling areas in relation to the salinity (‰) gradients defining the upper (A); middle (B); and lower (C) estuary.
(Zar, 1999). The analysis was performed with the computer software package STATISTICA 5.0.
RESULTS
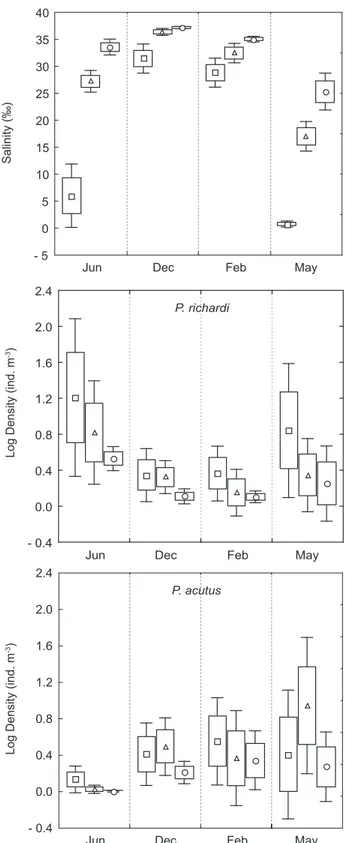
The Caeté River Estuary had high temporal and spatial variations of salinity, with increasing values from the upper to the lower estuary (Fig. 3). The lowest average value (0.8‰) was observed
in the inner part of the estuary in the rainy season (May).
Conversely, the highest value (37.2‰) was found in the lower estuary in the dry season (December).
Salinity (‰)
- 5 0 5 10 15 20 25 30 35 40
Jun Dec Feb May
Log Density (ind. m
-3)
- 0.4 0.0 0.4 0.8 1.2 1.6 2.0 2.4
Jun Dec Feb May
P. richardi
Log Density (ind. m
-3)
- 0.4 0.0 0.4 0.8 1.2 1.6 2.0 2.4
Jun Dec Feb May
P. acutus
hand, this correlation was not significant in the case of P. acutus (rs = - 0.27; p > 0.05).
Among the thirty-six samples collected, 91.7% of them contained specimens of P. richardi, while P. acutus was present in 77.8% of the cases. P. richardi mean density values varied between 0.28 and 46.18 ind. m-3, in the lower (February)
and upper estuary (June), respectively. In the case of P. acutus, these values were 0.01 and 17.02 ind. m-3, recorded in the lower (june) and
middle (May) estuary, respectively (Fig. 3). Copepod’s dry weight increased concomi-tantly to the prosome length, following an exponential relationship (Fig. 4). The length-weight relationships were significant for both P. richardi and P. acutus, and shown respectively, by the following equations:
DW = 67.137e (r = 0.79; p < 0.05) (2)
DW = 3.581e0.0054L (r = 0.76; p < 0.05) (3)
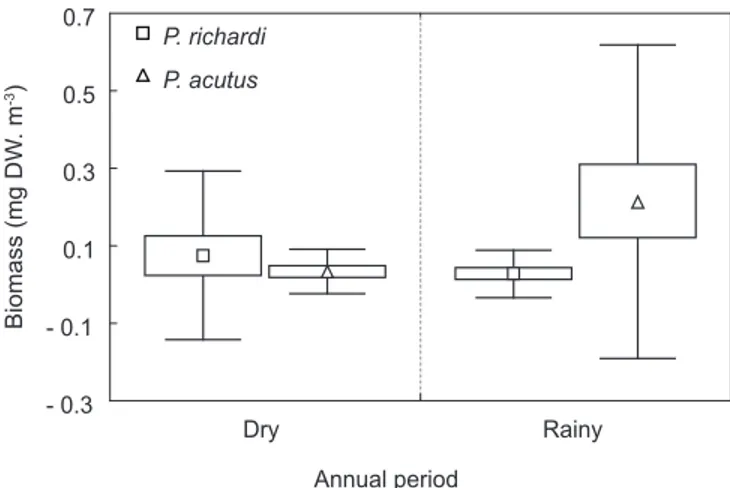
Biomass values for both species showed spatial and temporal fluctuations (Fig. 5 and Tables 1 and 2). P. richardi biomass varied between 0.0022 mg DW. m-3 (lower estuary -
February) and 0.3507 mg DW. m-3 (upper estuary
- June). Values recorded for P. acutus were between 0.0005 mg DW. m-3 (lower estuary - June) and
0.7181 mg DW. m-3 (middle estuary - May).
Monthly differences in biomass between sampling areas (spatial study) were never significant, either for P. richardi or for P. acutus. Similarly, there were no significant differences between biomasses registered within a same
P. acutus
r = 0.76; p < 0.05
0 200 400 600 800 1000
640 680 720 760 800 840 880 920 960
Prosome lenght (Mm)
Dry weight (
M
g)
P. richardi
r = 0.79; p < 0.05
0 400 800 1200 1600 2000
600 640 680 720 760 800 840 880 920
Prosome lenght (Mm)
Dry weight (
M
g)
area, but in different months (temporal study). Mathematical analyses conducted on density data led to the same conclusion as the biomass study.
DISCUSSION
The Caeté River Estuary has a dynamic horizontal gradient of salinity. Values increased gradually from the inner to the lower estuary, as already observed by Barletta-Bergan et al. (2002).
The relatively high value of 28.8 ‰, registered in the upper estuary during the rainy season (February), is probably related to the inundation of areas which have remained exposed during the dry season. In this mentioned period, salt crystal formations can be observed. During months of relatively high precipitation, the strong river flow leads to flooding in these areas, resulting in an increase of salinity in punctual areas of the estuary.
Annual period
Biomass (mg DW
. m
-3)
- 0.3 - 0.1 0.1 0.3 0.5 0.7
Dry Rainy
P. richardi P. acutus
Fig. 5 — Biomasses of P. richardi and P. acutus in the Caeté River Estuary. Values are shown as means ± standard deviations
(vertical bars) and standard errors (box).
TABLE 1
Spatial and temporal variation of P. richardi average biomass (mg DW. m-3) along the three
sampling areas in the Caeté River Estuary.
Season Dry Rainy
Months/Areas Jun/98 Dec/98 Feb/99 May/99
Upper 0.3507 0.0198 0.0134 0.1137
Middle 0.0530 0.0120 0.0049 0.0201
Lower 0.0133 0.0036 0.0022 0.0103
TABLE 2
Spatial and temporal variation of P. acutus average biomass (mg DW. m-3) along the three
sampling areas in the Caeté River Estuary.
Season Dry Rainy
Months/Areas Jun/98 Dec/98 Feb/99 May/99
Upper 0.0191 0.0922 0.1136 0.2577
Middle 0.0029 0.0617 0.0692 0.7181
Temporal variation in salinity can be clearly observed in this study, especially when comparing data recorded in the upper estuary in December (dry season) with those recorded in May (rainy season). This observation was probably triggered by differences in the amount of rainfall between the two seasons. During the study period, such seasonal differences were even higher by the large-scale atmospheric phenomenon, El Niño and La Niña (Magalhães, 2003). Authors, such as Golley & Medina (1975), Porto & Fonteles-Filho (1986), Barletta (1999) and Blaber (2002) also attributed salinity seasonal differences in tropical estuaries to the precipitation rate.
Salinity is an important factor when regulating the composition, density and distribution of Pseudodiaptomus species in estuaries (Collins & Williams, 1981; Mitra & Patra, 1990; Sarkar & Choudhury, 1998). Similar observations were made in the Caeté River estuarine ecosystem. In this environment, the analyzed species were encountered along a salinity gradient, as already reported in other estuaries of the Brazilian coast (e.g. Prado-Por & Tôha, 1984; Lansac-Tôha & Lima, 1993).
The Spearman correlation coefficient (rs) showed a significant negative correlation (rs = - 0.78; p < 0.05) between salinity and density of P. richardi, indicating the species preference for water of low salinity. Lopes (1994), who studied the structure and seasonal variation of zooplankton in the Guaraú River Estuary (São Paulo, Brazil), pointed out that the salinity longitudinal gradient was (partly) responsible for the spatial segregation of P. richardi. The presence of this species in all samples collected in the Caeté River Estuary, where euhaline-polyhaline regimes were predominant, could be related to its transport by currents as all the samples were collected in the ebb tide. Based on the increase of rainfalls noted in February a subsequent increase in density of P. richardi was expected in the upper estuary. However, low values were observed, probably as a result of the high salinity, as discussed above.
In the case of P. acutus, the correlation between salinity and density was negative but not significant (rs = - 0.27; p > 0.05). Conversely, Tundisi & Matsumura-Tundisi (1968) and Araujo (1996) reported a positive and significant correlation between the same species and salinity. Moreover,
the dominance of P. acutus in terms of density in areas of high salinity in the vicinity of river mouths (Medeiros, 1983; Santana-Barreto et al., 1991) was described as typical for mangrove areas, bays and estuaries (Montú & Cordeiro, 1998). Nevertheless, in the Caeté River Estuary, a clear pattern of spatial and temporal distribution for P. acutus was not observed.
The separation of copepods for biomass determination in terms of dry weight is unlikely due to the presence of other material such as detritus or phytoplankton. Additionally, when material is insufficient to determine the accurate weight, biomass in terms of dry weight can not be directly measured (Ara, 1998). In such a case, it was decided to assess the dry weight using length-weight regression equations. For the study species, this latter method was established based on measurements obtained from individuals captured during the entire study period. For our data, it is believed that seasonal variations in the length-weight relationship were buffered by the temporal heterogeneity of the samples. Nevertheless, according to Ara (2001), such variations can not be significant as variations in temperature and food availability in tropical and sub-tropical regions are much less significant than in temperate and boreal areas. In the present study, dry weight standard deviations were high for some of the regression values. This could be due to the proportion of individuals present in the corresponding stations during the rainy and dry seasons.
Estuary. Because of the typically large size of adult copepods, reductions in this group result in the overall zooplankton biomass decreasing (Kreutzweiser et al., 2004).
Biomass values for Pseudodiaptomus species in the studied area were lower than those reported in other regions (Liang & Uye, 1997; Eskinazi-Sant’Ánna, 2000). The relatively low values registered in the Caeté River Estuary could be explained by the large mesh size (300 µm) of the plankton net used in this study that should have captured predominant individuals of relatively large sizes. Due to this, juveniles and naupliar stages that could have influenced the overall population biomass were not taken into consideration.
Acknowledgments — The authors would like to thank Victoria
Isaac and Dirk Schories for their helpful assistance. This study was carried out as a part of the Brazilian-German Cooperative Project MADAM and was financed by the Conselho Nacional de Desenvolvimento Científico e Tecnológico (CNPq) and by the German Ministry for Education and Research (BMBF) under the code 03F0154A. This is MADAM-Contribution Nº 89. Financial support was also provided by the Coordenação de Aperfeiçoamento de Pessoal de Nível Superior (CAPES) and by the Laboratório de Plâncton e Cultivo de Microalgas da Universidade Federal do Pará (UFPA).
REFERENCES
ARA, K., 1998, Variabilidade Temporal e Produção dos Copépodos no Complexo Estuarino-Lagunar de Cananéia, São Paulo, Brasil. Doctoral thesis, Instituto Oceanográfico,
Universidade de São Paulo, Brazil, 308p.
______, 2001, Length-weight relationships and chemical content of the planktonic copepods in the Cananéia Lagoon estuarine system, São Paulo, Brazil. Plankton Biol. & Ecol., 48: 121-127.
ARAUJO, H. M. P., 1996, Zooplâncton do Estuário dos Rios Piauí e Fundo (Sergipe, Brasil): flutuações espaciais, sazonais e tidais. Doctoral thesis – Universidade Federal
do Paraná, Brazil, 193p.
BARLETTA, M., 1999, Seasonal changes of density, biomass and species composition of fishes in different habitats of the Caeté estuary (North Brazilian coast - east Amazon).
Doctoral thesis – Bremen University, Germany, 115p. BARLETTA-BERGAN, A., BARLETTA, M. & SAINT-PAUL,
U., 2002, Structure and seasonal dynamics of larval fish in the Caeté river estuary in North Brazil. Estuar. Coast. Shelf Sci., 54: 193-206.
BJÖRNBERG, T. K. S., 1981, Copepoda, pp. 587-679. In: D. Boltovskoy (ed.), Atlas del Zooplancton del Atlantico Sudoccidental y Métodos de trabajo con Zooplancton Marino. Instituto Nacional de Investigación y Desarrollo
Pesquero, Mar del Plata (INIDEP), Argentina.
BLABER, S. J. M., 2002, Fish in hot water: the challenges facing fish and fisheries research in tropical estuaries. J. Fish Biol., 61: 1-20.
BURKILL, P. H. & KENDALL, T. F., 1982, Production of the copepod Eurytemoraaffinis in the Bristol Channel. Mar. Ecol. Prog. Ser., 7: 21-31.
CALEF, G. W. & GRICE, G. D., 1967, Influence of the Amazon River outflow on the ecology of the western tropical Atlantic. II. Zooplankton abundance, copepod distribution, with remarks on the fauna of low. J. Mar. Res., 25: 84-94. CHAMPALBERT, G. & PAGANO, M., 2002, Copepod feeding
in a tuna fishery area of the tropical Atlantic Ocean. C. R. Biologies, 325: 171-177.
CHISHOLM, L. A. & ROFF, J. C., 1990, Size-weight relationships and biomass of tropical neritic copepods.
Mar. Biol., 106: 71-77.
CIPÓLLI, M. N. & CARVALHO, M. A. J., 1973, Levantamento de calanoida e cyclopoida (Copepoda, Crustacea) das águas da região do Guamá, Capim e Tocantins, com nota sobre a fauna acompanhante. Papéis Avulsos Zool., S. Paulo, 27: 95-110.
COHEN, M. C. L., LARA, R. J., RAMOS, J. F. F. & DITTMAR, T., 1999, Factors influencing the variability of Mg, Ca, and K in waters of a mangrove creek in Bragança, North Brazil.
Mangrove Salt Marshes, 3: 9-15.
COLLINS, N. R. & WILLIAMS, R., 1981, Zooplankton of the Bristol Channel and Severn estuary. The distribution of four copepods in relation to salinity. Mar. Biol., 64: 273-283.
ESKINAZI-SANT’ÁNNA, E. M., 2000, Zooplankton abundance and biomass in a tropical estuary (Pina Estuary, Northeast Brazil). Trabhs. Oceanogr., Univ. Fed. Pernambuco, 28: 21-34.
EVJEMO, J. O., KJELL, I. R. & OLSEN, Y., 2003, Copepods as live food organisms in the larval rearing of halibut larvae (Hippoglossus hippoglossus L.) with special emphasis on
the nutritional value. Aquaculture, 227: 191-210.
FRONEMAN, P. W., 2001, Seasonal Changes in Zooplankton Biomass and Grazing in a Temperate Estuary, South Africa.
Estuar. Coast. Shelf Sci., 52: 543-553.
GOLLEY, F. B. & MEDINA, E., 1975, Tropical Ecological Systems. Trends in terrestrial and aquatic research.
Spriger-Verlag, New York, 398p.
HEINLE, D. R., 1966, Production of calanoid copepod, Acartia tonsa, in the Patuxent River estuary. Chesapeake Sci.,
7: 59-74.
INMET, 1992, Normas climatológicas. Instituto Nacional de Meterologia, Brasilia, DF.
KREUTZWEISER, D. P., SUTTON, T. M., BACK, B. C., PANGLE, K. L. & THOMPSON, D. G., 2004, Some ecological implications of a neem (azadirachtin) insecticide disturbance to zooplankton communities in forest pond enclosures. Aquatic Toxicology, In Press.
LANSAC-TÔHA, F. A. & LIMA, A. F., 1993, Ecologia do zooplâncton do estuário do rio Una do Prelado (São Paulo, Brasil). Acta Limnol. Bras., 6: 82-96.
LARA, R. J. & DITTMAR, T., 1999, Nutrient dynamics in a mangrove creek (North Brazil) during the dry season.
case study in Pará State, North Brazil: Introduction. Wetl. Ecol. Manag., 11: 217-221.
LOPES, R. M., 1994, Zooplankton distribution in the Guaraú river estuary (South-eastern Brazil). Estuar. Coast. Shelf Sci., 39: 287-302.
LIANG, D. & UYE, S., 1997, Population dynamics and production of the planktonic copepods in a eutrophic inlet of the Inland Sea of Japan. IV. Pseudodiaptomus marinus, the egg-carrying calanoid. Mar. Biol., 128: 415-421.
MAGALHÃES, A., 2003, Distribuição espaço-temporal, densidade e biomassa das espécies de Pseudodiaptomus
(Copepoda, Calanoida) no estuário do rio Caeté, Bragança, Pará. Master thesis – Universidade Federal do Pará, Brazil, 51p.
MAUCHLINE, J., 1998, Advances in Marine Biology: The Biology of Calanoid Copepods. vol. 33, Academic Press, London, UK, 720p.
MEDEIROS, G. S., 1983, Variação sazonal e diurnal do zooplâncton no estuário Potengi, Natal/RN (com especial
referência aos Copepoda - Crustacea). Master thesis - Universidade Federal do Paraná, Brazil, 99p.
MITRA, A. & PATRA, K. C., 1990, Ecology of planktonic copepods in the Mandarmani creek of West Bengal, India.
Indian J. Marine Sci., 19: 278-281.
MONTÚ, M., 1980, Zooplâncton do estuário da Lagoa dos Patos. I. Estrutura e variações temporais e espaciais da comunidade. Atlântica, 4: 53-72.
MONTÚ, M. & CORDEIRO, T. A., 1998, Zooplancton del complejo estuarial de la Bahía de Paranaguá. Nerítica,
3: 61-83.
NIELSEN, T. & MUNK, P., 1998, Zooplankton diversity and the predatory impact by larval and small juvenile fish at the Fisher Banks in the North Sea. J. Plankton Res.,
20: 2313-2332.
OSIDELE, O. O. & BECK, M. B., 2004, Food web modelling for investigating ecosystem behaviour in large reservoirs of the south-eastern United States: lessons from Lake Lanier, Georgia. Ecological Modelling, 173: 129-158.
PACE, M. L. & COLE, J. J., 1996, Regulation of bacteria by resources and predation tested in whole-lake experiments.
Limnol. Oceanogr., 41: 1448-1460.
PAYNE, M. F. & RIPPINGALE, R. J., 2001, Effects of salinity, cold storage and enrichment on the calanoid copepod
Gladioferens imparipes. Aquaculture, 201: 251-262. PARSONS, T. R., TAKAHASHI, M. & HARGRAVE, B., 1984,
Biological Oceanographic Processes. 3rd ed., Pergamon
Press (Oxford), New York, 332p.
ANANDRAJ, A., 2003, Planktonic food webs and benthic-pelagic coupling in three South African temporarily-open estuaries. Acta Oecologica, 24: 307-316.
PORTO, H. L. R. & FONTELES-FILHO, A. A., 1986, Estudo de densidade e biomassa de camarões do gênero Penaeus, na ilha de São Luiz, Estado do Maranhão. Bolm. Lab. Hidrobiol., São Luís, 7: 42-70.
PRADO-POR, A. M. S. & LANSAC-TÔHA, F. A., 1984, The distribution of brackish water Calanoida (Copepoda) along the coasts of Brazil. Hydrobiologia, 113: 147-150. SANTANA-BARRETO, M. S., NOBREGA, M. N. C. &
BEZERRA DE MELLO FILHO, M. T., 1991, Revisão e atualização do zooplâncton no estuário do Rio Ariquinda, Rio Formoso - Pernambuco. Proceedings of the Encontro Brasileiro de Plâncton, 4. Recife, Brasil, pp. 415-430.
SARKAR, S. K. & CHOUDHURY, A., 1998, Distribution of inshore copepod of the Bay of Bengal off Sagar Island: A multivariate analysis. Trop. Eco., 29: 146-158.
SCHWENDENMANN, L., 1998, Tidal and seasonal variations of soil and water properties in a Brazilian mangrove ecosystem. Master thesis – University of Karlsruhe, Resources Engineering Programme, 101p.
TUNDISI, J. & MATSUMURA-TUNDISI, T., 1968, Plankton studies in a mangrove environment. V. Salinity tolerances of some planktonic crustaceans. Bolm. Inst. Oceanogr., São Paulo, 17: 57-65.
UYE, S., IWAI, Y. & KASAHARA, S., 1983, Growth and production of the inshore marine copepod Pseudodiaptomus marinus in the centralpart of the Inland Sea of Japan. Mar. Biol., 73: 91-98.
UYE, S. & SANO, K., 1995, Seasonal reproductive biology of the small cyclopoid copepod Oithona davisae in a temperature
eutrophic inlet. Mar. Ecol. Prog. Ser., 118: 121-128.
WALTER, T. C., 1986, The zoogeography of genus
Pseudodiaptomus (Calanoida: Pseudodiaptomidae).
Syllogeus, 58: 502-508.
WRIGHT, S. A., 1936a, A revision of South American species of Pseudodiaptomus. Ann. Acad. Bras. Sci., 8: 1-24. WRIGHT, S. A., 1936b, Preliminary report on six new species
of Diaptomus from Brazil. Ann. Acad. Bras. Sci., 8: 79-85.
XIE, P. & YANG, Y., 2000, Long-term changes of Copepoda community (1957-1996) in a subtropical Chinese lake stocked densely with planktivorous filter-feeding silver and bighead carp. J. Plankton Res., 22: 1757-1778.
ZAR, J. H., 1999, Biostatistical Analysis. 4th ed., Prentice Hall,
New Jersey, 929p.