ABSTRACT: The alcobaça mutation in the Penjar tomato (Solanum lycopersicum L.) variety alters the ripening process and confers a long shelf life (more than four months). Storage of Penjar tomatoes leads to a distinctive sensory profile valued by local consumers, who prefer aged tomatoes to fresh ones. To study chemical changes occurring during storage, we characterized the complete sugar-and-acid profile of 25 accessions at harvest and at 2 and 4 months after harvest. We found considerable variability in the sugar-and-acid profile within the Penjar variety, especially for fructose and glucose. Some accessions presented exceptionally high values for sugars, making them especially interesting for breeding programs. During postharvest, the con-centration of glucose, fructose, and citric acid decreased, whereas the concon-centration of malic and glutamic acids increased. Data from this study offer novel insights into postharvest changes in tomato quality parameters and help elucidate the reasons for the appreciation of this variety by consumers.
Keywords: tomato landrace, alcobaça, ripening mutant, postharvest, quality
the concentration of sugars falls due to the respiratory metabolism (Getinet et al., 2008). On the other hand, the concentration of organic acids (malic and citric acids) decreases throughout the postharvest period (Getinet et al., 2008). Differences between standard tomatoes and alc mutants during the ripening period have been well described (Kopeliovitch et al., 1980; Mutschler, 1984), but much less is known about differences in the posthar-vest period. Thus, we sought to describe the evolution of malic, glutamic, and citric acids and of glucose and fructose during the long aging phase. Moreover, because the alc allele in the Penjar tomatoes occurs in a variety of genetic backgrounds (Casals et al., 2012), we also sought to ascertain the reasons for consumers’ postharvest pref-erences of this variety so that this information could be transferred to breeding programs.
Materials and Methods
Plant materials
In a previous study, we analyzed genetic variabil-ity within the Penjar variety (Casals et al., 2012). Char-acterization of 118 accessions provided by local farmers enabled us to select 21 accessions representing the ma-jor part of the genetic variability found in the variety. In the current study, we used these 21 accessions plus two additional Penjar accessions widely cultivated by local farmers (Table 1). The previous study confirmed the presence of the alc allele in all the Penjar accessions using a cleaved amplified polymorphism (CAP) marker (Casals et al., 2012). All these materials are available from the germplasm bank of the Miquel Agustí Founda-tion (Spain). We included as controls four ripening
mu-1Miquel Agustí Foundation − Campus Baix Llobregat, Av. Canal Olímpic, 15 − 08860 − Castelldefels – Spain. 2University Jaume I – Dept. of Agricultural Sciences and Natural Environment − Campus Riu Sec – 12071 − Castellón – Spain.
3Polytechnic University of Catalonia– Dept. of Agri-Food Engineering and Biotechnology – Campus Baix Llobregat, Av. Canal Olímpic, 15 – 08860 − Castelldefels – Spain. 4Polytechnic University of Valencia − Institute for Conservation & Improvement of Valentian Agrodiversity (COMAV) − Camino de Vera, s/n – 46022 − Valencia − Spain.
*Corresponding author <[email protected]>
Edited by: Leonardo Oliveira Medici
Sugar-and-acid profile of Penjar tomatoes and its evolution during storage
Joan Casals Missio1*, Raul Marti Renau2, Francesc Casañas Artigas1,3, Jaime Cebolla Cornejo4
Received September 17, 2014 Accepted March 01, 2015
Introduction
Ripening and postharvest behavior are strongly disrupted in ripening mutants of tomato (Solanum lyco-persicum L.) (Klee and Giovannoni, 2011). A number of mutations related to these disruptions have been found in scientific breeding programs (e.g.: ripening inhibitor (rin) (Robinson and Tomes, 1968)) and others have been found in landraces. In Europe, long-storage landraces (Bota et al., 2014; Casals et al., 2012; Siracusa et al., 2012) are highly valued by local consumers, especially in Italy and Spain, where they are traditionally consumed after a storage period that confers a specific sensory pro-file. For these special tomatoes, the postharvest period could be referred to as the “aging phase” (Watada et al., 1984), because it involves a series of changes in quality parameters after maturity and before consumption.
tants from the Tomato Genetics Resource Center (TGRC, University of California, Davis, CA; LA0162 (Never ripe (Nr)), LA3770 (non-ripening (nor)), LA3012 (ripening inhibitor (rin)), and LA3134 (alcobaça (alc)), and one normal-ripening commercial hybrid widely grown in NE Spain (Bodar, Royal Sluis).
As described by Casals et al. (2012), plants were grown in an experimental field in Sabadell (NE Spain, 41º32’ N 2º4’ E) in the open air at a density of 25,000 plants ha−1 using standard local farming practices (canes
for support, pruning every 15 days, with local irrigation and fertigation) and a random three-block design with 12 plants per plot. Agromorphological traits for each va-riety have been published in a previous work (Casals et al., 2012). From each plot, fruits were collected at the red ripe stage in one single harvest. Fruits were stored in a dark room at 20 ± 5 ºC and 68 % to 75 % relative humidity. Shelf life was calculated for each plot as the
mean number of days from harvesting to discarding of fruits (Casals et al., 2012).
Previous studies based on aroma profile (Casals et al., 2011) showed that Penjar tomatoes maintain their high commercial value for 4 months after harvesting (Figure 1). Thus, we targeted this period for the present study, and selected three sampling dates: at harvest (0 months), at 2 months postharvest, and at 4 months post-harvest. At each sampling date, we froze three replicates per accession and kept them at -20 ºC until analysis. Each replicate consisted of three fruits with good exter-nal appearance from a single plot.
Sample preparation
Samples were thawed in a refrigerator in the dark. Then the three replicates were blended and homog-enized at a low temperature. Samples were centrifuged at 2,500 rpm (510 x g) for 5 min. The upper phase was
Table 1 − Tomato accessions used in this study.
Type Accession Origin Fruit shape Fruit weight1 Shelf life1
Landraces g days
CDP01203 Sant Vicenç de Montalt, NE Spain Cylindrical 34.4 139.3
CDP05566 Cassà de la Selva, NE Spain Cylindrical 37.9 129.4
CDP01254 Llinars del Vallès, NE Spain Heart-shaped 25.2 133.9
CDP01447 Pineda de Mar, NE Spain Cylindrical 42.2 128.8
CDP00235 Mollet del Vallès, NE Spain Slightly flattened 95.0 94.3
CDP01255 Arenys de Munt, NE Spain Rounded 60.7 132.3
CDP07789 Argentona, NE Spain Ellipsoid 34.6 132.0
CDP01114 Creixell, NE Spain Rounded 53.6 118.3
CDP07531 Sant Quintí de Mediona, NE Spain Highly rounded 50.8 117.9
LC77 Castellbell i el Vilar, NE Spain Ellipsoid 34.5 40.6
CDP03512 Palafolls, NE Spain Rounded 51.5 129.8
CDP02569 Sabadell, NE Spain Heart-shaped 54.0 126.0
CDP03365 Sabadell, NE Spain Slightly flattened 74.1 117.9
CDP02588 Unknown Flattened 78.0 106.9
CDP06432 Sabadell, NE Spain Flattened 47.7 138.6
CDP00023 Unknown Rounded 100.5 118.4
CDP01245 Estanyol, NE Spain Slightly flattened 46.5 137.6
CDP01475 Santa Coloma de Farners, NE Spain Cylindrical 62.3 115.2
CDP05468 Unknown Heart-shaped 31.2 133.9
CDP01127 Mallorca, Balearic Islands Heart-shaped 120.2 98.7
CDP03698 Unknown Cylindrical 71.0 99.3
LC313 Blanes, NE Spain Heart-shaped 68.4 127.9
CDP06989 Blanes, NE Spain Heart-shaped 60.9 131.5
Commercial varieties (Penjar)
CDP03366 Hortícola Alavesa SL Slightly flattened 120.9 98.4
CDP02356 Diamond Seeds SL Rounded 57.0 123.6
Ripening mutants (controls)3
LA3770 (nor) TGRC2 Rounded 51.9 124.8
LA3012 (rin) TGRC2 Rounded 128.2 18.1
LA3134 (alc) TGRC2 Rounded 130.7 20.8
LA0162 (Nr) TGRC2 Rounded 122.0 11.2
Commercial hybrid
Bodar Royal Sluis Rounded 131.96 19.2
diluted (1:10) in deionized water and the internal stan-dard D-fructose 1.6-diphosphate added. The solution was filtered using centrifuge tube filters with 0.22 µm membranes and analyzed.
Chemical analysis
Sucrose, fructose, glucose, malic acid, citric acid, and glutamic acid were quantified by capillary electro-phoresis following the method described by Cebolla-Cornejo et al. (2012) on an Agilent 7100 system using fused silica capillaries with a 50 µm internal diameter, 363 µm external diameter, 67 cm total length, and 60 cm effective length. Capillaries were initially conditioned with consecutive rinses at 95000 Pa and 50 ºC, as fol-lows: 1 M NaOH (5 min), 1 M NaOH (5 min), and de-ionized water (10 min). At the beginning of each work-ing session, the capillary was flushed at 20 ºC with the background electrolyte (20 mM 2.6-piridin dicarboxylic acid at pH 12.1 and 0.1 % w/v hexadimethrine bromide) running for 30 min. Between runs, it was flushed with 58 mM SDS solution (2 min) followed by the background electrolyte running for 5 min. Samples were injected hy-drodynamically at 3447 Pa for 20 s. Separations were performed at -25 kV and 20 ºC. Indirect detection was done at 214 nm. Results are expressed in grams per kilo-gram of fresh weight (FW).
Statistical analysis
As proposed by Sakiyama and Stevens (1976), to avoid presumed increases in acid and sugar concentration due to water loss during postharvest, concentrations at 2 and 4 months’ postharvest were corrected according to the following formula: Reported value = Measured value
× Weight after storage/Weight at harvest. We used the SAS statistical package (Statistical Analysis System, Cary, NC, USA, version 8.02) for ANOVA. Differences between storage times and between accessions were determined by the Student-Newman-Keuls test with significance set at 0.05. Genotypic correlations (between mean pheno-typic values of each accession) were estimated using the Pearson coefficient. Using this approach, we analyzed the correlations between chemical composition and agromor-phological traits to evaluate whether the chemical compo-sition of Penjar tomatoes was related to shelf life.
Results
The controls Bodar, rin, alc, and Nr lost their com-mercial value at one month postharvest and were there-fore discarded as controls for the long-term postharvest evolution of sugars and acids. However, like the Penjar accessions, accession LA3770 carrying the nor allele pro-vided fruits that maintained their commercial value af-ter 4 months storage.
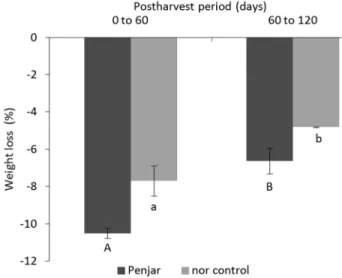
The average weight loss for the accessions of the Penjar variety at 4 months postharvest was 17 %. The nor control lost less weight (13 %). For the Penjar ac-cessions, the average weight loss in the first period (11 %, 0-2 months postharvest) was significantly higher (1.6 fold, p < 0.0001) than in the second (7 %, 2-4 months postharvest) (Figure 2). All the Penjar accessions had the same pattern of weight loss, and no significant interac-tion between accession and postharvest period was de-tected (p = 0.49). In the nor control, weight loss was also greater in the first period (8 %) than in the second (5 %) (p < 0.01).
Figure 1 – External appearance, longitudinal and transversal sections of fruits from three Penjar accessions (CDP05468, CDP01255, CDP00235) after 4 months’ storage.
Figure 2 − Fruit weight loss in the 0-2 months and 2-4 months postharvest periods for the Penjar variety and for the LA3770 non-ripening(nor) control. Data represent the mean ± standard error of the mean of 25 accessions for the Penjar variety and of three replicates for the nor control. Within each variety, different letters indicate differences between periods (Student-Newman-Keuls test,
in a Penjar accession (LC77 = 29.64 g kg−1 FW) was
1.6-fold higher (p < 0.0001) than the highest concentration in a control (Bodar = 18.44 g kg−1 FW). Values of the
fructose-to-glucose ratio in the Penjar accessions at har-vest ranged from 1.11 to 1.37, although no differences were detected between accessions. The ratio was lowest in the control Bodar (1.00), where it was lower than the four highest rated Penjar accessions (p = 0.0038).
During the 4 months after harvest, the tions of sugars evolved differently from the concentra-tions of acids (Figure 3). Concentraconcentra-tions of sugars de-creased sharply during the first two months (in the Penjar accessions, 43 % for glucose and 39 % for fructose) and then more gradually in the third and fourth months (in the Penjar accessions, 28 % for glucose and 12 % for fruc-tose). The evolution in the nor control was similar to that in the Penjar variety. In Penjar tomatoes, the average fruc-tose-to-glucose ratio increased slightly (p < 0.0001) during postharvest, from 1:1.22 at harvest to 1:1.32 two months after harvest and 1:1.62 four months after harvest. The concentration of sugars and acids varied
wide-ly between accessions at harvest (p < 0.0001) (Table 2). Sucrose concentrations were not evaluated because they were below the detection threshold (8.99 µg mL−1) of the
analytical method (Cebolla-Cornejo et al., 2012) in both the Penjar accessions and the controls. For the other me-tabolites, concentrations ranged from 0.59 to 1.57 g kg−1
FW for malic acid, from 3.94 to 7.11 g kg−1 FW for citric
acid, from 0.92 to 3.82 g kg−1 FW for glutamic acid, from
14.41 to 34.76 g kg−1 FW for fructose, and from 11.62 to
29.64 g kg−1 FW for glucose.The range of variation in
acid concentrations at harvest within the Penjar variety was similar to that observed in the controls.
Maximum sugar concentrations at harvest were lower in the controls than in the Penjar accessions with the highest concentrations. Specifically, the highest fruc-tose concentration in a Penjar accession (CDP07789 = 34.76 g kg−1 FW) was 1.5-fold higher (p < 0.0001) than
in the control with the highest concentration (nor = 20.17 g kg−1 FW), and the highest glucose concentration
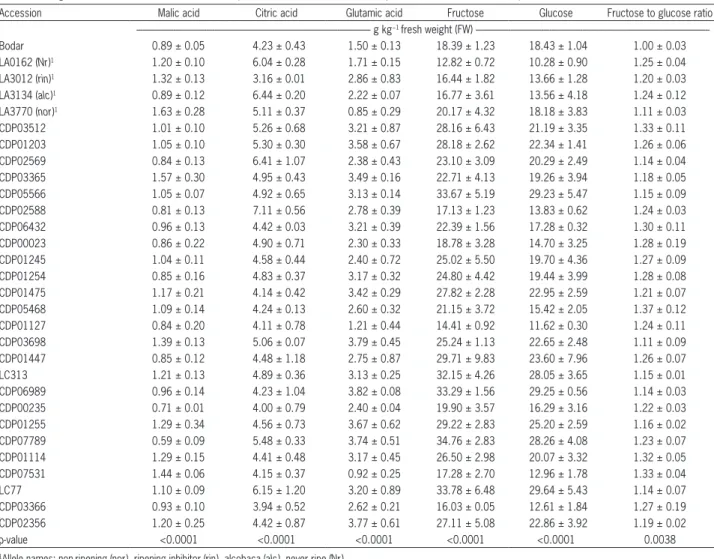
Table 2 − Sugar and acid concentrations for table-ripe tomatoes at harvest. Data represent means from three replicates ± standard error of the mean.
Accession Malic acid Citric acid Glutamic acid Fructose Glucose Fructose to glucose ratio --- g kg−1 fresh weight (FW)
---Bodar 0.89 ± 0.05 4.23 ± 0.43 1.50 ± 0.13 18.39 ± 1.23 18.43 ± 1.04 1.00 ± 0.03
LA0162 (Nr)1 1.20 ± 0.10 6.04 ± 0.28 1.71 ± 0.15 12.82 ± 0.72 10.28 ± 0.90 1.25 ± 0.04 LA3012 (rin)1 1.32 ± 0.13 3.16 ± 0.01 2.86 ± 0.83 16.44 ± 1.82 13.66 ± 1.28 1.20 ± 0.03 LA3134 (alc)1 0.89 ± 0.12 6.44 ± 0.20 2.22 ± 0.07 16.77 ± 3.61 13.56 ± 4.18 1.24 ± 0.12 LA3770 (nor)1 1.63 ± 0.28 5.11 ± 0.37 0.85 ± 0.29 20.17 ± 4.32 18.18 ± 3.83 1.11 ± 0.03 CDP03512 1.01 ± 0.10 5.26 ± 0.68 3.21 ± 0.87 28.16 ± 6.43 21.19 ± 3.35 1.33 ± 0.11 CDP01203 1.05 ± 0.10 5.30 ± 0.30 3.58 ± 0.67 28.18 ± 2.62 22.34 ± 1.41 1.26 ± 0.06 CDP02569 0.84 ± 0.13 6.41 ± 1.07 2.38 ± 0.43 23.10 ± 3.09 20.29 ± 2.49 1.14 ± 0.04 CDP03365 1.57 ± 0.30 4.95 ± 0.43 3.49 ± 0.16 22.71 ± 4.13 19.26 ± 3.94 1.18 ± 0.05 CDP05566 1.05 ± 0.07 4.92 ± 0.65 3.13 ± 0.14 33.67 ± 5.19 29.23 ± 5.47 1.15 ± 0.09 CDP02588 0.81 ± 0.13 7.11 ± 0.56 2.78 ± 0.39 17.13 ± 1.23 13.83 ± 0.62 1.24 ± 0.03 CDP06432 0.96 ± 0.13 4.42 ± 0.03 3.21 ± 0.39 22.39 ± 1.56 17.28 ± 0.32 1.30 ± 0.11 CDP00023 0.86 ± 0.22 4.90 ± 0.71 2.30 ± 0.33 18.78 ± 3.28 14.70 ± 3.25 1.28 ± 0.19 CDP01245 1.04 ± 0.11 4.58 ± 0.44 2.40 ± 0.72 25.02 ± 5.50 19.70 ± 4.36 1.27 ± 0.09 CDP01254 0.85 ± 0.16 4.83 ± 0.37 3.17 ± 0.32 24.80 ± 4.42 19.44 ± 3.99 1.28 ± 0.08 CDP01475 1.17 ± 0.21 4.14 ± 0.42 3.42 ± 0.29 27.82 ± 2.28 22.95 ± 2.59 1.21 ± 0.07 CDP05468 1.09 ± 0.14 4.24 ± 0.13 2.60 ± 0.32 21.15 ± 3.72 15.42 ± 2.05 1.37 ± 0.12 CDP01127 0.84 ± 0.20 4.11 ± 0.78 1.21 ± 0.44 14.41 ± 0.92 11.62 ± 0.30 1.24 ± 0.11 CDP03698 1.39 ± 0.13 5.06 ± 0.07 3.79 ± 0.45 25.24 ± 1.13 22.65 ± 2.48 1.11 ± 0.09 CDP01447 0.85 ± 0.12 4.48 ± 1.18 2.75 ± 0.87 29.71 ± 9.83 23.60 ± 7.96 1.26 ± 0.07
LC313 1.21 ± 0.13 4.89 ± 0.36 3.13 ± 0.25 32.15 ± 4.26 28.05 ± 3.65 1.15 ± 0.01
CDP06989 0.96 ± 0.14 4.23 ± 1.04 3.82 ± 0.08 33.29 ± 1.56 29.25 ± 0.56 1.14 ± 0.03 CDP00235 0.71 ± 0.01 4.00 ± 0.79 2.40 ± 0.04 19.90 ± 3.57 16.29 ± 3.16 1.22 ± 0.03 CDP01255 1.29 ± 0.34 4.56 ± 0.73 3.67 ± 0.62 29.22 ± 2.83 25.20 ± 2.59 1.16 ± 0.02 CDP07789 0.59 ± 0.09 5.48 ± 0.33 3.74 ± 0.51 34.76 ± 2.83 28.26 ± 4.08 1.23 ± 0.07 CDP01114 1.29 ± 0.15 4.41 ± 0.48 3.17 ± 0.45 26.50 ± 2.98 20.07 ± 3.32 1.32 ± 0.05 CDP07531 1.44 ± 0.06 4.15 ± 0.37 0.92 ± 0.25 17.28 ± 2.70 12.96 ± 1.78 1.33 ± 0.04
LC77 1.10 ± 0.09 6.15 ± 1.20 3.20 ± 0.89 33.78 ± 6.48 29.64 ± 5.43 1.14 ± 0.07
CDP03366 0.93 ± 0.10 3.94 ± 0.52 2.62 ± 0.21 16.03 ± 0.05 12.61 ± 1.84 1.27 ± 0.19 CDP02356 1.20 ± 0.25 4.42 ± 0.87 3.77 ± 0.61 27.11 ± 5.08 22.86 ± 3.92 1.19 ± 0.02
p-value <0.0001 <0.0001 <0.0001 <0.0001 <0.0001 0.0038
Of the three acids analyzed, only the citric de-creased in concentration during the postharvest period in Penjar accessions (8 % over the 4-month period) (Fig-ure 3). Similar results were observed in the nor control (Figure 3). The other two acids increased in concentra-tion during postharvest in the Penjar accessions. The concentration of malic acid remained unchanged in the first 2 months postharvest and increased 29 % in the remaining 2 months (Figure 3). The concentration of glutamic acid increased 60 % in the first 2 months af-ter harvest and then decreased 11 % in the remaining
2 months. By contrast, in the nor control no differences in the concentrations of malic and glutamic acids were observed during postharvest (Figure 3).
Shelf life had significant correlations with malic acid concentration at 2 months postharvest (r = 0.53, p = 0.0076) and with malic acid (r = 0.47, p = 0.027), fructose (r = 0.59, p = 0.003), and glucose (r = 0.51, p = 0.01) concentrations at 4 months postharvest. Glu-cose and fructose were negatively correlated with fruit weight at each postharvest time (e.g.: at harvest, r = -0.54 and -0.63, respectively, p < 0.001). Regarding
correlations between the concentrations of compounds at harvest.highly significant correlations were found be-tween fructose and glucose (r = 0.98, p < 0.0001) and between glutamic acid and both fructose (r = 0.69, p = 0.0002) and glucose (r = 0.67, p = 0.0004).
Discussion
Genetic background, agromorphological charac-teristics (Casals et al., 2012) and aroma profile (Casals et al., 2011) vary widely between accessions of Penjar tomatoes. In the present study, the concentrations of sugar and acid at harvest varied widely between ac-cessions. The mean concentrations of malic, citric, and glutamic acids in the Penjar accessions were similar to those reported for tomatoes in general (Causse et al., 2007), but the concentrations of sugars in the Penjar ac-cessions were on average higher than in conventional tomatoes. Glucose concentrations in Penjar ranged from 11.62 to 29.64 g kg−1 FW, compared to 9 to 17 g kg−1 FW
in conventional tomatoes (Causse et al., 2007). Similarly, fructose concentration in Penjar accessions ranged from 14.41 to 34.76 g kg−1 FW, compared to 11 to 20 g kg−1
FW in conventional tomatoes (Causse et al., 2007). Like-wise, the sugar content in Penjar is clearly higher than in other tomato landraces from the Mediterranean basin (Ercolano et al., 2008; Loiudice et al., 1995).
The high sugar concentrations of some accessions could be related to their low fruit weight (mean 64.1 g). We found a negative correlation between these traits, and this relation has been reported in other tomato va-rieties (Prudent et al., 2009). In fact, the degree of sugar accumulation in Penjar fruits seems comparable to that found in cherry tomatoes (Rosales et al., 2007). Although low fruit weight is an undesirable trait for most tomato breeding programs and the high glucose and fructose traits could be partly lost when transferred to breed-ing lines with higher fruit weight (Levin and Schaffer, 2013), a number of the Penjar accessions evaluated could provide germplasm for developing new cultivars with improved quality and shelf life. Particularly interesting were the accessions CDP06989 (fructose = 33.29 g kg−1
FW; glucose = 29.25 g kg−1 FW) and LC313 (fructose
= 32.15 g kg−1 FW; glucose = 28.05 g kg−1 FW), which
also had good aroma and taste characteristics accord-ing to the trained sensory panel’s descriptions (data not shown).
Average fruit weight loss during storage of Penjar tomatoes (17 % in 120 days) is far lower than that re-ported in standard varieties. For instance, Getinet et al. (2008) reported that the cultivars Roma and Marglobe lost 14 % to 19 % fruit weight after 32 days of storage, and Javanmardi and Kubota (2006) reported that the cultivar Clermon lost 1 % to 5 % fruit weight after 7 days of storage at different temperatures. Although the effects of temperature and other environmental factors on fruit weight loss make it difficult to compare results across studies, the Penjar variety’s pattern of
transpira-tion clearly differs from that of standard tomatoes. Re-duced polygalacturonase activity (Mutschler et al., 1988) and changes in cuticle composition (Saladie et al., 2007) described in alc mutants could be the basis of the low postharvest fruit weight loss of the Penjar variety. Nev-ertheless, the presence of alc is insufficient to explain the long shelf life, as the shelf life of the alc control included in the study was only about one month. As reported by Casals et al. (2012), shorter shelf life in the alc control is probably related to its larger fruit size.
Long-term storage of Penjar tomato results in a large decrease in sugars, a slight decrease in citric acid, and an increase in malic and glutamic acids. Fructose and glucose, found in approximately equimolar con-centrations in cultivated tomatoes (Davies and Hobson, 1981; Levin et al., 2000), are involved in the initial oxi-dative step of the Embden-Meyerhof-Parnas pathway; thus, their decrease during postharvest must be related to respiration (Wills et al., 1982). The increase in the fructose-to-glucose ratio during storage is probably due to the different activity of the two molecules in metabol-ic pathways during postharvest, whmetabol-ich results in higher glucose consumption (Patching et al., 1975).
Similarly, the decrease in citric acid during post-harvest can be explained mainly by its participation in the first steps of the Krebs cycle. Contrary to citric acid, malic acid and glutamic acid increased during posthar-vest. Malic acid is the second most abundant acid in to-mato fruit, and in normal toto-matoes its content decreases markedly during ripening (Davies, 1966) and more slow-ly during postharvest (Thorne and Efiuvwevwere, 1988). However, malic acid metabolism is under ethylene regu-lation; Gao et al. (2007) reported increased malic acid during ripening in transgenic tomatoes with suppressed ethylene biosynthesis. The alc allele induces changes in the ethylene content (Mutschler, 1984) similar to those reported by Gao et al. (2007), so this may explain the postharvest increase in malic acid in Penjar tomatoes.
Glutamic acid is one of the major amino acids pres-ent in tomato fruits (Kader et al., 1978; Oruna-Concha et al., 2007), and its content increases 10-to-40-fold dur-ing ripendur-ing (Boggio et al., 2000; Oms-Oliu et al., 2011). However, less information is available about changes in glutamic acid content during postharvest, making it difficult to compare our results. Oms-Oliu et al. (2011) reported an increase in glutamic acid concentration dur-ing postharvest; however, the period analyzed was much shorter (10 days) than the 4 month period considered in our study. We found that glutamic acid continued to accumulate during extended storage in all the Penjar ac-cessions. It seems that the metabolic pathways related to glutamic acid accumulation are reinforced during stor-age (Freeman and Woodbridge, 1960; Sorrequieta et al., 2010).
the fruits’ storage ability. Moreover, we found a signifi-cant correlation (p < 0.05) between glutamic acid and fructose and glucose. Some authors have hypothesized that glutamic acid uptake in fruit is coupled to the mass flow of sucrose while the fruit is attached to the plant (Valle et al., 1998; Winter et al., 1992), and this hypoth-esis might explain the correlation observed between the concentration of sugars and glutamic acid.
During the aging phase, the sensory profile of Pen-jar tomatoes varies with changes in sugar and acid levels, as well as with changes in volatile concentrations (Casals et al., 2011). On the one hand, sweetness decreases with the reduction of glucose and fructose, although the un-usually high concentrations of these molecules at har-vest ensure adequate levels of sweetness during the first months of storage. On the other hand, although citric acid content decreased, the combined level of citric and malic acids remained unchanged during storage. This more acidic profile of aged Penjar tomatoes could explain the enhancement of some aroma descriptors in Penjar tomatoes reported by Casals et al. (2011), as acidity probably affects the perception of some volatiles (Baldwin et al., 2008). Finally, the increased glutamic acid concentration may also contribute to the apprecia-tion of the consumer for aged Penjar tomatoes.
Glutamate is a powerful taste enhancer (Bellisle, 1999), but its role in tomato flavor has been scarcely studied since Bucheli et al. (1999) who reported its nega-tive effect on fruitiness attribute. The combined effect of high concentrations of sugars and acid, together with the appearance of new flavors due to the rearrangement of the relative concentrations among volatiles and the increase in glutamic acid content, makes the period be-tween 1 and 4 months after harvest the best time to con-sume Penjar tomatoes. These findings on composi-tional changes during the aging phase and their relation to the commercial success of Penjar tomatoes could help breeders develop new cultivars with better flavor and longer shelf life.
Conclusions
The sugar-and-acid profile varies widely between accessions of the Penjar variety, but on average, sugar concentrations at harvest are higher than in convention-al tomatoes; higher concentrations of sugar are probably related to Penjar’s medium-small fruit size. Some of the studied accessions have good quality characteristics at harvest, making them particularly interesting as non-aged materials for quality markets or for use in breeding programs. During storage, concentrations of the com-pounds involved in the first steps of respiration (glucose, fructose, and citric acid) decrease, and concentrations of malic acid and glutamic acid increase significantly. Nevertheless, due to the high concentrations of sugars at harvest, acceptable levels of sweetness are maintained for several months after harvest. These postharvest changes contribute to the characteristic sensory profile
of Penjar tomatoes, which is highly appreciated by lo-cal consumers. Penjar tomatoes reach their best sensory quality between 1 and 4 months postharvest, although the shelf life of many accessions may exceed this period.
Acknowledgements
To Dr. Luís Bosch Roura for his active participa-tion in this study.
References
Baldwin, E.A.; Goodner, K.; Plotto, A. 2008. Interaction of volatiles, sugars, and acids on perception of tomato aroma and flavor descriptors. Journal of Food Science 73: S294-S307. Beckles, D.M. 2012. Factors affecting the postharvest soluble
solids and sugar content of tomato (Solanum lycopersicum L.) fruit. Postharvest Biology and Technology 63: 129-140. Bellisle, F. 1999. Glutamate and the UMAMI taste: sensory,
metabolic, nutritional and behavioural considerations: a review of the literature published in the last 10 years. Neuroscience & Biobehavioral Reviews 23: 423-438.
Boggio, S.B.; Palatnik, J.F.; Heldt, H.W.; Valle, E.M. 2000. Changes in amino acid composition and nitrogen metabolizing enzymes in ripening fruits of Lycopersicon esculentum Mill. Plant Science 159: 125-133.
Bota, J.; Conesa, M.À.; Ochogavia, J.M.; Medrano, H.; Francis, D.M.; Cifre, J. 2014. Characterization of a landrace collection for Tomàtiga de Ramellet (Solanum lycopersicum L.) from the Balearic Islands. Genetic Resources and Crop Evolution 61: 1131-1146.
Bucheli, P.; Voirol, E.; Torre, R. de la; Lopez, J.; Rytz, A.; Tanksley, S.D.; Petiard, V. 1999. Definition of nonvolatile markers for flavor of tomato (Lycopersicon esculentum Mill.) as tools in selection and breeding. Journal of Agricultural and Food Chemistry 47: 659-664.
Casals, J.; Cebolla-Cornejo, J.; Rosello, S.; Beltran, J.; Casanas, F.; Nuez, F. 2011. Long-term postharvest aroma evolution of tomatoes with the alcobaça (alc) mutation. European Food Research and Technology 233: 331-342.
Casals, J.; Pascual, L.; Canizares, J.; Cebolla-Cornejo, J.; Casanas, F.; Nuez, F. 2012. Genetic basis of long shelf life and variability into Penjar tomato. Genetic Resources and Crop Evolution 59: 219-229.
Causse, M.; Damidaux, R.; Rousselle, P. 2007. Traditional and enhanced breeding for quality traits in tomato. v. 2, p. 153-192. In: Razdan, M.K.; Mattoo, A.K., eds. Genetic improvement of Solanaceous crops: tomato. CRC Press, Boca Raton, FL, USA. Cebolla-Cornejo, J.; Valcarcel, M.; Herrero-Martinez, J.M.; Rosello,
S.; Nuez, F. 2012. High efficiency joint CZE determination of sugars and acids in vegetables and fruits. Electrophoresis 33: 2416-2423.
Davies, J.N. 1966. Changes in non-volatile organic acids of tomato fruit during ripening. Journal of the Science of Food and Agriculture 17: 396-400.
Ercolano, M.R.; Carli, P.; Soria, A.; Cascone, A.; Fogliano, V.; Frusciante, L.; Barone, A. 2008. Biochemical, sensorial and genomic profiling of traditional Italian tomato varieties. Euphytica 164: 571-582.
Freeman, J.A.; Woodbridge, C.G. 1960. Effect of maturation, ripening and truss position on the free amino acid content in tomato fruits. Proceedings of the American Society for Horticultural Science 76: 515-523.
Gao, H.Y.; Zhu, B.Z.; Zhu, H.L.; Zhang, Y.L.; Xie, Y.H.; Li, Y.C.; Luo, Y.B. 2007. Effect of suppression of ethylene biosynthesis on flavor products in tomato fruits. Russian Journal of Plant Physiology 54: 80-88.
Getinet, H.; Seyoum, T.; Woldetsadik, K. 2008. The effect of cultivar, maturity stage and storage environment on quality of tomatoes. Journal of Food Engineering 87: 467-478.
Javanmardi, J.; Kubota, C. 2006. Variation of lycopene, antioxidant activity, total soluble solids and weight loss of tomato during postharvest storage. Postharvest Biology and Technology 41: 151-155.
Kader, A.A.; Stevens, M.A.; Albright, M.; Morris, L.L. 1978. Amino-acid composition and flavor of fresh market tomatoes as influenced by fruit ripeness when harvested. Journal of the American Society for Horticultural Science 103: 541-544. Klee, H.J.; Giovannoni, J.J. 2011. Genetics and control of tomato
fruit ripening and quality attributes. Annual Review of Genetics 45: 41-59.
Kopeliovitch, E.; Mizrahi, Y.; Rabinowitch, H.D.; Kedar, N. 1980. Physiology of the tomato mutant alcobaça. Physiologia Plantarum 48: 307-311.
Levin, I.; Gilboa, N.; Yeselson, E.; Shen, S.; Schaffer, A.A. 2000.
Fgr, a major locus that modulates the fructose to glucose ratio in mature tomato fruits. Theoretical and Applied Genetics 100: 256-262.
Levin, I.; Schaffer, A.A. 2013. Mapping and tagging of simply inherited traits. p. 109-149. In: Liedl, B.E.; Labate, J.A.; Stommel, J.R.; Slade, A.; Chittaranjan, K., eds. Genetics, genomics and breeding of tomato. CRC Press, Boca Raton, FL, USA.
Loiudice, R.; Impembo, M.; Laratta, B.; Villari, G.; Lovoi, A.; Siviero, P.; Castaldo, D. 1995. Composition of San-Marzano tomato varieties. Food Chemistry 53: 81-89.
Mutschler, M. 1984. Ripening and storage characteristics of the alcobaça ripening mutant in tomato. Journal of the American Society for Horticultural Science 109: 504-507.
Mutschler, M.; Guttieri, M.; Kinzer, S.; Grierson, D.; Tucker, G. 1988. Changes in ripening-related processes in tomato conditioned by the alc mutant. Theoretical and Applied Genetics 76: 285-292.
Oms-Oliu, G.; Hertog, M.L.A.T.M.; Poel, B. van de; Ampofo-Asiama, J.; Geeraerd, A.H.; Nicolai, B.M. 2011. Metabolic characterization of tomato fruit during preharvest development, ripening, and postharvest shelf-life. Postharvest Biology and Technology 62: 7-16.
Oruna-Concha, M.J.; Methven, L.; Blumenthal, H.; Young, C.; Mottram, D.S. 2007. Differences in glutamic acid and 5'-ribonucleotide contents between flesh and pulp of tomatoes and the relationship with umami taste. Journal of Agricultural and Food Chemistry 55: 5776-5780.
Patching, C.R.; Maw, G.A.; Davies, J.N. 1975. Metabolism of glucose during ripening of detached tomato fruit. Journal of the Science of Food and Agriculture 26: 23-29.
Prudent, M.; Causse, M.; Genard, M.; Tripodi, P.; Grandillo, S.; Bertin, N. 2009. Genetic and physiological analysis of tomato fruit weight and composition: influence of carbon availability on QTL detection. Journal of Experimental Botany 60: 923-937. Robinson, R.W.; Tomes, M.L. 1968. Ripening inhibitor: a gene
with multiple effects on ripening. Report of the Tomato Genetics Cooperative 18: 36-37.
Rosales, M.A.; Rubio-Wilhelmi, M.M.; Castellano, R.; Castilla, N.; Ruiz, J.M.; Romero, L. 2007. Sucrolytic activities in cherry tomato fruits in relation to temperature and solar radiation. Scientia Horticulturae 113: 244-249.
Sakiyama, R.; Stevens, M.A. 1976. Organic-acid accumulation in attached and detached tomato fruits. Journal of the American Society for Horticultural Science 101: 394-396.
Saladie, M.; Matas, A.J.; Isaacson, T.; Jenks, M.A.; Goodwin, S.M.; Niklas, K.J.; Ren, X.L.; Labavitch, J.M.; Shackel, K.A.; Fernie, A.R.; Lytovchenko, A.; O'Neill, M.A.; Watkins, C.B.; Rose, J.K.C. 2007. A reevaluation of the key factors that influence tomato fruit softening and integrity. Plant Physiology 144: 1012-1028.
Siracusa, L.; Patane, C.; Avola, G.; Ruberto, G. 2012. Polyphenols as chemotaxonomic markers in italian "long-storage" tomato genotypes. Journal of Agricultural and Food Chemistry 60: 309-314.
Sorrequieta, A.; Ferraro, G.; Boggio, S.B.; Valle, E.M. 2010. Free amino acid production during tomato fruit ripening: a focus on l-glutamate. Amino Acids 38: 1523-1532.
Thorne, S.N.; Efiuvwevwere, B.J.O. 1988. Changes in organic-acids in chilled tomato fruit (Lycopersicon esculentum Mill.). Journal of the Science of Food and Agriculture 44: 309-319. Valle, E.M.; Boggio, S.B.; Heldt, H.W. 1998. Free amino acid
composition of phloem sap and growing fruit of Lycopersicon esculentum. Plant and Cell Physiology 39: 458-461.
Watada, A.E.; Herner, R.C.; Kader, A.A.; Romani, R.J.; Staby, G.L. 1984. Terminology for the description of developmental stages of horticultural crops. Hortscience 19: 20-21.
Wills, R.B.H.; Lee, T.H.; Graham, D.; McGlasson, W.B.; Hall, E.G. 1982. Postharvest, An Introduction to the Physiology and Handling of Fruit and Vegetables. New South Wales University
Press, Kensington, UK.