http://dx.doi.org/10.1590/s2175-97902017000215022
*Correspondence: X. Liu. Department of Orthopaedic Surgery, The Children’s Hospital Chongqing Medical University, Chongqing, 400014, P. R. China. E-mail: 1915377569@qq.com
Metabolic analysis of the effect of rheum on a
taurocholate-induced acute pancreatitis rat model
Zhonghua Chen
1,2, Li Shen
1, Changyong Yang
1, Jinghui Jiang
1, Xing Liu
3,*1Department of Pharmacology, West China School of Pharmacy, Sichuan University, Chengdu, People’ s Republic of China, 2Key laboratory of Drug Targeting, Ministry of Education, West China School of Pharmacy, Sichuan University, Chengdu, People’ s Republic of China, 3Department of Orthopaedic Surgery, The Children’s Hospital Chongqing Medical University,
Chongqing, People’ s Republic of China
The efects of rheum on serum parameters in a taurocholate-induced acute pancreatitis (AP) rat model were investigated using pathological and biochemical tests, and a proton nuclear magnetic resonance (1H NMR)-based metabonomic strategy. Healthy rats and rats with AP were either treated with rheum (7.5% at a dose of 1.5 g/kg) or left untreated. Serum samples were collected from the AP and rheum-treated groups at 6, 12, and 24 h after treatment. The efect of rheum on pathological changes in the pancreatic was investigated to validate the AP model. We obtained 1H NMR spectra and analyzed the results using the partial least squares discriminant method. The results of the pathological and metabolic analyses revealed an amelioration of multiple metabolic abnormalities and an increase in the aerobic respiration ratio after treatment, compared with the AP groups. These results were attributed to improvements in energy supply and the elimination of metabolic products. The study also promoted NMR-based metabonomic analysis as a feasible method of assessing traditional Chinese drugs.
Uniterms: Rheum/efects. Acute pancreatitis/analysis. Metabolomics. 1H NMR. Pathological changes. Rats.
INTRODUCTION
Pancreatitis is inflammation of the pancreas, including aseptic, bacterial, and chronic non-specific inflammation, and specific inflammation caused by
tuberculosis or parasites. Acute pancreatitis (AP),
chronic pancreatitis, and specific pancreatitis are the
most common clinical types (Crocker, 2012), of which AP is associated with the highest morbidity and mortality (Barreto, Rodrigues, 2008). Evidence indicates that
pancreatin-induced autodigestion of the pancreatic tissue
can lead to acute chemical inlammation in AP (Markus, 2013). However, there is currently no efective clinical treatment for AP owing to its complex pathophysiology and pathogenesis (Braganza, 2001; Gaisano, Gorelick, 2009; Kostyrnoi, 2012).
Rheum is a perennial herbaceous plant of the
Polygonaceae family. According to the Pharmacopoeia of the People’s Republic of China 2010 (Chinese Pharmacopoeia Commission, 2010), the dry roots or
rhizomes of Rheum palmatum L., Rheum tangguticum Maxim. ex Balf, and Rheum officinale Baill are the
standard medicinal portions of rheum. Rheum has been used widely in traditional Chinese medicine to treat numerous commonly encountered diseases such as
acute abdominal disorders (Chinese Pharmacopoeia Commission, 2010). Zhang et al. (2004) reported that
patients who received integrated traditional Chinese
medicine–western medicine (TCM-WM) presented with lower mortality (10.77%) than those who received monotherapy (40.52%). Moreover, classic ancient books and records mention the use of rheum as therapy for AP (Jiangsu New Medical College, 1997; Xiao, 2002). With the development of integrated TCM-WM, rheum has
become one of the main components of traditional Chinese medicine. The role of rheum in a variety of effective
Metabolomics is a systemic approach to metabolism
research by analysis of metabolite proiles in the body luids of an organism, followed by comparison of the variations induced by external stimuli or genovariation (Nicholson, Lindon, Holmes, 1999). Nuclear magnetic resonance (NMR), which has been very useful for characterizing physiological metabolites in bioluids, is one of the techniques used in metabolomics (Chen et al., 2012). However, analysis by NMR is diicult owing to the complexity of NMR spectral profiling arising
from thousands of signals from endogenous molecules.
Usually, principal component analysis (PCA), cluster
analysis, and neuron analysis are coupled with NMR
data analysis; PCA is the most popular technique. Partial
least squares projection to latent structure discriminant
analysis (PLS-DA), which is a PCA technique, is a type
of supervised analysis related to unsupervised analysis. It can involve dividing the samples into groups before
analysis, and ignoring random diferences in existing groups (Zhang et al., 2013). Since 1999, metabonomics
has been widely used to assess the pharmacological
safety and toxicological mechanism of drugs in animal models. (Shi et al., 2007; Wei et al., 2008).
In the present study, we used a metabolomic
approach involving proton nuclear magnetic resonance (1H
NMR) spectroscopy with PCA to analyze samples from AP rat serum. PLS-DA was used to explore the diferences
among groups and to characterize the metabonomic metabolites. Furthermore, the effect of rheum on pancreatic pathology was also investigated to validate
the AP rat model. The objectives of this research were: to
demonstrate a new method of assessing traditional Chinese
drugs; to investigate the oral potency of rheum in rat metabolism; to characterize alterations in metabolites after administering rheum to AP rat models; and to illustrate the
underlying mechanisms.
MATERIAL AND METHODS
Reagents
Sodium taurocholate was acquired from Sigma (St Louis, USA). Methanol, sodium dihydrogen phosphate,
disodium hydrogen phosphate, and kits for measuring glucose, fatty acids, valine, histidine, and creatinine levels
were purchased from the Huayi Company (Shanghai, China). Chloralhydrate was acquired from Kelun Pharmaceutical Co. (Chengdu, China). The Hypersil ODS2 column (150×4.6 mm) was from Thermo Hypersil Co. (the United Kingdom).
Test compound preparation
Dried rheum root was acquired from Derentang
Pharmacy (Chengdu, China) in August, 2009. To
investigate the main constituents of the rheum, the root was
ground into a powder and passed through a sieve (60 mesh).
The contents of the sample powder were then investigated
using high-performance liquid chromatography (HPLC).
The powder was stored in a desiccated environment at
room temperature until required. Aloe-emodin (110795-200806), Physcion (110758-200610), Emodin (110756-200710), Chrysophanol (0796-200705), and Rhein (0757-200802) standardization controls were from the National Institute for the Control of Pharmaceutical and Biological
Products.
Mass detection
The rheum was made into a suspension solution
before our experiment commenced. The rheum powder (7.50 g) was added to approximately 100 mL boiled vehicle (0.5% saline plus sodium carboxymethyl cellulose), mixed, and 100.0 mL was measured out.
Finally, we obtained a well-distributed brownish yellow
7.5% rheum suspension. Afterwards, the rheum was
analyzed in accordance with the Pharmacopoeia of the
People’s Republic of China 2010 (Chinese Pharmacopoeia Commission, 2010). The HPLC system, comprising a Hypersil ODS2 column (150 × 4.6 mm) (Thermo Hypersil Co., United Kingdom) and methanol:0.1% phosphate solution (85:15), operated at a volumetric flow rate of
1.0 mL·min-1, a wavelength of 254 nm, and a temperature
of 25 °C, was used to validate the mass of the crude drug. The HPLC chromatograms are shown in Figure 1.
By matching the retention times and peak area, the
contents of the ive principal components in rheum, i.e., Aloe-emodin, Physcion, Emodin, Chrysophanol, and Rhein, were determined to be 2.57, 3.65, 1.91, 6.93, and 1.01 mg·g-1, respectively. All these ive major components
constituted 1.61% of the crude mixture, which met the
quality requirements (not less than 1.5%). Rheum was administered to the rats in this study.
Animals
The study was approved by the Institutional Animal
Use and Care Committee of Sichuan University, and the
FIGURE 1 - High-performance liquid chromatography (HPLC) chromatograms of Standards (A) and Samples (B). 1.
Aloe-emodin (tR = 3.516 min); 2. Rhein (tR = 4.605 min); 3. Emodin (tR = 6.316 min); 4. Chrysophanol (tR = 8.306 min); 5. Physcion
(tR = 11.509 min)
kept at the Animal Laboratory of Sichuan University under the following conditions: a 12 h light/dark cycle; free access to standard laboratory feed and water; 20-24 °C;
and 50-60% humidity.
Grouping and administration
A total of 56 rats were randomly divided into eight groups: a 6-h AP group (n = 7), a 12-h AP group (n = 7),
a 24-h AP group (n = 7), a 6-h medication group (n = 7), a 12-h medication group (n = 7), a 24-h medication group (n = 7), a control group (n = 7), and a control-medication group (n = 7).
The rats were all fasted for 12 h but had free access to water before the operation. Two hours before the operation, rats from the control-medication group, the 6-h medication group, the 12-h medication group, and the
suspension (2 mL/100 g, intragastric administration (ig)), and the other groups were administered 0.5% sodium carboxymethyl cellulose in physiological saline solution (2 mL/100 g, ig).
Operation
The rats were anesthetized by intraperitoneal
injection of 10% chloralhydrate (0.3 mL/100 g). An incision (approximately 1 cm long) was made along the midline of the abdomen and the duodenum was clamped. A
needle was inserted into the anterior wall of the duodenum
close to the bile duct. When the needle had penetrated
1 cm into the choledoc, the biliopancreatic duct on the porta of the hepatic side was clamped using a small artery
clamp, and physiological saline solution (0.1 mL/100 g) (control and control-medication group) or 0.3% sodium taurocholate (0.1 mL/100 g) (other AP and medication groups) was injected uniformly. After 5 min of injection,
the artery clamp was removed and the abdomen was sutured.
Sample collection
The rats were sacrificed by femoral artery
exsanguination under anesthesia at 6 h (6-h AP, 6-h medication, control, and control-medication groups), 12 h (12-h AP and 12-h medication groups), and 24 h (24-h AP and 24-h medication groups) after the operation. The blood
samples were collected in centrifuge tubes and centrifuged
(4°C, 3000 rpm, 10 min) to remove the precipitates. The
serum samples were separated and stored at -80°C for biochemical and metabonomic analysis. The pancreas was removed to provide specimens for pathological
examination following blood collection.
Pathological measurement and biochemical analysis
The hiso-pancreas samples were fixed in 10% neutral formalin, embedded in paraffin, sectioned (5 μm), and stained with hematoxylin and eosin (HE) for microscopic examination. The histopathological score of
the hiso-pancreas was valued according to the Schmidt
criteria (Norman et al., 1997; Banks et al., 2013) by the
double-blind method. Serum samples were used for the determination of several major metabolites, including
glucose (50 μL), fatty acids (50 μL), valine (100 μL), histidine (100 μL), and creatinine (300 μL), using
homologue kits.
1H NMR spectroscopic measurement and analysis
After the biochemical tests, serum samples (400 μL) were centrifuged (4°C, 14000 rpm, 10 min), and the
supernatant was mixed with 50 μL D2O (99.8%, 0.5 mL) and 50 μL phosphate bufer solution (0.2 mol/L Na2HPO4 and 0.2 mol/L NaH2PO4, pH 7.4) to minimize variations in the pH of the serum samples. The samples were transferred to 5-mm NMR tubes, and investigated using an 1H NMR spectrometer at 600.13 MHz (Bruker Av II
600 spectrometer). The water-suppressed Carr–Purcell– Meiboom–Gill pulse (CPMG pulse) sequence method was used. The 64 free induction decay (FID) signals were represented by 64 K data points with a spectral width of 7002.8 Hz, an acquisition time of 4.68 s, and a total pulse recycle delay of 6.68 s at a temperature of 298 K.
All NMR spectra were manually re-phased and
baseline-corrected. The data were then reduced to 225
integrated regions of equal width (0.04 ppm) corresponding
to the δ9.5–δ0.5 region using the MestRe-C4.7 software package. The δ5.0–δ4.6 regions of the CPMG spectra were
excluded to eliminate artifacts caused by the resonance of residual water. All the remaining spectral segments were
scaled to the total integrated area of the spectrum to reduce variations in concentration.
The 1H NMR spectra were all obtained by the
same procedure, and all segments were imported into
Microsoft Excel to obtain a (7 × 215)-dimension matrix (the number of samples was 7; the number of segment
regions outside δ5.0–δ4.6 was 215). The output files
were fed into SIMCA-P11.0 software for PLS-DA to maximize the diference between groups. A plot of the scores was used to establish signiicance in the data, and the loading plots were used to identify diferent chemical shifts. Metabolites with diferent chemical shifts were
assigned based on the human metabolome database
(HMDB) (Wishart et al., 2007), and certain other related research articles (Yang et al., 1999; Bloomer, Stagliano, Gazzillo, 1993).
RESULTS
Effect of rheum on pancreatic pathology in AP rats
Pancreatic pathology was determined using the Schmidt scoring criteria. The Schmidt scores for pancreatic edema, acinar necrosis, hemorrhage, fat
necrosis, inlammation, and perivascular iniltration were
calculated. The rats in the control and control-medication
in Figure 2, the rats in the AP groups scored higher than
those in the medication groups for each pathological category at the same time-point, and the Schmidt score
increased as time progressed after AP modeling in all
groups. Similar pathological alterations were revealed by
microscopic examination (Figure 3).
FIGURE 3 - Hematoxylin and eosin (HE) staining (200×). A, B: Normal pancreatic tissue with no pathological damage. C: Edema
(indicated by the yellow arrow), inlammation iniltrate (indicated by the blue arrow), and mild hemorrhage (indicated by the blue oval) are evident. D: Inlammation iniltrate (indicated by the blue arrow) is less pronounced than in C. E: Iniltrate (indicated by the blue arrow) and severe hemorrhage (indicated by the blue oval) are clear. F: There is mild iniltrate (indicated by the blue oval). G: Severe acinar necrosis (indicated by the green oval). H: Less pronounced acinar necrosis compared with G (indicated by the green oval).
FIGURE 2 - Schmidt scores for the acute pancreatitis (AP) and medication groups. *p < 0.05 for comparison between the
Biochemical analysis of serum samples
The results of the biochemical analyses are reported in Table I. Compared with the control group, there were reduced glucose and increased fatty acid levels in the
AP and AP medication groups (6 h, 12 h, and 24 h). For
both valine and histidine, increases only occurred in the
AP groups (6 h, 12 h, and 24 h). Serum creatinine levels in all the AP and AP medication groups (6 h, 12 h, and 24 h) were much higher than in the control and
control-medication groups.
PLS-DA analysis of serum samples
We used PLS-DA to classify the diferences among
the groups and to characterize the metabolites that contributed to disparities. The δ9.5–δ0.5 ppm region
was chosen for calculation of PLS-DA. According to the
analysis of serum samples, the control group, the
control-medication group, the AP groups (6 h, 12 h, and 24 h), and the medication groups (6 h, 12 h, and 24 h) showed signiicant diferences in chemical shifts, especially in the δ3.00–δ4.00 and δ4.50–δ5.20 regions. The analyses are described below.
Control group and control-medication group
Using the results for the serum samples from the control and control-medication groups, we calculated
the principal component of the dedication rate of the irst two values to be 94.77%. Therefore, principal component
values 1 and 2 were selected to draw the score plot
(Figure 4). The control and control-medication groups
were signiicantly separated along the t-axis on the plot (Ammann, Adler, Buchler, 2004), and there was an
obvious distinction between the two groups. The possible
main metabolites associated with the diferences were then characterized using the loading plot (Figure 5). Compared
with the control group, there were increases in cholestanone
(δ0.66, δ0.74),β-hydroxybutyric acid (δ1.34), succinic acid (δ2.42), citric acid (δ2.70), α-ketoglutaric acid
(δ2.98), malic acid (δ4.30), testosterone (δ5.74), emodin (δ7.10), chrysophanol (δ7.34), rhein (δ7.42), 2,5-dimethyl-7-methoxy chromone (δ7.82, δ7.90), inosine
(δ4.34), inosinic acid (δ6.14), and [NADH] (δ8.22, δ8.46); and decreases in lipids (δ1.58, δ1.94,δ4.26), creatinine
(δ3.02, δ3.94), bilirubin (δ5.66), pteridine (δ8.74), and [NAD+] (δ9.34).
Control group and AP groups (6 h, 12 h, and 24 h)
Using the results for the serum samples from the
control group and the three AP model groups (6 h, 12 h, and 24 h), we calculated the principal component of the dedication rate of the irst two values to be 85.23%.
Therefore, principal component values 1 and 2 were
selected to draw the score plot (Figure 6). The control and AP groups, especially the 6-h and 12-h AP groups, were separated along the t-axis on the plot (Ammann, Adler, Buchler, 2004). The possible main metabolites that contributed to diferences were characterized based on the corresponding loading plot (Figure 7). Compared with the
control group, there were increases in β-hydroxybutyric
acid (δ1.22, δ1.34), lactic acid (δ1.42), acetoacetic acid (δ2.26), valine (δ2.30), deoxyadenosine (δ2.82, δ6.42), creatinine (δ3.02, δ3.06, δ3.94),
trimethylamine-N-TABLE I - Serum levels of major metabolites in the control, control-medication, and acute pancreatitis (AP) groups at 6 h, 12 h,
and 24 h; and in the medication groups at 6 h, 12 h, and 24 h
Group (n = 7)
Glucose (mmol/L)
Fatty acid (µg/L)
Valine (U/mL)
Histidine (U/mL)
Creatinine (µmol/L)
6-h AP 4.62 ± 1.82† 22.65 ± 2.65 15.24 ± 5.24† 52.54 ± 2.54† 167.88 ± 67.88†
12-h AP 3.57 ± 1.29† 23.54 ± 3.54 13.65 ± 3.65† 53.61 ± 3.61† 170.54 ± 70.54†
24-h AP 3.24 ± 1.46† 23.67 ± 3.67 14.55 ± 4.55† 51.93 ± 1.93† 199.52 ± 99.52†
6-h medication 4.77 ± 1.76† 38.99 ± 8.99†* 8.12 ± 1.29* 32.55 ± 2.55* 143.54 ± 43.54†
12-h medication 3.65 ± 1.45† 37.65 ± 7.65†* 8.04 ± 0.45* 33.62 ± 3.62* 156.21 ± 56.21†
24-h medication 3.44 ± 1.73† 38.04 ± 8.04†* 7.91 ± 9.14* 32.47 ± 2.47* 178.52 ± 78.52
Control-medication 8.66 ± 1.98 20.77 ± 0.20 8.05 ± 0.50 33.02 ± 3.02 28.54 ± 8.54†
Control 8.48 ± 2.52 21.52 ± 1.52 7.94 ± 0.94 32.51 ± 2.51 49.54 ± 9.54
*p < 0.05 for comparison between the corresponding groups (6-h AP group vs 6-h medication group; 12-h AP group vs 12-h
oxide (TMAO) (δ3.26), urea nitrogen (δ3.34, δ5.52, δ6.00), phosphoenolpyruvate (δ5.18), adenine (δ8.10), heteroauxin (δ7.22), histidine (δ7.30), phenylacetylglycine (PAG) (δ7.34, δ7.42), hippuric acid (δ7.54, δ7.58), pyrimidine (δ7.62, δ8.82), and [NAD+] (δ9.34); and
decreases in glucose (δ2.94, δ3.70, δ3.86, δ4.34), 5-hydroxytryptamine (5-HT) (δ6.86), formic acid (δ8.42), pteridine (δ8.74), and [NADH] (δ8.22).
Control group and medication groups (6-h, 12-h, and 24-h)
Using the results for the serum samples from the
control group and the three medication groups (6-h, 12-h, and 24-h), we calculated the principal component dedication rate of the first two values to be 86.75%.
Therefore, the principal component values 1 and 2 were FIGURE 5 - Loading plot of the proton nuclear magnetic resonance (1H NMR) spectra of serum samples from the control and
control-medication groups.
FIGURE 4 - Score plot of the irst two values of the proton nuclear magnetic resonance (1H NMR) spectra of serum samples from
selected to draw the score plot (Figure 8). The control and medication groups (6-h and 12-h) were separated along the t-axis (Ammann, Adler, Buchler, 2004); diferences were also observed among the 6-h, 12-h, and
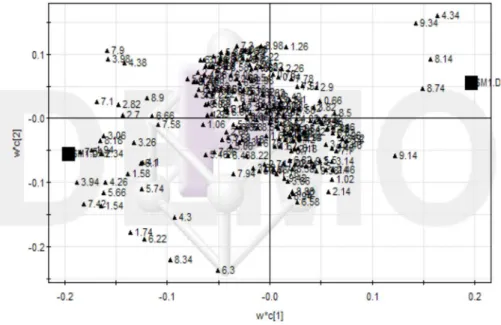
24-h medication groups. The possible main metabolites
contributing to diferences were then characterized based
on the corresponding loading plot (Figure 9). Compared
with the control group, there were increases in fatty acids
(δ1.54, δ1.58), stearic acid (δ1.74), lipids (δ2.70, δ4.26), unsaturated fatty acid (δ2.82), creatinine (δ3.06, δ3.94), TMAO (δ3.26), hippurate (δ3.98), lactic acid (δ4.10), testosterone (δ5.74), emodin (δ6.66, δ7.10), 2,5-dimethyl-FIGURE 7 - Loading plot of the proton nuclear magnetic resonance (1H NMR) spectra of serum samples from the control and acute
pancreatitis (AP) groups (6-h, 12-h, and 24-h).
FIGURE 6 - Score plot of the irst two values of the proton nuclear magnetic resonance (1H NMR) spectra of serum samples from
7-methoxy chromone (δ7.90), adenine (δ8.10), PAG (δ4.38,δ6.10,δ6.22), inosine (δ4.34, δ8.18), inosinic acid (δ6.14), and [NADH] (δ4.38, δ6.10,δ6.22); and decreases in glucose (δ4.34), bilirubin (δ5.66), pteridine (δ8.74), and [NAD+] (δ8.14, δ9.14,δ9.34).
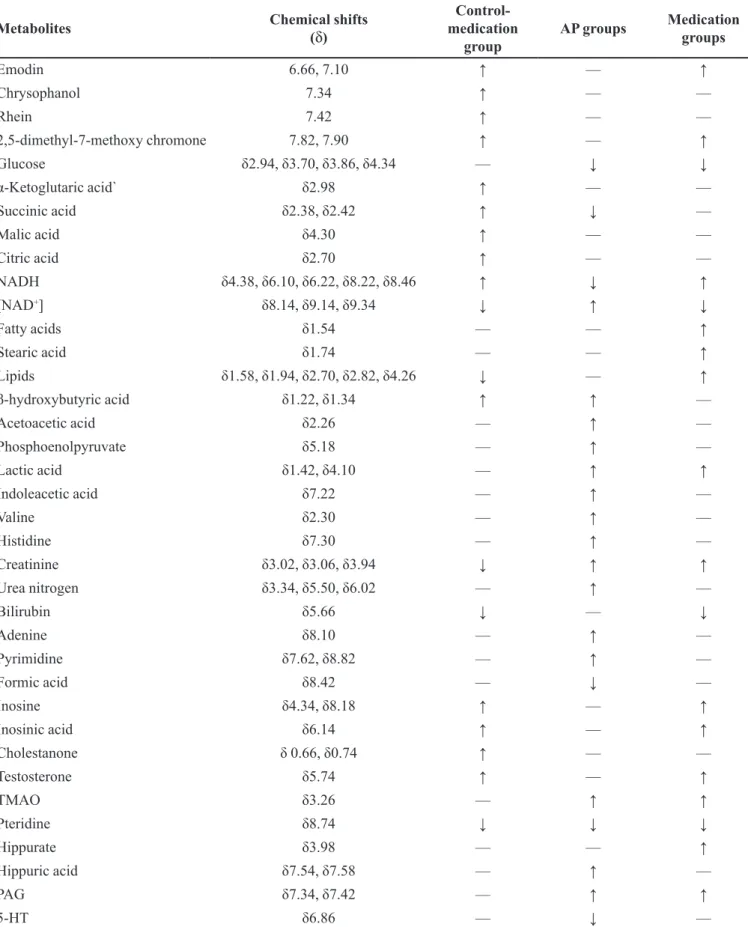
Summary
The detailed variations in the endogenous
metabolites detected in the serum samples indicated on the loadings plots are shown in Tables II and III.
DISCUSSION
In recent decades, various animal models have been
established for AP research; the four most common models are induced by cerulein (Dembinski et al., 2008), l-arginine
(Ji et al., 2003), dl-ethionine (Sewing, Albinus, 1969),
FIGURE 9 - Loading plot of the proton nuclear magnetic resonance (1H NMR) spectra of serum samples from the control and
medication groups (6-h, 12-h, and 24-h).
FIGURE 8 - Score plot of the irst two values of the proton nuclear magnetic resonance (1H NMR) spectra of serum samples from
TABLE II - Summary of the variations in metabolites detected in the serum samples from the control-medication group, the acute
pancreatitis (AP) groups (6-h, 12-h, and 24-h), and the medication groups (6-h, 12-h, and 24 h) compared with the control group
Metabolites Chemical shifts
(δ)
Control- medication
group
AP groups Medication groups
Emodin 6.66, 7.10 ↑ — ↑
Chrysophanol 7.34 ↑ — —
Rhein 7.42 ↑ — —
2,5-dimethyl-7-methoxy chromone 7.82, 7.90 ↑ — ↑
Glucose δ2.94,δ3.70,δ3.86,δ4.34 — ↓ ↓
α-Ketoglutaric acid` δ2.98 ↑ — —
Succinic acid δ2.38,δ2.42 ↑ ↓ —
Malic acid δ4.30 ↑ — —
Citric acid δ2.70 ↑ — —
NADH δ4.38,δ6.10,δ6.22,δ8.22,δ8.46 ↑ ↓ ↑
[NAD+] δ8.14,δ9.14,δ9.34 ↓ ↑ ↓
Fatty acids δ1.54 — — ↑
Stearic acid δ1.74 — — ↑
Lipids δ1.58,δ1.94,δ2.70,δ2.82,δ4.26 ↓ — ↑
β-hydroxybutyric acid δ1.22,δ1.34 ↑ ↑ —
Acetoacetic acid δ2.26 — ↑ —
Phosphoenolpyruvate δ5.18 — ↑ —
Lactic acid δ1.42,δ4.10 — ↑ ↑
Indoleacetic acid δ7.22 — ↑ —
Valine δ2.30 — ↑ —
Histidine δ7.30 — ↑ —
Creatinine δ3.02,δ3.06,δ3.94 ↓ ↑ ↑
Urea nitrogen δ3.34,δ5.50,δ6.02 — ↑ —
Bilirubin δ5.66 ↓ — ↓
Adenine δ8.10 — ↑ —
Pyrimidine δ7.62,δ8.82 — ↑ —
Formic acid δ8.42 — ↓ —
Inosine δ4.34,δ8.18 ↑ — ↑
Inosinic acid δ6.14 ↑ — ↑
Cholestanone δ 0.66, δ0.74 ↑ — —
Testosterone δ5.74 ↑ — ↑
TMAO δ3.26 — ↑ ↑
Pteridine δ8.74 ↓ ↓ ↓
Hippurate δ3.98 — — ↑
Hippuric acid δ7.54,δ7.58 — ↑ —
PAG δ7.34,δ7.42 — ↑ ↑
TABLE III - Summary of the variations in metabolites detected in the serum samples from the medication groups compared with
the acute pancreatitis (AP) groups
Metabolites Chemical shifts AP-medication groups
Emodin δ6.66,δ7.10 ↑
Chrysophanol δ7.34 —
Rhein δ7.42 —
2,5-dimethyl-7-methoxy chromone δ7.82,δ7.90 ↑
Glucose δ2.94,δ3.70,δ3.86,δ4.34 —
α-Ketoglutaric acid δ2.98 —
Succinic acid δ2.38,δ2.42 ↑
Malic acid δ4.30 —
Citric acid δ2.70 —
NADH δ4.38,δ6.10,δ6.22,δ8.22,δ8.46 ↑
[NAD+] δ8.14
,δ9.14,δ9.34 ↓
Fatty acids δ1.54 ↑
Stearic acid δ1.74 ↑
Lipids δ1.58,δ1.94,δ2.70,δ2.82,δ4.26 ↑
β-hydroxybutyric acid δ1.22,δ1.34 ↓
Acetoacetic acid δ2.26 ↓
Phosphoenolpyruvate δ5.18 ↓
Lactic acid δ1.42,δ4.10 —
Indoleacetic acid δ7.22 ↓
Valine δ2.30 ↓
Histidine δ7.30 ↓
Creatinine δ3.02,δ3.06,δ3.94 —
Urea nitrogen δ3.34,δ5.50,δ6.02 ↓
Bilirubin δ5.66 ↓
Adenine δ8.10 ↓
Pyrimidine δ7.62,δ8.82 ↓
Formic acid δ8.42 ↑
Inosine δ4.34,δ8.18 ↑
Inosinic acid δ6.14 ↑
Cholestanone δ0.66,δ0.74 —
Testosterone δ5.74 ↑
TMAO δ3.26 —
Pteridine δ8.74 —
Hippurate δ3.98 ↑
Hippuric acid δ7.54,δ7.58 ↓
PAG δ7.34,δ7.42 —
5-HT δ6.86 ↑
and sodium taurocholate (Lombardi, Estes, Longnecker, 1975). Of those, the sodium taurocholate-induced AP rat model exhibits high repeatability and an achievement ratio of 100%. Moreover, topical administration of
sodium taurocholate causes limited impairment of the other organs. Furthermore, the pathological changes after modeling are similar to those in pancreatitis caused by autodigestion of the pancreas tissue. In this study, we replicated the stability of a sodium taurocholate-induced
AP rat model.
PLS-DA, which is a PCA technique, is a type of supervised analysis related to unsupervised analysis; it can
involve dividing the samples into groups before analysis,
and ignoring random diferences between existing groups. Allowing for the grouping of animal serum samples in our test, the PLS-DA method was used to determine the diferences between the metabonomic values found with
rheum and the physiological metabonomic parameters among the other groups, and to characterize the metabolites on score and loading plots.
Effect on pancreatic pathological changes
According to the pancreatic tissue slices,
pathological changes were not noted in the control and control-medication groups. However, pancreatic dropsy, acinus necrosis, hemorrhage, steatonecrosis, and
inlammatory cell iniltration were observed in the other
groups, which indicated that sporadic necrosis occurred
and protein iniltrate was markedly alleviated. Iniltration of inlammatory cells was obvious in the AP medication
groups. There was also a reduction in the pathologic score
in the AP medication groups. The results described above
indicate that rheum might ameliorate the pathological
changes in rats with AP.
Effect on metabolism of the major components of rheum
Emodin, chrysophanol, rhein, and
2,5-dimethyl-7-methoxy chromone are the main components of rheum (Yang et al., 1999). A study by Bloomer, Stagliano, and Gazzillo (1993) indicated that the chemical shifts
of emodin, chrysophanol, rhein, and
2,5-dimethyl-7-methoxy chromone were δ7.10,δ7.34,δ7.42, and (δ7.82, δ7.9), respectively. In the test, chrysophanol, rhein, and
2,5-dimethyl-7-methoxy chromone increased in the
control-medication group compared with the control group. Similarly, there were increased levels of emodin
and 2,5-dimethyl-7-methoxy chromone in the medication groups, which indicated that rheum is eiciently absorbed
via oral gavage. As well as emodin and 2,5-dimethyl-7-methoxy chromone, chrysophanol and rhein were present
at the same levels in the control and medication groups. It is possible that the serum concentrations of chrysophanol and rhein decreased as the drug was metabolized. However,
residual emodin and 2,5-dimethyl-7-methoxy chromone
were detected in the serum because their contents in rheum were much higher than those of chrysophanol and rhein
(Bloomer, Stagliano, Gazzillo, 1993). Moreover, Shia et al. (2009) suggested that rhein, emodin, and chrysophanol
glucuronides were predominant in the blood via oral
administration; in our studies, emodin, chrysophanol, rhein, and 2,5-dimethyl-7-methoxy chromone were still signiicantly distinguishable on the loading plots compared
with the other metabolites, which might be attributed to the shortening of persistence time and pathological changes.
Effect on carbohydrates, lipids, protein metabolism, and nucleic acid metabolism
α-ketoglutaric acid, succinic acid, malic acid, and citric acid are the main intermediate products in the
tricarboxylic acid (TCA) cycle. In the TCA, acetyl CoA condenses with oxaloacetic acid to produce citric acid.
Isocitric acid produces α-ketoglutaric acid by oxidative
decarboxylation, succinyl CoA transforms to succinic acid by releasing adenosine triphosphate (ATP), and fumaric
acid produces malic acid by hydration. In our research, the levels of α-ketoglutaric acid, succinic acid, malic acid, and citric acid increased in the control-medication groups, but no significant differences were noted in the other groups compared with the control group. However, in
the AP groups, succinic acid decreased signiicantly. As a
result, probably related to a negative chemical equilibrium
shift in TCA that led to the accumulation of intermediate metabolites, the activation of TCA in the AP model rats presumably occurred to a small extent, and rheum was able to signiicantly reduce this activation in normal rats but not in AP rats.
During glycolysis, 2-phosphoglyceric acid produces phosphoenolpyruvate by dehydration. The phosphoric acid from phosphoenolpyruvate is transferred to adenosine
diphosphate (ADP), and pyruvic acid and ATP are
produced. The process ultimately produces lactic acid and
[NAD+] (Murray et al., 2003). In our test, an increase in
the level of phosphoenolpyruvate and lactic acid occurred
in the AP groups compared with the control group. This suggested an acceleration of glycolysis in the AP rats, which was consistent with reports of anoxia and decreased
aerobic respiration ratio caused by pulmonary injury and
Xu, 2008). In the medication groups, phosphoenolpyruvate
was present at the same level as in the control group, although an increase in lactic acid was also observed. This result indicates that rheum might increase the level of glycolysis by decreasing phosphoenolpyruvate and accelerating the process.
Compared with the control group, the level of lipids decreased and the level of β-hydroxybutyric acid increased in the control-medication group. This might have been induced by the acceleration of lipid metabolism, because fatty acids are decomposed to ketones and transferred to
acetyl CoA in the liver (Berg, Tymoczko, Stryer, 2002). In the AP groups, both acetoacetic acid and β-hydroxybutyric
acid increased rapidly, indicating that the hydrolysis of
fatty acids in the AP rats was accelerated. In combination
with the acceleration of glycolysis in the AP rats, aerobic respiration might not have been able to provide suicient energy, and lipid metabolism acted as a supplement. In the medication groups, there was no change in ketone metabolites compared with the control group, which might be attributed to a reverse in the aerobic respiration ratio, indicating that rheum slows energy metabolism.
Moreover, the lactic acid/pyruvic acid (L/P) ratio was directly proportional to the level of tissue anoxia, and the L/P balance was always afected by the [NADH]/ [NAD+] ratio (Shia et al., 2009). The [NADH]/[NAD+]
ratio decreased in the AP groups and increased in the control-medication and AP-medication groups. Based
on the results, the rate of glycolysis was normal, and rheum probably prevented inhibition of the energizing
process, which can produce a higher [NADH]/[NAD+]
ratio through a negative equilibrium shift, along with a deceleration of lipid metabolism.
The levels of valine and histidine only increased
in the AP groups compared with the control group,
which indicated an acceleration of protein catabolism. Considering the decreased ratio of aerobic respiration, we conjectured that the decomposition of proteins provided
energy in the AP groups. Rheum produced an increase
in the ratio of aerobic respiration and prohibited protein
catabolism, as indicated by the absence of a signiicant diference between the control and medication groups.
Increased adenine and pyrimidine in the AP groups
indicated accelerated nucleic acid metabolism. The level of
formic acid also decreased in the AP groups, which proved
that the consumption of formic acid was lifted following the improvement in the synthesis of purine nucleotides. In the medication and control groups, adenine, pyrimidine, and formic acid were present at the same levels, indicating that an equilibrium of nucleic acids occurred, and rheum stabilized nucleic acid metabolism.
Effect on metabolism of digestion and excretion
Creatinine and urea nitrogen levels are standard indicators for the evaluation of renal function. The creatinine content decreased in the control-medication
group, and increased in the AP and AP-medication groups. According to some reports, emodin promotes creatine excretion (Yu et al., 2002), which is in-line with the results
of the control-medication group. This was corroborated
by a report that AP could cause pathological changes in kidneys and induces urinary abnormalities (oliguria, proteinuria, hematuria, or renal failure) with an occurrence rate of 50% (Xie et al., 2003). The increases in the levels of creatinine and urea nitrogen in the AP modeling groups conirmed the phenomenon. Furthermore, there was no signiicant diference in the level of urea nitrogen in the
medication groups compared with the control group, which possibly indicates rheum as a prompt therapy for
renal abnormality in AP model rats.
Bilirubin is one of the main components in the
hepato-enteric circulation. In our test, the purgation
efect of rheum (Yamamoto et al., 2000) possibly led to
a decrease in the level of bilirubin. The level of bilirubin decreased significantly in the control-medication and medication groups, which corroborated the data from
related reports on the purgation efect.
Other metabolites
Compared with the control group, the levels of cholestanone and testosterone increased in the control-medication group. Rheum possibly promotes growth and
development. However, it did not have a signiicant efect in the AP rat models, possibly owing to the abnormality of metabolism. TMAO is the degradation product of choline, and an increase of TMAO always indicates rupture of the cell membrane (Grifin et al., 2001). Therefore, the increase of TMAO in the serum samples from the AP
and medication groups was induced by the digestion of
pancreatic tissue. Hippuric acid and PAG are usually produced by intestinal bacteria (Delaney et al., 2004;
Phipps et al., 1998), and PAG is the end product of
phenylalanine in rodents (James et al., 1972). The increase in the levels of hippuric acid and PAG in the AP groups
indicated intestinal bacteria entering the blood, whereas the remaining hippuric acid in the medication groups indicated inhibition by rheum. The decreased 5-HT level
In general, the metabolism of fat, protein, and nucleic acids was accelerated, and the aerobic respiration
ratio was reduced in the AP rats. During AP, the cell
membrane ruptures, intestinal bacteria enter the blood, and circulatory, respiratory, urinary, and digestive system abnormalities occur. The results were consistent with previous reports that systemic inflammatory
response syndrome (SIRS) and multiple organ failure (MOF) are caused by AP (Schlosser et al., 2002; Isenmann, Rau, Beger, 2001; Buter et al., 2002). When
rheum was administered to the rats, multiple metabolic abnormalities such as the occurrence of amines were not observed, even though several metabolic pathways were impacted. This indicates that rheum might improve energization in organisms. Previous studies have shown
that the therapeutic efect of rheum is associated with three underlying mechanisms: (1) rheum increases the level
of testosterone in an organism, and leads to accelerated
regeneration of erythrocytes (Istvan, 2005); (2) rheum is a traditional Chinese medicine with a therapeutic efect on acute pulmonary injury (Surbatovic et al., 2005), and can therefore improve the eiciency of lung ventilation; and (3) rheum exerts anti-inflammatory and antibiotic efects (Zhou et al., 2006; Wu et al., 2005), both of which
decrease vascular permeability and increase relative
blood volume, thereby improving oxygen supply in the
blood capillaries. Moreover, the elimination of metabolic
products via the purgation efect of rheum is also a critical
mechanism.
CONCLUSION
Analysis of serum samples using 1H NMR and
PLS-DA revealed that 7.5% rheum exerted therapeutic action
on acute pancreatitis rat models, which was consistent
with the pathology evaluation. By proiling endogenous metabolites, we discovered that the therapeutic efects
could be caused by an improvement in energization and the elimination of metabolic products in the organism.
The signiicant diferences in the levels of metabolites
among the test groups also supported the potential use of NMR-based metabonomic analysis for the investigation of traditional Chinese drugs.
ACKNOWLEDGEMENTS
We sincerely thank the staf at the Sichuan University Analytical and Testing Center for carrying out the NMR
spectroscopic analyses.
REFERENCES
AMMANN, R.W.; ADLER, G.; BUCHLER, M.W. Pancreatitis:
advances in pathobiology, diagnosis and treatment.
Germany: Falk Symposium 143, 2004. Sect. 1.
BANKS, P.A.; BOLLEN, T.L.; DERVENIS, C.; GOOSZEN, H.G.; JOHNSON, C.D. Classification of acute pancreatitis-2012: revision of the Atlanta classification and deinitions by international consensus. Gut., v.62, n.1, p.102-111, 2013.
BARRETO, S.G.; RODRIGUES, J. Acute pancreatitis in Goa-a
hospital based study. J. Ind. Med. Assoc., v.106, n.9,
p.575-578, 2008.
BERG, J.M.; TYMOCZKO J.L.; STRYER, L. Biochemistry. 5.
ed. New York: W.H. Freeman and Company, 2002. 894p.
BLOOMER, J.L.; STAGLIANO, K.W.; GAZZILLO, J.A.
Preparation of functionalized juglone acetates and juglone
via 1,4-dimethoxynapthalene derivatives: synthesis of anthraquinones related to Rhein and Aloe emodin. J. Org. Chem., v.58, n.27, p.7906-7912, 1993.
BRAGANZA, J.M. Towards a novel treatment strategy for acute
pancreatitis. Digestion, v.63, n.3, p.69-91, 2001.
BUTER, A.; IMRIE, C.W.; CARTER C.R.; EVANS, S.; MCKAY, C.J. Dynamic nature of early organ dysfunction
determines outcome in acute pancreatitis. Br. J. Surg., v.89,
n.3, p.298-302, 2002.
CHEN, X.; YANG, Y.X.; WANG, S.M.; LIANG, S.W. Study on efects of extract in Naomaitong Formula on cerebral
ischemia-reperfusion model based on NMR metabolomics.
Chin. Trad. Herbal Drugs, v.43, p.97-102, 2012.
C H I N E S E P H A R M A C O P O E I A C O M M I S S I O N .
Pharmacopoeia of the People’s Republic of China. Beijing:
Chemical Industry Press, 2010. v. 1.
CROCKER, J.T. Acute Pancreatitis. Hosp. Med. Clin., v.1, n.2, p.209-222, 2012.
DELANEY, J.; NEVILLE, W.A.; SWAIN, A.; MILES, A.; LEONARD, M.S.; WATERFIELD, C.J. Phenylacetylglycine,
DEMBINSKI, A.; WARZECHA, Z.; CERANOWICZ, P.; WARZECHAA, A.M.; PAWLIKA, W.W. Dual, time-dependent deleterious and protective efect of anandamide
on the course of cerulein-induced acute pancreatitis. Role of sensory nerves. Eur. J. Pharmacol., v.591, n.1-3,
p.284-292, 2008.
GAISANO, H.Y.; GORELICK, F.S. New insights into the
mechanisms of panceatitis. Gastroenterology, v.136, n.7, p.2040-2044, 2009.
GAO, Y.; HE, R.S. Clinical observation on the treatment of acute
pancreatitis by injecting rheum in gastric canal. Shizhen Chin. Med. Drugs, v.18, n.7, p. 1751-1752, 2007.
GE, Q.X.; CHEN, K.; WANG, H. Research procession of
tranditional Chinese drugs on acute pancreatitis. DrugAdm. Assessm. China Hosp., v.8, n.6, p. 474-477, 2008.
GRIFFIN, J.L.; MANN, C.J.; SCOTT, J.; SHOULDERS C.C.; NICHOLSON, J.K. Choline containing metabolites
during cell transfection: an insight into magnetic resonance spectroscopy detectable changes. FEBS Lett., v.509, n.2, p.263-266, 2001.
GU, Y.Z.; WANG, Z.P. Clinical observation on the treatment
of hypopathy acute pancreatitis by Integrated Traditional
Chinese Medicine and Western Medicine (40 examples).
Mod. Clin. Med., v.35, n.6, p.428-429, 2009.
ISENMANN, R.; RAU, B.; BEGER, H.G. Early severe acute
pancreatitis: characteristics of a new subgroup. Pancreas,
v.22, n.3, p.274-278, 2001.
ISTVAN, B. Neuroendocrine regulation of natural immunity.
NeuroImmune Biol., v.5, p.215-262, 2005.
JAMES, M.O.; SMITH, R.L.; WILLIAMS, R.T.; REIDENBERG
M. The conjugation of phenylacetic acid in man,
sub-humanprimates and some non-primate species. Proc. R.
Soc. B. Biol. Sci., v.182, n.1066, p.25-35, 1972.
JIANGSU NEW MEDICAL COLLEGE. Dictionary of chinese
materia medica. Shanghai: Shanghai People s Publishing House,1997.
JI, B.; CHEN, X.Q.; MISEK, D.E.; KUICK, R.; ANASH, S.; MST, S.; NAJARIAN, R. Pancreatic gene expression during
the initiation of acute pancreatitis:identiication of BGR-1
as a key regulator.Physiol. Genomics, v.14, p.59-72, 2003.
KOSTYRNOI, O.V. Changes in acute pancreatitis treatment
program. Klinicheskaia Khirurgiia, v.10, p.26-28, 2012.
LIU, X.B.; JIANG, J.M.; HUANG, Z.W.; TIAN, B.L.; HU, W.M.; XIA, Q.; CHEN, G.Y.; LI, Q.S.; YUAN, C.X.; LUO, C.X.; YAN, L.N.; ZHANG, Z.D. Clinical study on
the treatment of severe acute pancreatitis by Integrated
Traditional Chinese Medicine and Western Medicine. J. Sichuan Univ.(Med. Sci. Ed.)., v.35, n.2, p. 204-208, 2004.
LOMBARDI, B.; ESTES, L.W.; LONGNECKER, D.S. Acute hemorrhagic pancreatitis (massive necrosis) with
fat necrosis induced in mice by DL-ethionine fed with a
choline-deicient diet. Am. J. Pathol., v.79, n.3, p.465-480,
1975.
MANN, J.J.; BRENT, D.A.; ARANGO, V. The neurobiology
and genetics of suicide and attempted suicide: a focus on the serotonergic system. Neuropsychopharmacology, v.24, n.5, p.467-477, 2001.
MURRAY, R.K.; GRANNER, D.K.; MAYES, P.A.; RODWELL, V.W. Harper’s illustrated biochemistry. 26. ed. New York: McGraw Hill, 2003. 693p.
NICHOLSON, J.K.; WILSON, I.D. High resolution proton magnetic resonance spectroscopy of biological luids. Prog. Nucl. Mag. Res. Spect., v.21, n.4-5, p.449-501, 1989.
NORMAN, J.G.; FINK, G.W.; DENHAM, W.; YANG, J.; CARTER, C.; SEXTON, C.; FALKNERR, J.; GOWERR, W.R.; FRANZ, M.G. Tissue-speciic cytokine production during experimental acute pancreatitis. A probable
mechanism for distant organ dysfunction. Digest Dis. Sci.,
v.42, n.8, p.1783-1788, 1997.
PHIPPS, A.N.; STEWART, J.; WRIGHT, B.; WILSON, I.D. Effect of diet on the urinary excretion of hippuric acid and other dietary-derived aromatics in rats. A complex interaction between diet, gut microlora and substrate speciicity. Xenobiotica, v.28, n.5, p.527-537, 1998.
SCHLOSSER, W.; SCHLOSSER, S.; RAMADANI, M.; GANSAUQE, F.; GANSAUGE, S.; BEGER, H.G. Cyclooxygenase-2 is over-expressed in chronic pancreatitis.
Pancreas, v.25, n.1, p.26-30, 2002.
SEWING, K.F.; ALBINUS, M. Efect of gastrin 1 and caerulein
on gastric acid secretion in rats.J. Pham. Pharmacol.,
SHIA, C.S.; JUANG, S.H.; TSAI, S.Y.; CHANG, P.H.; KUO, S.C.; HOU, Y.C.; CHAO, P.D. Metabolism and
pharmacokinetics of anthraquinones in Rheum palmatum
in rats and ex vivo antioxidant activity. Planta Med., v.75,
n.13, p.1386-92, 2009.
SHI, C.; WU, C.Q.; CAO, A.M.; SHENG, H.Z.; YAN, X.Z.; LIAO, M.Y. NMR-spectroscopy-based metabonomic approach to the analysis of Bay41-4109, a novel anti-HBV compound, induced hepatotoxicity in rats. Toxicol. Lett., v.173, n.3, p. 161-167, 2007.
SURBATOVIC, M.; JOVANOVIC, K.; RADAKOVIC, S.;
FILIPOVIC, N. Pathophysiological aspects of severe acute pancreatitis-associated lung injury. Srp. Arh. Celok Lek,
v.133, n.1-2, p.76-81, 2005.
WEI, L.; LIAO, P.; WU, H.; LI, X.; PEI, F.; LI, W.; WU, Y. Toxicological efects of cinnabar in rats by NMR-based
metabolic profiling of urine and serum. Toxicol. Appl.
Pharmacol., v.227, n.3, p.417-429, 2008.
WISHART, D.S.; TZUR, D.; KNOX, C.; EISNER, R.; GUO, A.C.; YOUNG, N.; CHENG, D.; JEWELL, K.; ARNDT, D.; SAWHNEY, S. HMDB: the human metabolome database.
Nucleic Acids Res., v.35, Suppl. 1, p.D521-D526, 2007.
WU, Y.W.; GAO, W.Y.; XIAO, X.H.; LIU, Y. Calorimetric investigation of the effect of hydroxyanthraquinonesin Rheum oficinale Baill on Staphylococcus aureus growth.
Thermochimica Acta, v.429, p.167-170, 2005.
XIAO, P.G. New data of Chinese Materia Medica. Beijing:
Chemical Engineering Publishing House, 2002. v.1, p.66-76.
XIE, H.L.; GONG, D.H.; JI, D.X.; XU, B.; LIU, Y.; LI, L.S.; LI, W.Q.; LI, J.S. Effect of continuous high capacity hemoiltration on C-reaction protein in acute pancreatitis
patients. J. Renal Dis. Dialys. Transplant., v.12, n.1, p.10-14, 2003.
XIE, J.F., XU, P.. Review of pathogenesis on acute pancreatitis
related pulmonary injuries. International digestion journal.
v.28, n.6, p.449-451, 2008.
YAMAMOTO, M.; MIURA, N.; OHTAKE, N.; AMAGAYA, S.; ISHIGE, A.; SASAKI, H.; KOMATSU, Y.; FUKUDA, K.; ITO, T.; TERASAWA, K. Genipin, ametabolite
derived from the herbal medicine Inchin-ko-to, and suppression of Fas-induced lethal liver apoptosis in mice.
Gastroenterology, v.118, n.2, p.380-389, 2000.
YANG, F.; ZHANG, T.; TIAN, G.; CAO, H.F.; LIU, Q.H.; ITO, Y. Preparative isolation and purification of hydroxyanthraquinones from Rheum officinale Baill by
high-speed counter-current chromatography using pH-modulated stepwise elution. J. Chromatogr. A, n.858, n.1,
p.103-107, 1999.
YU, C.X.; XIAO, P.; SU, Z.H.; GAO, Y.L. Review of clinical
application on rheum. Drug Adm. Assessm. China Hosp.,
v.2, n.6, p.359-362, 2002.
ZHANG, W.Q.; GUO, H.Z.; ZHANG, X.Q.; LIU, Q.Y.
Dissolution determination of Shuanghuanglian capsules by HPLC analysis assisted with principal component analysis.
China J. Chin. Mat. Med., v.38, n.7, p.985-989, 2013.
ZHOU, X.; SONG, B.; JIN, L.H.; HU, D.Y.; DIAO, C.L.; XU, G.F.; ZOU, Z.Z.; YANG ANG, S. Isolation and inhibitory activity against ERK phosphorylation of hydroxyanthraquinones from rhubarb. Bioorg. Med. Chem. Lett., v.16, n.3, p.563-568, 2006.
Received for publication on 24th January 2015