Original Article
Artigo Original
Eliana Maria Gradim Fabron1 Simone Fiuza Regaçone1 Viviane Cristina de Castro Marino1 Marina Ludovico Mastria1 Suely Mayumi Motonaga1 Luciana Tavares Sebastião1
Descritores
Voz Distúrbios da Voz Qualidade da Voz Avaliação Autoavaliação
Keywords
Voice Voice Disorders Voice Quality
Evaluation Self-assessment
Correspondence address: Eliana Maria Gradim Fabron
Avenida Higyno Muzzi Filho, 737, Campus Universitário, Marília (SP), Brasil, CEP: 17525-900.
E-mail: [email protected] or [email protected]
Received: 10/01/2014
Accepted: 03/02/2015
Study carried out at School of Philosophy and Sciences ofMarília, Universidade Estadual Paulista “Júlio de Mesquita Filho” – UNESP – Marília (SP), Brazil.
(1) Speech Language Pathology and Audiology Department, School of Philosophy and Sciences, Universidade Estadual Paulista “Júlio de Mesquita Filho” – UNESP – Marília (SP), Brazil.
Financial support: Fundação de Amparo à Pesquisa do Estado de São Paulo – FAPESP; Dean of Extension and Research Fund of the School of Philosophy and Sciences, Universidade Estadual Paulista “Júlio de Mesquita Filho”.
Conlict of interests: nothing to declare.
Self-perception, complaints and vocal quality among
undergraduate students enrolled in a Pedagogy course
Autopercepção, queixas e qualidade vocal
entre discentes de um curso de Pedagogia
ABSTRACT
Purpose: To compare the vocal self-perception and vocal complaints reported by two groups of students of the pedagogy course (freshmen and graduates); to relate the vocal self-perception to the vocal complaints for these groups; and to compare the voice quality of the students from these groups through perceptual auditory assessment and acoustic analysis. Methods: Initially, 89 students from the pedagogy course answered a questionnaire about self-perceived voice quality and vocal complaints. In a second phase, auditory-perceptual evaluation and acoustic analyses of 48 participants were made through voice recordings of sustained vowel emission and poem reading. Results: The most reported vocal complaints were fatigue while using the voice, sore throat, effort to speak, irritation or burning in the throat, hoarseness, tightness in the neck, and variations of voice throughout the day. There was a higher occurrence of complaints from graduates than from freshmen, with signiicant differences for four of the nine complaints. It was also possible to observe the relationship between vocal self-perception and complaints reported by these students. No signiicant differences were observed in the results of auditory-perceptual evaluation; however, some graduates had their voices evaluated with higher severity of deviation of normalcy. During acoustic analysis no difference was observed between groups. Conclusion: The increase in vocal demand by the graduates may have caused the greatest number and diversity of vocal complaints, and several of them are related to the self-assessment of voice quality. The auditory-perceptual evaluation and acoustic analysis showed no deviations in their voice.
RESUMO
INTRODUCTION
The voice is the main and most important instrument of work for a teacher, and therefore it is vital that these profes-sionals have a healthy and pleasant voice. It is not suficient to just master the theoretical contents, because a monotone voice of weak intensity may result in indifference and drowsiness of the listeners. On the other hand, a hoarse, rough, and very strong voice may have an unpleasant impact on the listener, resulting in not only indifference, but dispersion, which may affect the interaction between student and teacher and, consequently, the learning of the undergraduate(1-2).
The teacher should work in favorable environments with favorable situations for the development of educational activi-ties; however, it was observed that the working conditions of this population are precarious; most teachers work for long hours, in crowded classes with a lot of competitive noise, besides other factors unfavorable to communication(3). Many are the factors that determine and interfere in the vocal health, among which, the incorrect or abusive use of the voice, physical and environ-mental factors, psychological and emotional factors, intrinsic factors, and inappropriate vocal habits. The studies involving teachers have the objective of understanding the impact of those factors on the voice of this population to aware them, so that they can use their vocal tract as good as possible and take care of their vocal health(1-3).
National and international analyses involving teachers showed a high rate of symptoms and vocal changes in this pro-fessional category. Within the vocal and laryngeal symptoms most commonly found among teachers, the hoarseness, loss of voice, weak voice, burning sensation or irritation of the throat, feeling of dry/scraping throat, tiredness to speak, lack of air to speak, voice failure, coughing, throat clearing, dificulty in the emission of high pitched sounds, vocal fatigue, dificulties in vocal projection, effort to speak, weak vocal intensity, voice breaking, and dificulties on being heard are the ones that stand out(4-10). An epidemiological study pointed out risk factors for the voice of professionals working as teachers, such as the presence of alteration in the vocal folds in childhood and/or adult life, frequent throat infections, allergies, being a current or former smoker, having hearing problems, developing profes-sional activities that require great vocal demand, in addition to hobbies and leisure activities that require high vocal demand(9).
Particularly, at national level, there are reports indicating that teachers, when compared to other nonteaching profession-als, present approximately twice the risk of having voice dis-orders, establishing, thus, the high occupational risk for this professional class. This risk seems to be higher among female teachers. The symptoms of higher interference in the profes-sional activities of the teachers were the increased effort, dis-comfort, dificulty in projecting the voice, and vocal fatigue(11). Besides this information, the literature also indicates investi-gations addressed to teachers who aim at the vocal improve-ment of this population(12-15). Despite the alcances in studies on the voices of teachers at a national level, the studies directly related to the voice of undergraduate university students are still limited.
College students preparing to become teachers also have vocal complaints(16) and more vocal alterations when compared to other college students(17). Researchers who investigated this population state that these students should have greater knowl-edge on the risk factors that favor vocal alterations(18). They also pinpoint the importance of investigations focused on future teachers who attend the pedagogy course and other degrees, as well as the need for preventive actions on the voice, to pre-vent dysphonia in this population(16,19-23). Also, the literature emphasizes the importance of undergoing, already at under-graduation, a laryngological examination and a voice quality evaluation, focusing on the need of tracing actions on health education for undergraduate students, once those will act out as voice professionals(11,16,22-24).
Studies directed to the survey of vocal self-perception and vocal complaints among undergraduate students enrolled in a pedagogy course, as well as the investigation of voice qual-ity through perceptive and acoustic perception of this popula-tion, are still limited in the literature. Besides, it is interesting to verify whether or not educational activities conducted as a part of professional formation (internships or conducting activi-ties) of undergraduate students enrolled in a pedagogy course may interfere in the voice quality of this population. Studies in this direction may contribute to establish preventive actions and vocal health promotion, as well as contribute to the vocal improvement of this professional category.
The objectives of this research were to compare vocal self-perception and, also, the vocal complaints reported by two groups of undergraduates, both freshmen and seniors; to relate the information obtained on vocal self-perception with those obtained on vocal complaints for both groups; and to compare the vocal quality of these two groups though the auditory-per-ceptive evaluation and the acoustic analysis.
METHOD
The study was approved by the Research Ethics Committee of theSchool of Philosophy and Sciences at Universidade Estadual Paulista (Unesp) in Marília, São Paulo, which was carried out under endorsement No. 0841/2010. All participants signed the informed consent before taking part in the study. All recommendations in Resolution 196/96 of the National Health Council were followed.
This cross-sectional observational research comprised under-graduate students enrolled in a pedagogy course, who were dis-tributed into two groups: Group 1 (G1), exclusively consisting of irst-year undergraduate students who were not taking part in activities involving the professional use of the voice; and Group 2 (G2), consisting of fourth-year undergraduate stu-dents who attended to mandatory internships that demanded constant use of the voice. The population studied was formed exclusively by female undergraduate students, which is justi-ied by the fact that the population of students of pedagogy is primarily formed by female students.
self-perception and vocal complaints of G1 and G2, through the use of a questionnaire. In this stage, 89 undergraduate stu-dents participated, considering 47 of them were enrolled in the irst year of the course, aged between 18 and 62 years and mean age of 21.81 years, with standard deviation (SD) of 7.90 and 42 enrolled in the fourth year of college, aged between 21 and 50 years old and mean age of 25.43 years (SD=7.29). Such instrument of data collection aimed at raising the per-sonal data, information related to the self-perception of voice quality and complaints.
The self-perception of vocal quality was measured by a ive-level Likert scale, graded from the left extremity with the phrase “very good voice” to the right extremity, “very bad voice”. The undergraduate students were oriented to quantify the perception of their voice and take notes on the scale. For the analysis of results, we considered the value 1 for the answer “very good voice”, and “very bad voice” received 5 points.
The vocal complaints were surveyed through closed ques-tions addressing the following complaints: tiredness in the use of voice, sore throat, effort to speak, irritation or burning of the throat, voice loss, throat clearing, hoarseness, foreign body sen-sation in the throat, tension on the neck, and voice variations throughout the day. For each complaint of the questionnaire, the participants signaled their occurrence and frequency: none, sometimes, often, and permanently.
The second stage of the study veriied the vocal quality of the participants in G1 and G2 through the auditory-perceptual evaluation and the acoustic analysis. For that, the voice of the undergraduate students of both groups was recorded to further perform the auditory-perceptive evaluation and the analysis of the acoustic parameters of the vocal quality. Forty-eight under-graduate students took part in this stage; of them, 26 were in the irst year of college and 22 in the fourth year, who previ-ously answered to the questionnaire and who had availability to participate in the activities proposed for the second stage of the study. The recordings were previously scheduled with the students. The voice recordings were conducted in an acousti-cally treated room located in the educational institution where students were enrolled. The Marantz recorder, model PMD660, and the SENNHEISER microphone, model E855, placed in a pedestal at 45º and 3 cm of distance from the subject’s mouth were used. The recording was made with the emission of the sustained vowel “a” in usual frequency and intensity. Then, they performed the reading of the poem “Ou isto ou aquilo” (“Either this or that”) by Cecília Meirelles(25).
For the auditory-perceptual evaluation of the vocal qual-ity, the GRBAS scale was used(26), which consists of a four-point scale (0–3) used to identify the deviation degree of the parameters related to the voice (absent, discrete, moderate, and severe) and each letter identiies a parameter to be analyzed: G (grade), R (roughness), B (breathiness), A (asthenia), and S (strain). In this study, only the G parameter was of interest as it aimed at identifying the presence or absence of alterations in the voices of the students.
The auditory-perceptual evaluation of the G parameter in the GRBAS scale was carried out by three speech language
therapists, experts in the voice ield. For that, a protocol of notes regarding the perception of voice quality was developed. Also, a compact disc (CD) containing all voice recordings of the students when reading the poem was made. The organiza-tion of the recorded voices was randomly selected. Besides, a total of 20% (n=9) voices were randomly repeated in the CD. From these nine repeated recordings, ive belonged to students from the irst year, and four to the last year of the pedagogy course. This procedure was used as a methodological resource aimed at the intra-rater analysis of the vocal quality evaluation. Thus, the inal edition included a total of 57 voices (48 record-ings + 9 repetitions) to be evaluated by the speech language pathologists. The CD containing the recordings of the voices of the students when reading the poem and the protocol were given to the speech language pathologists for further auditory-perceptive evaluation.
The auditory-perceptual evaluation was performed in con-sensus among three speech language pathologists who lis-tened to the voices individually, but at the same time illing out their evaluations. After choosing, the answers were checked. When the opinions were different regarding the vocal quality of the analyzed voice, the judges would listen to the voices again and discuss until deining, together, which would be the adequate scoring.
The acoustic parameters were analyzed from the record-ing of the emission of the sustained vowel “a” usrecord-ing the PRAAT program, which is a program for acoustic analysis and speech synthesis developed by Paul Boersma and David in the Department of Phonetics of the University of Amsterdam. The acoustic measures presented by this program that were consid-ered important for this study were the following: pitch(Hz),
local jitter (%), local shimmer(%),and harmonic-to-noise ratio (HNR)(dB). Considering that PRAAT does not present values of normality, we can use, similarly to those results found by this program, values reported by other softwares(27). In this study, the results obtained by the PRAAT software were anchored by those reported by the Multi-Dimensional Voice Program soft-ware (Kay Elemetrics), which presents the following values: pitchor F0=241.08 Hz; local jitter(%)≤0.633, and local shim-mer (%)≤1.997. As for the HNR, values close to 20 (dB) may be considered, according to what was presented by Dr Speech software (Tigers DRS Inc.).
Data analysis
The data obtained in this study were presented descrip-tively and through an inferential statistical analysis. For the comparison of the results on the vocal self-perception reports presented by G1 and G2, the Student’s t-test was used. For the comparison of the results on vocal complaints presented by both groups, the test of equality of two proportions was used. Thus, the categories of answers “no” and “yes” were considered, so that in the “yes” category we included the answers sometimes, often, and permanently.
test was applied. To compare the G values between the two groups, obtained by the auditory-perceptive evaluation, the equality of two proportions test was used. For the comparison of vocal quality obtained through the received value of the G parameter in the auditory-perceptual evaluation scale and the acoustic analysis, between the two groups, the ANOVA test was used. The Kappa agreement rate was used to verify the intra-rater agreement in the auditory-perceptive evaluation of the voices of the participants. This test was applied using the answers obtained in the consensual judgment of three speech language pathologists, when evaluating the repeated recordings in the CD.
Complaints First year Fourth year p-value n % n %
Fatigue in the use of the voice
No 33 70.2 12 28.6
<0.001*
Yes 14 29.8 30 71.4
Sore throat
No 18 38.3 18 42.9
0.662
Yes 29 61.7 24 57.1
Effort to speak
No 33 70.2 18 42.9
0.009*
Yes 14 29.8 24 57.1
Irritation or burning in the throat
No 18 38.3 8 19.0
0.046*
Yes 29 61.7 34 81.0
Voice loss
No 37 78.7 29 69.0
0.298
Yes 10 21.3 13 31.0
Throat clearing
No 31 66.0 22 52.4
0.193
Yes 16 34.0 20 47.6
Hoarseness
No 19 40.4 16 38.1
0.822
Yes 27 57.4 26 61.9
Sensation of foreign body in the throat
No 33 70.2 28 66.7
0.719
Yes 14 29.8 14 33.3
Neck tension
No 25 53.2 20 47.6
0.600
Yes 22 46.8 22 52.4
Voice variations throughout the day
No 30 63.8 17 40.5
0.028*
Yes 17 36.2 25 59.5
Table 2. Comparison of vocal complaints between freshmen and senior students of the pedagogy course
*Statistical significance (p<0.05); Equality test of two proportions
Table 1. Vocal self-perception of freshmen and senior students of the pedagogy course
*Statistical significance (p<0.05); Student’s t-test
Vocal self-perception First year Fourth year (n=47) (n=42)
Mean 2.77 1.71*
Standard deviation 0.81 0.60
Minimum 1 1
Maximum 5 3
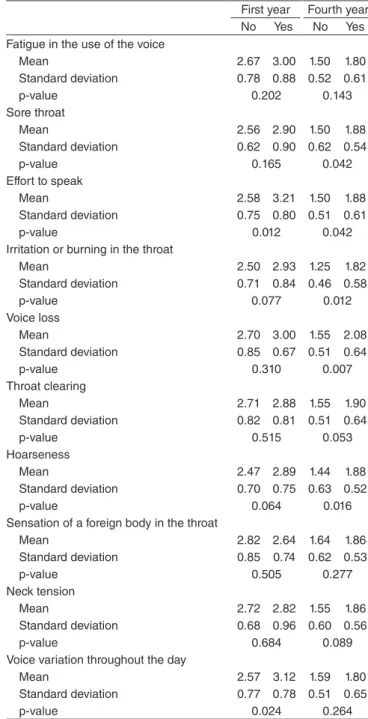
First year Fourth year No Yes No Yes Fatigue in the use of the voice
Mean 2.67 3.00 1.50 1.80
Standard deviation 0.78 0.88 0.52 0.61
p-value 0.202 0.143
Sore throat
Mean 2.56 2.90 1.50 1.88
Standard deviation 0.62 0.90 0.62 0.54
p-value 0.165 0.042
Effort to speak
Mean 2.58 3.21 1.50 1.88
Standard deviation 0.75 0.80 0.51 0.61
p-value 0.012 0.042
Irritation or burning in the throat
Mean 2.50 2.93 1.25 1.82
Standard deviation 0.71 0.84 0.46 0.58
p-value 0.077 0.012
Voice loss
Mean 2.70 3.00 1.55 2.08
Standard deviation 0.85 0.67 0.51 0.64
p-value 0.310 0.007
Throat clearing
Mean 2.71 2.88 1.55 1.90
Standard deviation 0.82 0.81 0.51 0.64
p-value 0.515 0.053
Hoarseness
Mean 2.47 2.89 1.44 1.88
Standard deviation 0.70 0.75 0.63 0.52
p-value 0.064 0.016
Sensation of a foreign body in the throat
Mean 2.82 2.64 1.64 1.86
Standard deviation 0.85 0.74 0.62 0.53
p-value 0.505 0.277
Neck tension
Mean 2.72 2.82 1.55 1.86
Standard deviation 0.68 0.96 0.60 0.56
p-value 0.684 0.089
Voice variation throughout the day
Mean 2.57 3.12 1.59 1.80
Standard deviation 0.77 0.78 0.51 0.65
p-value 0.024 0.264
Table 3. Relation between the mean values of vocal quality self-perception and vocal complaint of freshmen and senior students of a pedagogy course
*Statistical significance (p<0.05); ANOVA test
RESULTS
The answers of the college students regarding the self-per-ception of their voices are described in Table 1.
After illing out the vocal self-perception, the students took notes of their vocal complaints and the data are presented in Table 2. Table 3 presents the relation between self-perception of vocal quality and the presence of vocal complaints reported by the students.
this result that both groups consider their voices to be of very bad quality. When observing the results in Table 1, it is veriied that among the students of the irst year there was one or more students who signaled the worst value for their voice, a fact also shown in the standard deviation of the sample. A study showed that the vocal self-evaluation was reported as bad in only 12% of a population of teachers, considering that most participants evaluated their own voice as good or reasonable(28). Some stud-ies that used vocal self-evaluation protocols along with teach-ers point out the fact that even when having complaints related to the voice, they do not notice an impact on their quality of life(29). Studies suggested a consensus exists between the class of teachers that some symptoms suggesting vocal alterations are part of the profession due to the time of vocal use, work environment conditions, and the daily life stress itself(28,29). The results found in the research once presented suggest that senior students (students who have started their internships in classrooms) start having vocal perception similar to the one of teachers, that is, it is natural to have some vocal variation determined by use demand, as shown by the literature(28,29).
As for vocal complaints, it is observed that the ones more often reported by the participants of both groups were sore throat, irritation or burning of the throat, and hoarseness. Considering the complaints reported by 50% or more of the par-ticipants, it is observed that the students in the irst year report sore throats, irritation or burning of the throat, and hoarseness, whereas the ones in the fourth year indicate irritation or burn-ing of the throat, fatigue in the use of the voice, hoarseness, variations of the voice throughout the day, sore throat, effort to speak, and neck tension. In the comparison of both groups of students, a signiicant difference was observed in the com-plaints of tiredness in the use of the voice, effort to speak, irri-tation or burning of the throat, and voice variations through-out the day. Prevalence studies on vocal complaints among pedagogy students reported more throat clearing, sensation of pain or knot on the neck, tense or tired voice(9), and also, hoarseness(16). The results of this study point out, also, to the increase in the amount and type of vocal complaints indicated by the students of the last year of the course, which suggests that this change may have occurred because these undergradu-ate students have initiundergradu-ated their internship activities in teach-ing. These results agree to those of the study in which higher prevalence of vocal complaints was found between students of the third year of undergraduate teacher, which, according to the authors of the study, coincided with the beginning of the internship activities(16).
It is noteworthy that there is no significant difference between the participant groups in relation to hoarseness com-plaints. Approximately half the students, from both the irst and the fourth year, reported having hoarseness. This inding is in accordance with other studies in which hoarseness seems to be one of the most common complaints between students of pedagogy and other undergraduate courses, future voice profes-sionals(9,19). Hoarseness seems to be a vocal complaint always pointed out by this population, regardless their professional use. When comparing the vocal complaints of these students with the ones of teachers, it is observed that many complaints
Acoustic measuresSchool year Mean
Standard
deviation Minimum Maximum p-value
Pitch (Hz) 1
st 219.6 33.9 103.2 265.1
0.157 4th 205.9 31.7 135.0 272.8
Local jitter (%) 1
st 0.335 0.119 0.187 0.616
0.896 4th 0.340 0.137 0.177 0.691
Local shimmer (%) 1
st 1.82 0.70 0.98 3.54
0.913 4th 1.80 0.51 0.85 2.93
HNR(dB) 1
st 23.51 3.34 16.50 29.49
0.615 4th 23.03 3.13 14.20 27.71
Table 5. Acoustic measures of the voices of students of the first and fourth years of the pedagogy course
ANOVA test (p<0.05)
Caption: HNR = harmonic-to-noise ratio
the students in the irst and fourth years of the course carried out by three speech language pathologists, showing as a basis the mean and median values.
When analyzing more thoroughly the evaluation of the param-eter G of the GRBAS scale, in relation to the severity degree, it was possible to observe that no voice was evaluated with sever-ity degree 3. The voices of the freshmen students were clas-siied as G0 (11; 42.3%), G1 (13; 50%), and G2 (2; 7.7%), and the voices of senior students as G0 (10; 45.5%), G1 (8; 36.4%), and G2 (4; 18.2%). The ANOVA test presented p-values equal to 0.827 in G0, 0.343 in G1, and 0.274 in G2 in the comparison between the groups of students.
There was intra-rater agreement on the consensual opinions obtained for the auditory-perceptive evaluation of the voices of the students (64%; p=0.008), which was classiied as good.
Table 5 presents the mean values of the acoustic measure of the voices of college women who took part in the recordings.
Evaluation Mean MedianStandard
deviationMinimum Maximum p-value
G 1
st year 0.65 1.0 0.63 0.0 2.0
0.717 4th year 0.73 1.0 0.77 0.0 2.0
Table 4. Auditory-perceptual evaluation values (G parameter) of the voice of students in the pedagogy course (first and fourth years) performed by the speech language therapists
ANOVA test
DISCUSSION
most often reported by the students (hoarseness, irritation or burning of the throat, fatigue in the use of the voice, and effort to speak) were also reported by the teachers(4-6,8,30).
The vocal self-perception of students was related to the vocal complaints, considering that among students of the fourth year there was a signiicant relation to the reporting of hoarse-ness, voice loss, irritation or burning of the throat, sore throat, and effort to speak. These complaints were also pointed out by students of courses for future teachers in another study(9). The same relation was signiicant in the complaints of voice variation throughout the day and effort to speak among the stu-dents of the irst year. These data may be confronted with the indings of a previous study(18), once that the interpretation of the indings points toward a relation between vocal complaints of future teachers and the results of self-referred scores in the Vocal Handicap Index scale, suggesting that the worse the score achieved, the higher the relation with vocal complaints.
Considering that the values attributed by speech language therapists to the G parameter in the GRBAS scale, in the audi-tory-perceptive evaluation, it may be observed that the mean of the two groups were close to degree 1, which corresponds to a slight vocal alteration. When comparing the groups as for their distribution of the G values in this scale, no difference was observed between them. However, it is noteworthy that approximately 20% students of the fourth year have the value 2 of the G parameter, which corresponds to moderate voice alter-ation. This result evidenced an increase in the severity of the voice alteration degree, if we consider that these students, the seniors, in little time will enter the work scenario. Other stud-ies also referred that the vocal alterations are frequent among future teachers(16,17).
In relation to the intra-judge concordance for the judging of the voice quality, the results showed a rate considered good during the judging of the voices of the students enrolled in the pedagogy course, indicating coherence between answers.
As for the acoustic analysis, no signiicant difference was observed between the mean and median values of pitch, jitter, shimmer, and HNR among the voices of both participant groups. Besides, the values found for the acoustic measures may be con-sidered within normality patterns, even if obtained by a program different from the one reporting normality values. Also, stud-ies with Brazilian women’s voices, with laryngological exams without alterations and without vocal complaints, using the same program of acoustic analysis presented the values of pitch at 210 Hz (DP=20.17), local jitter at 0.426 (DP=0.148), local shim-mer at 2.964 (DP=2.199), and HNR at 19.332 (DP=3.88)(27).
It is important to note that, although students presented a slight alterations during the auditory-perceptual evaluation con-sidering the mean values, the same did not occur in the analysis of the acoustic parameters.
CONCLUSION
In this study, the undergraduates of the pedagogy course classiied the quality of their voices, ranging from very good to good, discarding, thus, the perception of some kind of vocal
alteration. No signiicant difference was observed between the answers obtained by the freshmen and senior students. As for the vocal complaints, a signiicant difference was found between the undergraduates, with more reports of fatigue in the use of the voice, effort to speak, irritation or burning of the throat, and voice variations throughout the day by the senior undergraduates.
A positive correlation was found between the self-percep-tion of voice quality and hoarseness, loss of voice, irritaself-percep-tion or burning of the throat, throat clearing, and effort among the senior undergraduates who presented higher number of vocal complaints. Positive correlation between vocal self-perception and vocal complaints was only found, for freshmen under-graduates, when complaints were presented on voice variation throughout the day and effort to speak.
In the auditory-perceptual evaluation, low or null severity degree was observed for most of the voices judged and no dif-ference was observed between the evaluations of freshmen and seniors. The parameters of acoustic analysis do not show dif-ference in voices of students of both groups, remaining within the normality limits.
In general, the results of the study show that the stages ini-tially developed by undergraduate students of the pedagogy course may result in the increase of vocal demand, which is relected by the vocal complaints presented by this population and, thus, deserve attention.
*EMGF participated in the elaboration of the project, coordinated the research, participated in the execution of the project, the analysis and interpretation of the data, and also in the preparation and review of the manuscript; SFR took part in the execution of the project, collected and prepared the data, participated in the analysis of the data, and also in the preparation of the manuscript; VCCM participated in the execution of the project, analysis and interpretation of the data, and also in the preparation and review of the manuscript; MLM participated in the execution of the project, collected and prepared the data, participated in the data analysis, and also in the preparation of the manuscript; SMMO participated in the elaboration and execution of the project; LTS participated in the elaboration and in the execution of the project, and also in the review of the manuscript.
REFERENCES
1. Fabron EMG. A voz como recurso didático: reconhecimento e julgamento de suas qualidades [tese]. Marília: Universidade Estadual Paulista; 2005. 2. Behlau M, Dragone MLS, Nagano L. A voz que ensina: o professor e a
comunicação oral em sala de aula. São Paulo: Revinter; 2004. 3. Ferreira LP, Gianini SPP, Figueira S, Silva EE, Karmann DF, Souza TMT.
Condições de produção vocal de professores da prefeitura do município de São Paulo. Distúrb Comun. 2003;14(2):275-308.
4. Fabron EMG, Omote S. Queixas vocais entre professors e outros proissionais In: Ferreira LP, Costa HO. Voz ativa: falando sobre o proissional da voz. São Paulo: Roca Ltda; 2000. p. 91-102.
5. Roy N, Merrill RM, Thibeault S, Parsa RA, Gray SD, Smith EM. Prevalence of voice disorders in teachers and the general population. J Speech Lang Hear Res. 2004;47(2):281-93.
6. Tavares EL, Martins RH. Vocal evaluation in teachers with or without symptoms. J Voice. 2007;21(4):407-14.
8. Chen SH, Chiang SC, Chung YM, Hsiao LC, Hsiao TY. Risk factors and effects of voice problems for teachers. J Voice. 2010;24(2):183-90. 9. Ohlsson AC, Andersson EM, Södersten M, Simberg S, Barregard L.
Prevalence of voice symptoms and risk factors in teacher students. J Voice. 2012;26(5):629-34.
10. Lima-Silva MFB, Ferreira, LP, Oliveira IB, Silva MAA, Ghirardi ACAM. Distúrbio de voz em professores: autorreferência, avaliação perceptiva da voz e das pregas vocais. Rev Soc Bras Fonoaudiol. 2012;17(4):391-7. 11. Behlau M, Zambon F, Guerrieri AC, Roy N. Epidemiology of voice
disorders in teachers and nonteachers in Brazil: prevalence and adverse effects. J Voice. 2012;26(5):665.e-9-18.
12. Fabron EMG, Sebastião LT, Omote S. Prevenção de distúrbios vocais em professores e crianças: uma proposta de intervenção junto a instituições educacionais. In: Ferreira LP, Costa HO. Voz ativa: falando sobre o proissional da voz. São Paulo: Roca; 2000. p. 67-78.
13. Bovo R, Galceran M, Petruccelli J, Hatzopoulos S. Vocal problems among teachers: evaluation of a preventive voice program. J Voice. 2007;21(6):705-22.
14. Dragone MLOS. Programa de saúde vocal para educadores: ações e resultados. Rev CEFAC. 2011;13(6):1133-43.
15. Fabron EMG, Sebastião LT. Saúde vocal do professor: ações diagnósticas e educativas desenvolvidas no contexto de um projeto de extensão universitária. In: Marcolino F, Zaboroski AP, Oliveira JP. Perspectivas atuais em Fonoaudiologia: reletindo sobre ações na comunidade. São José dos Campos: Pulso editorial; 2010. p. 147-65.
16. Simberg S, Laine A, Sala E, Rönnemaa, AM. Prevalence of voice disorders among future teachers. J Voice. 2000;14(2):231-5.
17. Simberg S, Sala E, Rönnemaa AM. A comparison of the prevalence of vocal symptoms among teacher students and other university students. J Voice. 2004;18(3):363-8.
18. Thomas G, Kooijman PG, Donders AR, Cremers WR, de Jong FI. The voice handicap of student-teachers and risk factors perceived to have a negative inluence on the voice. J Voice. 2007;21(3):325-36.
19. Palheta Neto FX, Freire JVC, Damasceno LAA, Ferreira RO, Fernandes VHA, Palheta ACP. Incidência de rouquidão em alunos do último ano dos cursos de licenciatura. Int Arch Otorhinolaryngol. 2008;12(2):246-52. 20. Van Lierde KM, Claeys S, Dhaeseleer E, Delay S, Derde K, Herregods
I, et al. The vocal quality in female student teachers during the 3 years of study. J Voice. 2010;24(5):599-605.
21. Van Houtte E, Claeys S, Wuyts F, Van Lierde K. The impact of voice disorders among teachers: vocal complaints, treatment-seeking behavior, knowledge of vocal care, and voice-related absenteeism. J Voice. 2011;25(5):570-5. 22. Timmermans B, Coveliers Y, Meeus W, Vandenabeele F, Van Looy
L, Wuyts F. The effect of a short voice training program in future teachers. J Voice. 2011;25(4):e191-8.
23. Schneider B, Bigenzahn W. Vocal risk factors for occupational voice disorders in female teaching students. Eur Arch Otorhinolaryngol. 2005;262(4):272-6. 24. Meulenbroek LFP, de Jong FI. Voice quality in relation to voice
complaints and vocal fold condition during the screening of female student teachers. J Voice. 2011;25(4):462-6.
25. Meireles C. Ou isto ou aquilo. 6a ed. Rio de Janeiro: Nova Fronteira; 2002 26. Hirano M. Clinical examination of voice. New York: Springer Verlag; 1981. 27. Finger LS, Cielo CA, Schwarz K. Medidas vocais acústicas de mulheres
sem queixas de voz e com laringe normal. Braz J Otorhinolaryngol. 2009;75(3):432-40.
28. Morais EPG, Azevedo RR, Chiari BM. Correlação entre voz, autoavaliação vocal e qualidade de vida em voz de professoras. Rev CEFAC. 2012;14(5):892-900.
29. Ricarte A, Bommarito S, Chiari B. Impacto vocal de professores Rev CEFAC. 2011;13(4):719-27.