Pesq. agropec. bras., Brasília, v.50, n.8, p.649-657, ago. 2015 DOI: 10.1590/S0100-204X2015000800003
Regina Maria Villas Bôas de Campos Leite(1) and Maria Cristina Neves de Oliveira(1)
(1)Embrapa Soja, Rodovia Carlos João Strass, Acesso Orlando Amaral, s/no, Caixa Postal 231, CEP 86001‑970 Londrina, PR, Brazil, E‑mail: regina.leite@embrapa.br, mcristina.oliveira@embrapa.br
Abstract ‒ The objective of this work was to evaluate the suitability of the multivariate method of principal component analysis (PCA) using the GGE biplot software for grouping sunflower genotypes for their reaction to Alternaria leaf spot disease (Alternariasterhelianthi), and for their yield and oil content. Sixty‑nine genotypes
were evaluated for disease severity in the field, at the R3 growth stage, in seven growing seasons, in Londrina, in the state of Paraná, Brazil, using a diagrammatic scale developed for this disease. Yield and oil content were also evaluated. Data were standardized using the software Statistica, and GGE biplot was used for PCA and graphical display of data. The first two principal components explained 77.9% of the total variation. According to the polygonal biplot using the first two principal components and three response variables, the genotypes were divided into seven sectors. Genotypes located on sectors 1 and 2 showed high yield and high oil content, respectively, and those located on sector 7 showed tolerance to the disease and high yield, despite the high disease severity. The principal component analysis using GGE biplot is an efficient method for grouping sunflower genotypes based on the studied variables.
Index terms: Alternariasterhelianthi, Helianthusannuus, disease resistance, principal component analysis.
Agrupamento de genótipos de girassol quanto à produtividade, ao teor de óleo
e à reação à mancha de alternária por GGE biplot
Resumo – O objetivo deste trabalho foi avaliar a adequação do uso do método multivariado de análise de componentes principais (ACP), com uso do programa GGE biplot, para o agrupamento de genótipos de girassol quanto à sua reação à mancha de alternária (Alternariaster helianthi), e quanto à produtividade e
ao teor de óleo. Sessenta e nove genótipos foram avaliados quanto à severidade da doença em campo, na fase de desenvolvimento R3, em sete safras, em Londrina, PR, com uso de uma escala diagramática própria, desenvolvida para esta doença. A produtividade e o teor de óleo também foram avaliados. Os dados foram padronizados com o programa Statistica, e o GGE biplot foi utilizado para ACP e exibição gráfica dos dados. Os dois primeiros componentes principais explicaram 77,9% da variação total. De acordo com o biplot poligonal, obtido com os dois primeiros componentes principais e as três variáveis resposta, os genótipos foram divididos em sete setores. Os genótipos alocados nos setores 1 e 2 apresentaram alta produtividade e alto teor de óleo, respectivamente, e os agrupados no setor 7 apresentaram tolerância à doença e alta produtividade, apesar de elevada severidade da doença. O método de análise de componentes principais com uso do GGE biplot é eficiente para agrupar genótipos de girassol com base nas variáveis estudadas.
Termos para indexação: Alternariaster helianthi, Helianthus annuus, resistência a doenças, análise de
componentes principais.
Introduction
Sunflower (Helianthus annuus L.) cropped area is increasing in Brazil, with 144 thousand hectares in the last growing season (Companhia Nacional de Abastecimento, 2014). However, there is an enormous potential for expansion, since sunflower is planted as a second summer crop in succession to soybean, which occupies an area of around 30 million hectares
in Brazil (Companhia Nacional de Abastecimento, 2014). The potential for area expansion is also driven by a crescent demand for special oils for human consumption, as high oleic oil, and by the Brazilian government demand for biofuel.
prevalent on the crop, occurring in virtually all regions of the country and on all sowing dates. Damage caused by the disease can be due to the reduction of plant photosynthetic area, formation of leaf spots, and early defoliation, which results in the reduction of achene diameter, number of achenes per head, 1000‑seed weight, and oil content (Leite et al., 2006; Alves et al., 2013).
An efficient disease control is very difficult when epidemic is already occurring in the field. Among the strategies for managing the disease, genetic resistance is highly desirable because it does not add costs to farmers, and sometimes it can remove the need for other control methods (Leite et al., 2006). Although regional crop variety trials for an important crop are conducted every year, the tested genotypes vary from year to year, leading to high unbalanced data across the years. Strategies have been developed to deal with this data (Yan, 2014). It is interesting to compare the results obtained in different crop seasons, considering that these trials have a common standard genotype (Dow M734), evaluated in all years.
As the results of different genotypes are obtained in different years, it is not possible to perform the analysis of variance combined with only one common genotype. In this case, the most appropriate method to group sunflower genotypes, as a function of the evaluated variables, is the multivariate method of principal component analysis (PCA), which allows the sorting or grouping without losing information. In addition, it linearly transforms a large number of variables into a noncorrelated smaller set of them (Silva & Padovani, 2006). Comparing to the univariate method, using a massive array of data, it can interpret a research with few components using the information of all variables (Rao, 1964).
Using PCA to summarize a large number of variables in ecological studies, Prado et al. (2002) measured the importance of each of these variables on each axis or component by its weight, which is correlated with the axis. Such components are measured in linear functions that allow knowing the size and shape of the data variation.
Principal component analysis proposed by Yan & Rajcan (2002), using the software GGE biplot, enables a singular value decomposition (SVD) of the first two principal components, which means that a matrix is decomposed in three parts: singular values,
eigenvectors of columns, and eigenvectors of rows, forming a diagonal matrix. Biplot analysis was first developed by Gabriel (1971), and it can interpret multiple variables in function of different treatments in the same graphic (Akinwale et al., 2014). GGE biplot has been used to show the performance of sunflower hybrids in different testing environments or sowing dates (Ullah et al., 2007; Balalic et al., 2012; Brankovic et al., 2012). A GGE biplot is used to analyze multi‑year data of variety trials, where genotypes vary from year to year, treating each year‑location as an environment (Yan, 2014).
The objective of this work was to evaluate the suitability of the multivariate method of principal component analysis, using the software GGE biplot, for grouping sunflower genotypes for their reaction to Alternaria leaf spot disease (Alternariasterhelianthi), and for their yield and oil content.
Materials and Methods
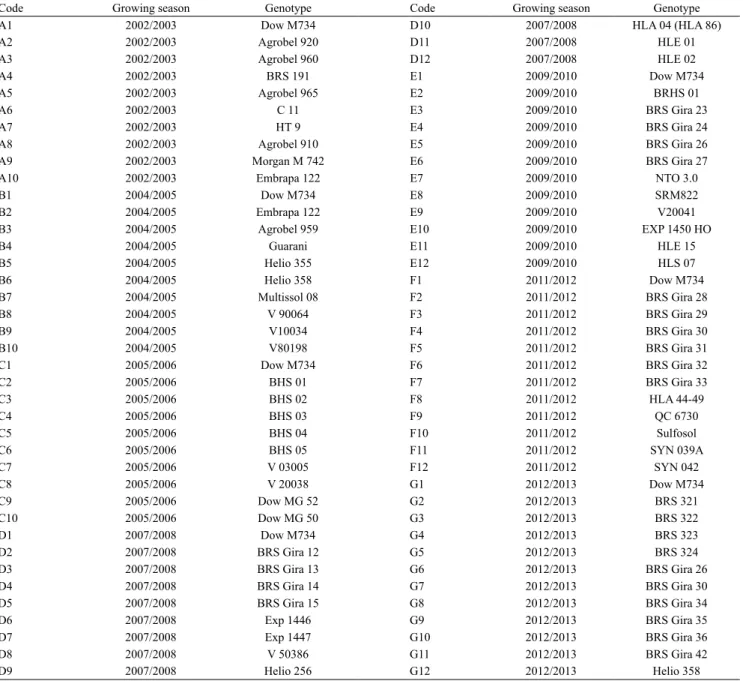
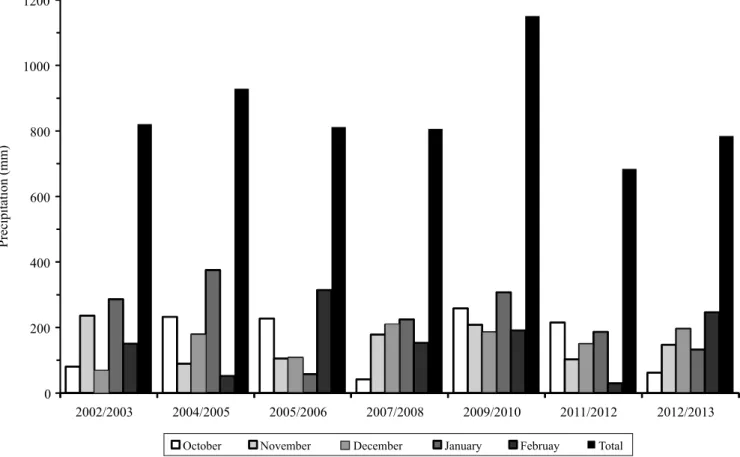
For the present experiment, sixty‑nine sunflower genotypes were evaluated for their reaction to Alternaria leaf spot under field conditions, in the experimental area of Embrapa Soja, Londrina, PR, Brazil (23°11'37"S, 51°11'03"W, 630 m altitude), in 2002/2003, 2004/2005, 2005/2006, 2007/2008, 2009/2010, 2011/2012 and 2012/2013 growing seasons. In the first three growing seasons, 10 sunflower genotypes were studied, and in the last four growing seasons, 12 genotypes were evaluated (Table 1). The experiment was carried out in a randomized block design, with 10:12 genotypes and four replicates. A common genotype, the sunflower hybrid named Dow M734, was included in all trials. Some genotypes were evaluated twice: the sunflower open‑pollinated variety Embrapa 122, in 2002/2003 and 2004/2005, the hybrid Helio 358 in 2004/2005 and 2012/2013, and BRS Gira 30 in 2011/2012 and 2012/2013 growing seasons. Accumulated precipitation for each season is presented in Figure1.
Pesq. agropec. bras., Brasília, v.50, n.8, p.649‑657, ago. 2015 DOI: 10.1590/S0100‑204X2015000800003
since the disease occurred by natural infection of plants by the fungus. The pathogen was identified through laboratory isolation and inoculation on plants in a greenhouse.
Assessments of disease severity (%) were performed in two central rows of each plot, discarding 0.5 m from each line end. The individual plant system was adopted (Kranz & Jörg, 1989), by which five homogeneous plants in each plot were marked.
Plants were chosen during V4 stage (Schneiter & Miller, 1981), and an attempt was made to select individuals of the same development stage, height and vigor. Total leaf area was estimated on marked plants (Leite & Amorim, 2002) at the developmental stage R3 (Schneiter & Miller, 1981). Alternaria disease severity (%) was estimated on all leaves using diagrammatic scale of the disease, previously developed and validated (Leite & Amorim, 2002)
Table 1. Sunflower genotypes evaluated for grain yield, oil content, and reaction to Alternaria leaf spot in seven growing
seasons.
Code Growing season Genotype Code Growing season Genotype
A1 2002/2003 Dow M734 D10 2007/2008 HLA 04 (HLA 86)
A2 2002/2003 Agrobel 920 D11 2007/2008 HLE 01
A3 2002/2003 Agrobel 960 D12 2007/2008 HLE 02
A4 2002/2003 BRS 191 E1 2009/2010 Dow M734
A5 2002/2003 Agrobel 965 E2 2009/2010 BRHS 01
A6 2002/2003 C 11 E3 2009/2010 BRS Gira 23
A7 2002/2003 HT 9 E4 2009/2010 BRS Gira 24
A8 2002/2003 Agrobel 910 E5 2009/2010 BRS Gira 26
A9 2002/2003 Morgan M 742 E6 2009/2010 BRS Gira 27
A10 2002/2003 Embrapa 122 E7 2009/2010 NTO 3.0
B1 2004/2005 Dow M734 E8 2009/2010 SRM822
B2 2004/2005 Embrapa 122 E9 2009/2010 V20041
B3 2004/2005 Agrobel 959 E10 2009/2010 EXP 1450 HO
B4 2004/2005 Guarani E11 2009/2010 HLE 15
B5 2004/2005 Helio 355 E12 2009/2010 HLS 07
B6 2004/2005 Helio 358 F1 2011/2012 Dow M734
B7 2004/2005 Multissol 08 F2 2011/2012 BRS Gira 28
B8 2004/2005 V 90064 F3 2011/2012 BRS Gira 29
B9 2004/2005 V10034 F4 2011/2012 BRS Gira 30
B10 2004/2005 V80198 F5 2011/2012 BRS Gira 31
C1 2005/2006 Dow M734 F6 2011/2012 BRS Gira 32
C2 2005/2006 BHS 01 F7 2011/2012 BRS Gira 33
C3 2005/2006 BHS 02 F8 2011/2012 HLA 44‑49
C4 2005/2006 BHS 03 F9 2011/2012 QC 6730
C5 2005/2006 BHS 04 F10 2011/2012 Sulfosol
C6 2005/2006 BHS 05 F11 2011/2012 SYN 039A
C7 2005/2006 V 03005 F12 2011/2012 SYN 042
C8 2005/2006 V 20038 G1 2012/2013 Dow M734
C9 2005/2006 Dow MG 52 G2 2012/2013 BRS 321
C10 2005/2006 Dow MG 50 G3 2012/2013 BRS 322
D1 2007/2008 Dow M734 G4 2012/2013 BRS 323
D2 2007/2008 BRS Gira 12 G5 2012/2013 BRS 324
D3 2007/2008 BRS Gira 13 G6 2012/2013 BRS Gira 26
D4 2007/2008 BRS Gira 14 G7 2012/2013 BRS Gira 30
D5 2007/2008 BRS Gira 15 G8 2012/2013 BRS Gira 34
D6 2007/2008 Exp 1446 G9 2012/2013 BRS Gira 35
D7 2007/2008 Exp 1447 G10 2012/2013 BRS Gira 36
D8 2007/2008 V 50386 G11 2012/2013 BRS Gira 42
simultaneously at R3 growth stage, as recommended by Leite et al. (2006).
Plants were harvested individually, after physiological maturity stage (R9) (Schneiter & Miller, 1981), and yield (kg ha‑1) was evaluated at 11% humidity. Oil content (%) was predicted by NIR spectroscopy (Grunvald et al., 2014).
Precipitation was measured during the seven growing seasons (Figure 1), since water deficiency could affect sunflower production and disease development. As data were obtained in different years, original data of the variables were standardized within each growing season, in order to minimize the effect of the environment, and to reduce experimental variability. This procedure was performed using the software Statistica (Statsoft, 1995), after the normalization of the variables – yield (kg ha‑1), Alternaria disease severity (%), and oil content (%) – to the same scale as a normal distribution with mean zero and standard deviation one [(N @ (0,1)], ensuring that they are dimensionless. Pearson correlation coefficients for original data were assessed by t test, at 5% probability.
Principal component analysis and biplot graphics were performed by data matrix of sunflower genotypes and by singular value decomposition (SVD) focusing on the treatments (interaction between genotype and year). Eigenvalues and eigenvectors of PCA were calculated for yield, Alternaria leaf spot severity, and oil content, using GGE biplot (Yan & Kang, 2003; Yan et al., 2015).
Afterwards, the resulting first two principal components (PC1 and PC2) were taken to perform the biplot analysis and graphical display of data, using the GGE biplot software. Biplot was calculated by PC1 scores on the abscissa, and PC2 scores on the ordinate for each treatment and each variable (Yan & Rajcan, 2002), and can be expressed as:
T
ijk -Tjk sjk= 1 ik1 jk1+ 2 ik2 jk2+ ijk
λ φ τ λ φ τ ε
in which: Tijk is the average value of the combination of genotype and year ik, for trait j; Tjk is the average
value of the combination of trait and year jk over all genotypes; sjk is the standard deviation of the interaction
Pesq. agropec. bras., Brasília, v.50, n.8, p.649‑657, ago. 2015 DOI: 10.1590/S0100‑204X2015000800003
between trait j and year k, among the genotype averages; ϕik 1 and ϕik 2 are the PC1 and PC2 scores, respectively, for genotype i; τjk 1 and τjk 2 are the PC1 and PC2 scores, respectively, for trait j; and εijk is the residual of the model associated with the interaction of genotype and year ik in trait j.
Results and Discussion
Pearson correlation coefficients between disease severity and yield was not significant, and it was negatively correlated (r = ‑0.21). Results of principal component analysis are more efficient when original data of the studied variables are correlated. Correlation between disease severity and oil content was negative and significant (r = ‑0.32), and between yield and oil content it was significant and positive (r = 0.28). This indicates that PCA is an option to reasonably quantify the amount of observed variables, in the complex variation structure within and among them (Silva & Padovani, 2006).
The obtained eigenvalues for the three components were, respectively, 1.5423, 0.7949 and 0.6626, totalizing 100% of the total variance (Table 2). Based on these eigenvalues, the results of PCA indicated that the first component accounted for 51.4% and the second one for 26.5% of the total variance among variables.
As to principal component analysis, the number of principal components is always equal to the considered number of variables in the research; however, the number of components or selected axes is not always equal to the maximum number of variables. Usually, the first two components explain the importance of a larger number of variables in the total variation, and the first component is the most important because it has the greatest contribution to the data variation (Silva & Padovani, 2006). In the present research, the first two principal components or two axes explained 77.9% of the total variation. Therefore the first component, by which disease severity and oil content showed the
highest contribution, was the most important (Table 2). The second component represents the contribution of disease severity and yield to compare sunflower genotypes. Akinwale et al. (2014) state that no studies have been carried out to specify when the proportion of variation explained by a biplot becomes too small to make a valid conclusion; however, it is generally assumed that any proportion below 40% is too small. This shows the importance of PC1, as reported by Ullah et al. (2007), regarding that ideal sunflower cultivars should have a large PC1 score and a small (absolute) PC2 score.
Yan & Tinker (2006) developed studies on genotype x environment interaction, using GGE biplot, in order to verify the selection of the best genetic material that shows stability in different environments. One of the most attractive features of a GGE biplot is its ability to show the which‑won‑where pattern of a genotype by environment dataset. Many researchers find this use of a biplot intriguing, as it graphically addresses important concepts such as genotype x environment interaction, mega environment differentiation, specific adaptation, etc. In fact, GGE biplot graphic facilitates the visual evaluation of both genotype and genotype x environment interaction, showing different sunflower genotype groups based on their performance (Ullah et al., 2007).
Based on the two principal components with the three investigated variables, the polygon was formed by connecting the markers of the genotypes that were further away from the biplot origin, such that all other genotypes were contained in the polygon. Genotypes located on the vertices of the polygon performed either the best or the poorest in one or more locations, since they had the longest distance from the origin of biplot. The perpendicular lines are equality lines between adjacent genotypes on the polygon, which facilitate visual comparison of them. The equality lines divide the biplot into sectors, and the winning genotype for
Table 2. Eigenvalues and eigenvectors of principal component analysis (PCA) for Alternaria leaf spot severity (%), grain
yield (kg ha‑1), and oil content (%) of 69 sunflower genotypes.
Component Eigenvalue Total
each sector is the one located on the respective vertex (Yan & Tinker, 2006; Farshadfar et al., 2011).
In the biplot using the first two principal components, the variables disease severity, yield, and oil content were located on three different sectors (Figure 2), within the third and fourth concentric circles (Figure 3). The concentric circles on the biplot help to visualize the vector length (the distance from a marker to the biplot origin) (Yan et al., 2015), and also show the discriminating abilities of the variables (Jalata, 2011). Treatments with longer vectors indicate higher contributions and also higher variances. Genotypes located on the vertices close to the variables were observed as the most responsive ones (Table 3). Opposite effects were observed when genetic materials were placed on vertices located on the opposite side of the studied variables.
According to the polygonal biplot using the first two principal components, considering the variables disease severity, yield and oil content, the evaluated genotypes were divided in seven sectors (Figure 2). The first sector contained the yield vector. The genotype Dow MG52 (C9) was located on the vertex of the sector, showing 1,435 kg ha‑1 yield and 50.55% oil
content. Genotypes located closer to the origin of the biplot showed low contribution, such as 'BRS Gira 32' (F6) (Table 3). The second sector contained oil content vector, and few genotypes were located on this position, which represents high oil content (Figure 2). On the vertex of the polygon, there was the V20041 (E9), with 44.97% of oil content. The third sector represented low Alternaria leaf spot severity because it was located on the opposite side of the fifth sector, where the disease severity vector was located (Figure 2). Sunflower genotype Helio 358 (B6) was located on the vertex of the polygon (disease severity of 3.29%).
Yan & Tinker (2006) stated that the length of the genotype vector, which is the distance between a genotype and the biplot origin, measures the difference of the genotype from the “average” genotype. Therefore, genotypes or any treatment or variables with the longest vectors are either the best or the poorest genotypes. Despite being located on the vertex of the polygon, they are not always the best answer. If they are located on the left side of the biplot, these genotypes show the worst values, and care should be taken to not have an erroneous interpretation. This fact
Figure 2. Polygon view of the GGE biplot based on 69
sunflower genotypes evaluated for grain yield, oil content, and reaction to Alternaria leaf spot disease, in seven growing seasons. Codes and details for the genotypes are listed in Table 1.
Figure 3. Vectors of the GGE biplot, based on 69 sunflower
Pesq. agropec. bras., Brasília, v.50, n.8, p.649‑657, ago. 2015 DOI: 10.1590/S0100‑204X2015000800003
was observed in the fourth sector (Figure 2), where the open‑pollinated variety Embrapa 122 (B2) was located on the vertex of the polygon, showing a long vector (Figure 3), but its values of yield (715 kg ha‑1) and oil content (33.17%) were very low. Moreover,
'BRS Gira 31' (F5) was located on the vertex of the fifth sector, which represents low oil content.
The sixth sector represented high Alternaria leaf spot severity and HLA 04 (D10) was located on the sector vertex. Other genotypes located on this sector
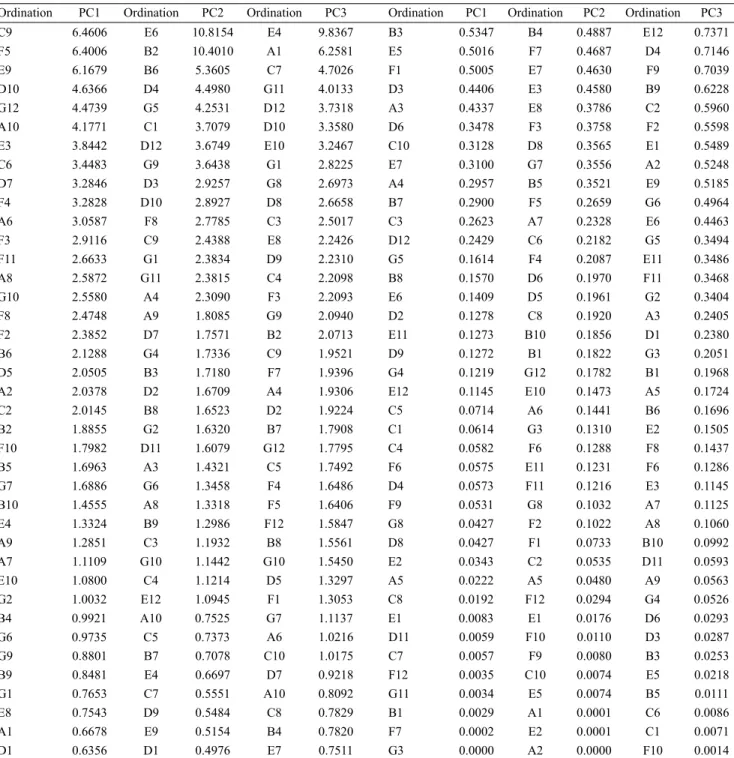
Table 3. Contribution of grain yield (kg ha‑1), Alternaria leaf spot severity (%), and oil content (%) of 69 sunflower genotypes
according with principal components PC1, PC2, and PC3 in descending ordination(1).
Ordination PC1 Ordination PC2 Ordination PC3 Ordination PC1 Ordination PC2 Ordination PC3
C9 6.4606 E6 10.8154 E4 9.8367 B3 0.5347 B4 0.4887 E12 0.7371
F5 6.4006 B2 10.4010 A1 6.2581 E5 0.5016 F7 0.4687 D4 0.7146
E9 6.1679 B6 5.3605 C7 4.7026 F1 0.5005 E7 0.4630 F9 0.7039
D10 4.6366 D4 4.4980 G11 4.0133 D3 0.4406 E3 0.4580 B9 0.6228
G12 4.4739 G5 4.2531 D12 3.7318 A3 0.4337 E8 0.3786 C2 0.5960
A10 4.1771 C1 3.7079 D10 3.3580 D6 0.3478 F3 0.3758 F2 0.5598
E3 3.8442 D12 3.6749 E10 3.2467 C10 0.3128 D8 0.3565 E1 0.5489
C6 3.4483 G9 3.6438 G1 2.8225 E7 0.3100 G7 0.3556 A2 0.5248
D7 3.2846 D3 2.9257 G8 2.6973 A4 0.2957 B5 0.3521 E9 0.5185
F4 3.2828 D10 2.8927 D8 2.6658 B7 0.2900 F5 0.2659 G6 0.4964
A6 3.0587 F8 2.7785 C3 2.5017 C3 0.2623 A7 0.2328 E6 0.4463
F3 2.9116 C9 2.4388 E8 2.2426 D12 0.2429 C6 0.2182 G5 0.3494
F11 2.6633 G1 2.3834 D9 2.2310 G5 0.1614 F4 0.2087 E11 0.3486
A8 2.5872 G11 2.3815 C4 2.2098 B8 0.1570 D6 0.1970 F11 0.3468
G10 2.5580 A4 2.3090 F3 2.2093 E6 0.1409 D5 0.1961 G2 0.3404
F8 2.4748 A9 1.8085 G9 2.0940 D2 0.1278 C8 0.1920 A3 0.2405
F2 2.3852 D7 1.7571 B2 2.0713 E11 0.1273 B10 0.1856 D1 0.2380
B6 2.1288 G4 1.7336 C9 1.9521 D9 0.1272 B1 0.1822 G3 0.2051
D5 2.0505 B3 1.7180 F7 1.9396 G4 0.1219 G12 0.1782 B1 0.1968
A2 2.0378 D2 1.6709 A4 1.9306 E12 0.1145 E10 0.1473 A5 0.1724
C2 2.0145 B8 1.6523 D2 1.9224 C5 0.0714 A6 0.1441 B6 0.1696
B2 1.8855 G2 1.6320 B7 1.7908 C1 0.0614 G3 0.1310 E2 0.1505
F10 1.7982 D11 1.6079 G12 1.7795 C4 0.0582 F6 0.1288 F8 0.1437
B5 1.6963 A3 1.4321 C5 1.7492 F6 0.0575 E11 0.1231 F6 0.1286
G7 1.6886 G6 1.3458 F4 1.6486 D4 0.0573 F11 0.1216 E3 0.1145
B10 1.4555 A8 1.3318 F5 1.6406 F9 0.0531 G8 0.1032 A7 0.1125
E4 1.3324 B9 1.2986 F12 1.5847 G8 0.0427 F2 0.1022 A8 0.1060
A9 1.2851 C3 1.1932 B8 1.5561 D8 0.0427 F1 0.0733 B10 0.0992
A7 1.1109 G10 1.1442 G10 1.5450 E2 0.0343 C2 0.0535 D11 0.0593
E10 1.0800 C4 1.1214 D5 1.3297 A5 0.0222 A5 0.0480 A9 0.0563
G2 1.0032 E12 1.0945 F1 1.3053 C8 0.0192 F12 0.0294 G4 0.0526
B4 0.9921 A10 0.7525 G7 1.1137 E1 0.0083 E1 0.0176 D6 0.0293
G6 0.9735 C5 0.7373 A6 1.0216 D11 0.0059 F10 0.0110 D3 0.0287
G9 0.8801 B7 0.7078 C10 1.0175 C7 0.0057 F9 0.0080 B3 0.0253
B9 0.8481 E4 0.6697 D7 0.9218 F12 0.0035 C10 0.0074 E5 0.0218
G1 0.7653 C7 0.5551 A10 0.8092 G11 0.0034 E5 0.0074 B5 0.0111
E8 0.7543 D9 0.5484 C8 0.7829 B1 0.0029 A1 0.0001 C6 0.0086
A1 0.6678 E9 0.5154 B4 0.7820 F7 0.0002 E2 0.0001 C1 0.0071
D1 0.6356 D1 0.4976 E7 0.7511 G3 0.0000 A2 0.0000 F10 0.0014
were Agrobel 910 (A8) and BRS Gira 36 (G10) (Figure 2).
The sunflower hybrid Dow M734 was the common genotype included in all trials; it showed a general pattern, since in four out of seven growing seasons it was located on the seventh sector (Figure 2), showing high disease severity (up to 19.25%) and high yield (up to 1,852 kg ha‑1). Karimizadeh et al. (2013) observed the same fact in lentil genotypes, when GGE biplots for individual years were similarly constructed and indicated, for each year, that some of the treatments fell into different sectors, and some fell into similar sectors, but the general pattern of location groupings did not vary across the years.
'BRS Gira 27' (E6) located on the vertex of the seventh sector and showed the highest yield in 2009/2010 growing season, despite the disease severity of 22.51%. In this sector, there were genotypes showing tolerance to Alternaria disease, which is the ability of plants to produce a good crop, even when they are infected with a pathogen (Agrios, 1997).
According to the agronomical performance, genotypes located on sectors 1 and 2 showed high yield and high oil content, respectively, and should be preferably selected. Genotypes showing tolerance to the disease, found on sector 7, may also be selected.
The present results have several implications for the future breeding, genotype evaluation, and recommendation of sunflower hybrids. GGE biplot has greatly helped in the accurate analysis and data interpretation from breeding and agronomic field experiments (Akinwale et al., 2014), and offered the opportunity to identify adapted sunflower genotypes for resistance to Alternaria leaf spot that can be used in sunflower breeding programs.
Conclusions
1. GGE biplot analysis allows for a meaningful and useful presentation, and is an efficient method for grouping sunflower genotypes, as a function of Alternaria leaf spot severity, yield, and oil content.
2. GGE biplot is adequate to display different sunflower genotype groups based on their agronomical performance.
Acknowlegments
To Allan Misael Flausino and Roberval Aparecido Fagundes for their technical assistance in this research.
References
AGRIOS, G.N. Plant pathology. 4th ed. San Diego: Academic
Press, 1997. 635p.
AKINWALE, R.O.; FAKOREDE, M.A.B.; BADU‑APRAKU, B.; OLUWARANTI, A. Assessing the usefulness of GGE biplot as a statistical tool for plant breeders and agronomists. Cereal Research Communications, v.42, p.534‑546, 2014. DOI: 10.1556/
CRC.42.2014.3.16.
ALVES, J.L.; WOUDENBERG, J.H.C.; DUARTE, L.L.; CROUS, P.W.; BARRETO, R.W. Reappraisal of the genus Alternariaster
(Dothideomycetes). Persoonia, v.31, p.77‑85, 2013. DOI:
10.3767/003158513X669030.
BALALIC, I.; ZORIC, M.; BRANKOVIC, G.; TERZIC, S.; CRNOBARAC, J. Interpretation of hybrid x sowing date interaction for oil content and oil yield in sunflower. Field Crops Research,
v.137, p.70‑77, 2012. DOI: 10.1016/j.fcr.2012.08.005.
BRANKOVIC, G.R.; BALALIC, I.M.; ZORIC, M.Z.; MIKLIC, V.J.; JOCIC, S.B.; MOMIROVIC, G.G.S. Characterization of sunflower testing environments in Serbia. Turkish Journal of Agriculture and Forestry, v.36, p.275‑283, 2012. DOI: 10.3906/
tar‑1106‑45.
COMPANHIA NACIONAL DE ABASTECIMENTO.
Acompanhamento da safra brasileira: grãos: safra 2013/14: nono
levantamento. v.1, n.9, jun. 2014. 81p. Disponível em: <http://www. conab.gov.br/OlalaCMS/uploads/arquivos/14_06_10_12_12_37_ boletim_graos_junho_2014.pdf>. Acesso em: 10 set. 2014. FARSHADFAR, E.; ZALI, H.; MOHAMMADI, R. Evaluation of phenotypic stability in chickpea genotypes using GGE‑Biplot.
Annals of Biological Research, v.2, p.282‑292, 2011.
GABRIEL, K.R. The biplot graphic display of matrices with application to principal component analysis. Biometrika, v.58,
p.453‑467, 1971. DOI: 10.1093/biomet/58.3.453.
GRUNVALD, A.K.; CARVALHO, C.G.P. de; LEITE, R.S.; MANDARINO, J.M.G.; ANDRADE, C.A. de B.; SCAPIM, C.A. Predicting the oil contents in sunflower genotype seeds using near‑infrared reflectance (NIR) spectroscopy. Acta Scientiarum. Agronomy, v.36, p.233‑237, 2014. DOI: 10.4025/actasciagron.
v36i2.17677.
JALATA, Z. GGE‑biplot analysis of multi‑environment yield trials of barley (Hordeumvulgare L.) genotypes in Southeastern
Ethiopia Highlands. International Journal of Plant Breeding
and Genetics, v.5, p.59‑75, 2011. DOI: 10.3923/ijpbg.2011.59.75.
KARIMIZADEH, R.; MOHAMMADI, M.; SABAGHNI, N.; MAHMOODI, A.A.; ROUSTAMI, B.; SEYYEDI, F.; AKBARI, F. GGE biplot analysis of yield stability in multi‑environment trials of lentil genotypes under rainfed condition. Notulae Scientia Biologicae, v.5, p.256‑262, 2013.
KRANZ, J.; JÖRG, E.The synecological approach in plant disease epidemiology. Review of Tropical Plant Pathology, v.6, p.27‑38,
1989.
LEITE, R.M.V.B.C.; AMORIM, L. Elaboração e validação de escala diagramática para mancha de Alternaria em girassol.
Pesq. agropec. bras., Brasília, v.50, n.8, p.649‑657, ago. 2015 DOI: 10.1590/S0100‑204X2015000800003 LEITE, R.M.V.B.C.; AMORIM, L.; BERGAMIN FILHO, A.
Relationships of disease and leaf area variables with yield in the
Alternaria helianthi‑sunflower pathosystem. Plant Pathology,
v.55, p.73‑81, 2006. DOI: 10.1111/j.1365‑3059.2005.01313.x. PRADO, P.I.; LEWINSOHN, T.M.; CARMO, R.L. do; HOGAN, D.J. Ordenação multivariada na ecologia e seu uso em ciências ambientais. Ambiente e Sociedade, ano 5, p.1‑15, 2002.
RAO, C.R. The use and interpretation of principal component analysis in applied research. Sankhyā: The Indian Journal of Statistics, Series A, v.26, p.329‑358, 1964.
SCHNEITER, A.A.; MILLER, J.F. Description of sunflower growth stages. Crop Science, v.21, p.901‑903, 1981. DOI: 10.2135/cropsc
i1981.0011183X002100060024x.
SILVA, N.R. da; PADOVANI, C.R. Utilização de componentes
principais em experimentação agronômica. Energia na
Agricultura, v.21, p.98‑113, 2006.
STATSOFT. Statistica for windows: computer program manual.
Tulsa, 1995.
ULLAH, I.; AYUB, M.; KHAN, M.R.; ASHRAF, M.; MIRZA, M.Y.; YOUSAF, M. Graphical analysis of multi‑environment trial
(MET) data in sunflower (Helianthusannuus L.) through clustering
and GGE biplot technique. Pakistan Journal of Botany, v.39,
p.1639‑1646, 2007.
YAN, W. Crop variety trials: data management and analysis. West
Sussex: J. Wiley, 2014. 351p. DOI: 10.1002/9781118688571. YAN, W.; FRÉGEAU‑REID, J.; MARTIN, R.; PAGEAU, D.; MITCHELL‑FETCH, J. How many test locations and replications are needed in crop variety trials for a target region? Euphytica, v.202, p.361‑372, 2015. DOI: 10.1007/
s10681‑014‑1253‑7.
YAN, W.; KANG, M.S. GGE biplot analysis:a graphical tool for
breeders, geneticists, and agronomists. Boca Raton: CRC Press, 2003. 271p.
YAN, W.K.; RAJCAN, I. Biplot analysis of test sites and trait relations of soybean in Ontario. Crop Science, v.42, p.11‑20, 2002.
DOI: 10.2135/cropsci2002.0011.
YAN, W.; TINKER, N.A. Biplot analysis of multi‑environment trial data: principles and applications. Canadian Journal of Plant Science, v.86, p.623‑645, 2006. DOI: 10.4141/P05‑169.