Abstract
Reliable measurements of the Soil Water Retention Curve, SWRC, are necessary for solving unsaturated low problems. In this sense, a method to obtain the SWRC of a silty sand using a low pump, as well as details about procedures and some results, are herein presented. The overall conclusion is that the new method is very convenient, fully automated, and produces reliable results in a fast and easy way, making the tech-nique very promising.
keywords: Soil water retention curve, low pump, unsaturated low, laboratory testing.
Resumo
A curva de retenção de água no solo é uma função característica do solo neces-sária para a resolução de problemas geotécnicos com luxo em solos não saturados. Os ensaios, para determinação direta dessa propriedade, são, em geral, custosos e demorados, fazendo com que seja muito difundido o uso de bancos de dados de cur-vas de retenção para diferentes tipos de solos, classiicadas a partir de propriedades--índice, tais como granulometria e densidades. Esse expediente, ainda que possível para estudos preliminares, não se apresenta suiciente para um problema especíico. Nesse sentido, apresenta-se um método para obtenção da curva de retenção em labo-ratório com o auxílio da bomba de luxo. Foi feita a implantação de um sistema para a realização desse ensaio, que, juntamente com procedimentos e alguns resultados, tem os detalhes descritos no artigo. A avaliação geral da técnica foi a mais positiva possível, fazendo crer aos autores que o uso a bomba de luxo, nessa aplicação, seja bastante promissor.
Palavras-chave: curva de retenção de água em solos, bomba de luxo, luxo não satu-rado, ensaio de laboratório.
Luciana Portugal Menezes
Mestranda da Universidade Federal de Ouro Preto Departamento de Engenharia de Minas - DEMIN Ouro Preto - Minas Gerais - Brazil
Waldyr Lopes Oliveira Filho
Professor da Universidade Federal de Ouro Preto Escola de Minas, Departamento de Engenharia de Minas - DEMIN
Ouro Preto - Minas Gerais - Brazil [email protected]
Cláudio Henrique Carvalho Silva
Professor da Universdade Federal de Viçosa Departamento de Engenharia Civil Viçosa - Minas Gerais – Brazil [email protected]
Determination of the
Soil Water Retention Curve
Using the Flow Pump
Determinação da Curva de Retenção de Água
em Solos Utilizando a Bomba de Fluxo
Mining
Mineração
1. Introduction
In Classic Soil Mechanics, soil is modeled as a two-phase system: soil-air and soil-water, or their equivalents, dry soil and saturated soil (Terzaghi, 1936). Recently, with the raise of environmen-tal awareness regarding contaminant
transport, there has been a need to address low and shear strength in un-saturated soils.
So, a three-phase model for soil, that is, a soil with air besides water in its pores was used. This extension of
knowledge gave rise to a new discipline called Unsaturated Soil Mechanics.
An important development for unsaturated low studies can be ex-pressed by Equation (1), known as the Richard´s equation.
http://dx.doi.org/10.1590/0370-44672015680108
∂
∂
x[
[
ψ
∂
∂
∂
∂
∂
∂
xK
C
y z z
1
( )
t
ψ
( )
ψ∂
∂
yψ
[
ψ ∂
∂
K
( )
ψ[
ψ
[
[
∂
∂
K
( )
+ + ψ+
(
(
=(1)
2. Material and methods
The low pump system (FPS) de-veloped by Lee (2011) to determine the
SWRC was implemented in the Mining Residue Laboratory at Federal University
of Ouro Preto (UFOP). Figure 1 shows the FPS built at UFOP.
and
C
(ψ) the speciic moisture capacity, deined in the soil water retention curve(SWRC) by Equation (2) (FREEZE & CHERRY, 1979).
ψ
C
( )
dθdψ (2)
The SWRC, also called soil water characteristic curve, describes the rela-tionship between the soil matrix suction (expressed in terms of head or pressure) and the soil volumetric water content, θ, or the degree of saturation,
S
.Besides usual tests for SWRC determination (filter paper, pressure plate, resistance/capacitance sensors and others) alternative techniques have been developed, such as the procedures presented by Znidarcic et al. (1991), Manna et al. (1993), Wildenschild et al. (1997), Hwang (2002) and Lee (2011). In all of these publications, the authors used a low pump to obtain the SWRC. The low pump is used to establish a water lux through a soil specimen at an imposed low rate, establishing a transient or permanent seepage regime.
The equipment is operated in both withdrawal mode and infusion mode, al-lowing capture of the intrinsic hysteresis aspect of the SWRC.
During the test, the low rate and the low pump working time information is obtained. Moreover, the soil suction, existing inside the specimen, is also known through a differential pressure transducer, connected to the specimen top (air) and bottom (water). Then, the SWRC is obtained through recorded data reduction.
This low pump technique shows several advantages when compared to usual tests to obtain the SWRC. For instance, the same specimen is used to obtain both drying and wetting soil wa-ter retention curves. Another important advantage is that the test time can be
shortened to just a few days. In addition, the whole operation can be automated as shown in this paper.
In Brazil, the use of a low pump to obtain other soil properties, such as soft soil consolidation relationships (hydrau-lic consolidation test or seepage induced consolidation test) was well established by research carried out by Botelho (2002), Lima (2009) and Oliveira-Filho & Menezes (2012). These studies facili-tated the extension of the use of the low pump in geotechnical engineering.
The objectives of this research were to implement a system to obtain the SWRC using the methodology developed by Lee (2011), to verify its applicability for mining tailings, and also to con-tribute to the spread of this promising technique in Brazil.
Figure 1
Flow pump system at
The FPS consists of a modified triaxial cell, an air pressure and vacuum system with gauges, a differential pressure transducer, an automated test control and data acquisition software and hardware, and a low pump. The low pump used in the experiments was a PHD 4400 model made by Harvard Apparatus Company.
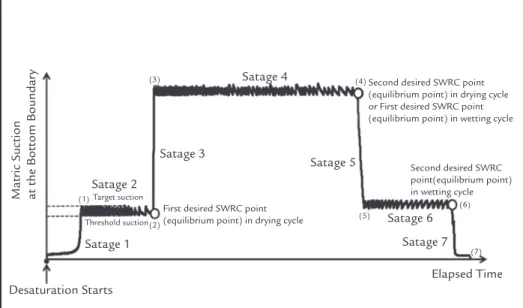
The SWRC test with the flow pump is divided in water withdrawing stages (drainage cycle) or infusion stages (iniltration cycle), which causes suction to increase or decrease within the soil specimen. This is followed by equilibrium stages to generate suction and volumetric water content equalization.
In the beginning of the test, the pump is in the withdrawal mode, caus-ing a steady increase in suction within the specimen. When the suction reaches
a target level (target suction), the pump is halted and the suction drops until it reaches a limit value (threshold suction). According to McCartney & Znidarcic (2010), the difference between these two values should be 1 kPa for accuracy. Having reached the threshold value, the pump is automatically restarted by the control system, which causes suction to increase again until it reaches the target value (target suction), when the pump is halted once more. This process is auto-matically repeated many times, creating an equilibrium stage, until a certain time limit for suction decay is reached, 5000 seconds in this case.
After the end of the equilibrium stage, the low pump is restarted, begin-ning a new cycle of water withdrawal. Consequently, there is an increase in
suction until the next target suction is reached. At this time, the pump is halted and a new equilibrium stage starts. This procedure is repeated for several target suctions. The last target suction in equilibrium is the irst stage of the SWRC inverse way, now with the pump in the infusion mode (iniltration cycle). The following steps are in water infu-sion and equilibrium stages within the specimen. During the infusion phase, the suction decreases as water lows into the specimen.
Target suction values are deined within the suction range of interest in the drainage stage. They are usually re-peated in the infusion phase of the test. Figure 2 schematically illustrates the test steps and the equalization stages within the specimen as suggested by Lee (2011).
Figure 2 Schematic test results for the SWRC using the flow pump (Lee, 2011).
In the low pump test, the axis translation technique is used to produce suction. Thus, when the pump is operat-ing in withdrawal or infusion mode, the suction is measured by the pressure dif-ferential transducer, taking the pressure difference between the air pressure at the specimen top and the water pressure at the specimen bottom. The air pressure is the same backpressure used in the speci-men saturation before the test starts, and it remains constant during the entire test. The suction increases in the drain-age cycle and decreases in the iniltration cycle. A data acquisition system is used to store suction values developed within the specimen during the test.
The reference apparent velocity (Darcian) for testing should be slightly
higher than the specimen saturated hydraulic conductivity (ksat), which is obtained before the SWRC test, using the same FPS. If the velocity is lower than ksat the test will last quite a long time. If the velocity is much higher than ksat, there will be an impact on precision to reach the target and the threshold suctions.
The material used to prepare the test specimen was silty sand, classiied as SM (Uniied Soil Classiication System, USCS), passing through #4 sieve (4.8 mm). Specimen dimensions were 72x40 mm (height x diameter). Figure 3 shows the gradation curve and speciic gravity corresponding to this material.
Specimen preparation and satura-tion were carried out according to the
procedures proposed by Hwang (2002). A soil specimen is placed in the triaxial cell on a saturated ceramic stone with an air entry value of 1 bar (100 kPa) and a diameter slightly larger than the specimen diameter to prevent the low of air from the specimen to the measuring system, which needs hydraulic continu-ity and complete saturation. The ceramic stone sits on a saturated iltering porous stone, placed on the triaxial pedestal. A iltering porous stone and a triaxial specimen head are placed on the speci-men top. Filter paper is also placed at both ends of the specimen to prevent impregnation of ine particles in the ceramic and porous stones. The triaxial cell is then closed and illed with water, as the conining luid.
Desaturation Starts
Elapsed Time
Matric Suction at the Bottom Boundar
y Satage 2 Satage 1 Satage 3 Satage 4 Satage 5 Satage 6 Satage 7
Second desired SWRC point (equilibrium point) in drying cycle or First desired SWRC point (equilibrium point) in wetting cycle
First desired SWRC point (equilibrium point) in drying cycle
Second desired SWRC point(equilibrium point) in wetting cycle
The specimen initial saturation is obtained by percolation of distilled and de-aired water using vacuum applied in
the top drainage line.
Saturation is later completed by backpressure.
To ensure specimen saturation, B parameter test is performed according to Equation (3).
3. Results and discussions
Figure 3
Specimen gradation curve and specific gravity.
=
B
3
Δ
Δ
δu (3)(4) where
B
is the Skempton´s pore pressureparameter, ∆u the water pore pressure
change in undrained conditions, and
∆
σ
3 the pressure increase in the conining luidof the triaxial cell.
Existing suctions within the speci-men during the test and time periods are recorded during the test when the pump is operating (in withdrawal or infusion
modes) or is halted.
This last information is used to determine the amount of water remain-ing in the specimen at any time.
From these records, the average degree of saturation during the test is evaluated (Equation (4))
=
S
S
0+-
Δ
S
=
S
0+-
Δ
t
nV
Q
where
S
= degree of saturation at any time;S
o = initial degree of saturation, usuallyequal to 1;
Q
= pump low rate;∆
t
= accumulated time of pump operation;n
= porosity;V
= total volume.With suction and degree of satura-tion pair values, SWRC data points are
itted according to mathematical or pre-dicting models such as Brooks & Corey
(1964) and van Genuchten (1980).
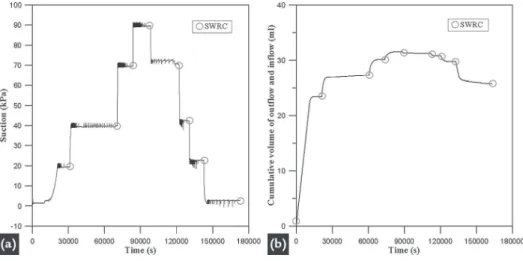
Testing to obtain SWRC started with B parameter test, as shown in Figure 4a.
Cell pressure was increased by 40
kPa and the specimen water pore pres-sure increased the same amount. With a saturated specimen, the constant low rate permeability test was then
Results shown in Figure 5 can be combined to produce the suction
ver-sus average volumetric water content, shown in Figure 6.
The circled points are the actual data points of the SWRC.
Figure 4 Preliminary results: a) B Parameter test results; b) Constant flow rate test results to obtain ksat.
Figure 5 Test results to obtain the SWRC using the FPS.
Figure 6 Suction – average volumetric water content curve. The SWRC test was performed by imposing a low rate of 0.12 ml/min,
which corresponds to the double of ksat value. The chosen suction target levels
were 20, 40, 70 and 90 kPa. Test results are shown in Figure 5.
Test data were then itted to the mathematical models of Brooks & Co-rey (1964) and van Genuchten (1980)
as shown in Figure 7.
This igure demonstrates that both models provide an excellent it to the
Figure 7
SWRC according to fitting models: (a) van Genuchten;
(b) Brookes & Corey.
4. Conclusions
Test methods to obtain the soil water retention curve (SWRC) are still in development, as the existing ones require intensive labor or are very time consuming.
The technique that uses a flow pump system was implemented in the Mining Residue Laboratory at UFOP and applied to a silty sandy soil showing excellent results.
The overall assessment is that the new method is very convenient, fully automated, and produces reliable results in a fast and easy way, making this technique very promising.
5. Acknowledgements
Authors thank Professor Dobro-slav Znidarcic, from the University of Colorado - USA, for sharing his ideas
about the technique, the engineering student Ary C. L. Nogueira for his help with the test control and data
acquisi-tion, and FAPEMIG, UFOP and Vale for funding this research.
6. References
BOTELHO, A. P. D. Implementation of test methodologies for low processes consti-tutive relations in soils using low pump. Ouro Preto: Federal University of Ouro Preto, 2001. ( Msc Dissertation).
Received: 16 June 2014 - Accepted: 6 January 2015
FREEZE, R. A., CHERRY, J. A.. Groundwater. London, UK: Prentice Hall, 1979. 604 p.
HWANG, C.. Determination of material functions for unsaturated low. Colorado USA: Department of Civil, Environmental and Architectural Engineering, Univer-sity of Colorado, 2002. 140p..
LEE, J.. Limits to continuity of unsaturated, compacted soils. Colorado, USA: Univer-sity of Colorado, 2011. 158p..
LEE, H. C., WRAY, W. K.. Techniques to evaluate soil suction – a vital unsaturated soil water variable. In: PROCEEDINGS OF THE FIRST INTERNATIONAL CONFERENCE ON UNSATURATED SOIL, Paris, France: Balkema, 1995. v.2, p. 615-622.
LIMA, V. A. Use of HCT and TDR techniques for monitoring of consolidation
pro-cess in Tailings dams. São Carlos, SP: USP, São Carlos School of Engineering,
2009. (MSc dissertation). (In Portuguese).
MANNA, M., ZNIDARCIC, D., ILLANGASEKARE, T.. Suction-saturation me-asurements in soils using low pump technique. Geotechnical Testing Journal,
ASTM. 1993.
MCCARTNEY, J. S., ZNIDARCIC, D.. Testing system for hydraulic properties of unsaturated nonwoven geotextiles. Geosynthetics International 17, n. 5, p.355-363, 2010.
OLIVEIRA FILHO, W. L., MENEZES, L.P.. Consolidation Relationships for Diffe-rent Ore Tailings in Brazilian Mines, 2012.
TERZAGHI, K. The shearing resistance of saturated soils. In: INTERNATIO-NAL CONFERENCE. ON SOIL MECHANICS, 1. Cambridge, Mass: 1936. v.1. p. 54–56.
VAN GENUCHTEN, M. Th. A closed-form equation for predicting the hydraulic conductivity of unsaturated soils. Soil Science Society of America Journal. n.44, p. 892-898, 1980.
ZNIDARCIC, D., ILLANGASEKARE, T., MANNA, M. Laboratory testing and parameter estimation for two - phase low problems. In: MCLEANET et al. (Ed.) PROC. OF THE GEOTECHNICAL ENGINEERING CONGRESS. New York: Boulder CO, ASCE, 1991.