Original article
Cross-sectional study on the weight and length of infants
in the interior of the State of São Paulo, Brazil: associations
with sociodemographic variables and breastfeeding
Estudo transversal do peso e do comprimento de lactentes no interior do estado de São Paulo,
Brasil: associações com variáveis sócio-demográicas e aleitamento materno
Julia Laura Delbue Bernardi
1, Regina Esteves Jordão
2, Antônio de Azevedo Barros Filho
3 Department of Pediatrics, Faculdade de Ciências Médicas da Universidade Estadual de Campinas (FCM/Unicamp)1PhD. Nutritionist in the Department of Pediatrics, Faculdade de Ciências Médicas da Universidade Estadual de Campinas (FCM/Unicamp), Campinas, São Paulo, Brazil. 2MSc. Nutritionist in the Department of Pediatrics, Faculdade de Ciências Médicas da Universidade Estadual de Campinas (FCM/Unicamp), Campinas, São Paulo, Brazil.
3PhD. Associate professor in the Department of Pediatrics, Faculdade de Ciências Médicas da Universidade Estadual de Campinas (FCM/Unicamp), Campinas, São Paulo, Brazil.
ABSTRACT
CONTEXT AND OBJECTIVE: Increasing obesity is starting to occur among Brazilians. The aim of this study was to investigate the weight and length of children under two years of age in relation to sociodemographic variables and according to whether they were breastfed.
DESIGN AND SETTING: Cross-sectional randomized study conducted in 2004-2005, based on the declaration of live births (SINASC) in Campinas, Brazil.
METHODS: 2,857 mothers of newborns were interviewed and answered a questionnaire seeking socioeconomic and breastfeeding information. The newborns’ weights and lengths were measured at the end of the interviews and the body mass index was calculated. Percentiles (< 15 and > 85) and Z-scores (< -1 and > +1) were used for classiication based on the new growth charts recommended by WHO (2006). The log-rank test, multiple linear regression and binomial test (Z) were used. The statistical signiicance level used was 5%.
RESULTS: The predominant social level was class C. The median for exclusive breastfeeding was 90 days; 61.25% of the children were between P15 and P85 for body mass index and 61.12% for length, respectively. Children whose mothers studied for nine to eleven years and children whose mothers were unemployed presented lower weight. Children whose mothers worked in health-related professions presented lower length when correlated with breastfeeding.
CONCLUSION: The breastfeeding, maternal schooling and maternal occupation levels had an inluence on nutrition status and indicated that obesity is occurring in early childhood among the infants living in the municipality.
RESUMO
CONTEXTO E OBJETIVO: O aumento da obesidade começa a acontecer entre os brasileiros. O objetivo do estudo foi veriicar o peso e a altura associados a variáveis sócio-demográicas de crianças menores de dois anos, de acordo com o aleitamento materno.
TIPO DE ESTUDO E LOCAL: Estudo transversal, aleatório, realizado entre 2004 e 2005, com base na Declaração de Nascidos Vivos (SINASC) de Campinas, São Paulo.
MÉTODOS: Mães de 2.857 crianças foram entrevistadas respondendo a um questionário com informações sócio-demográicas e de amamentação. Ao inal, foram aferidos peso e comprimento dos lactentes e calculado o Índice de Massa Corporal. Os pontos de percentis (< 15 e > 85) e de escore-Z (< -1 e > +1) foram utilizados para classiicação, com base nos novos gráicos de crescimento recomendados pela Organização Mundial de Saúde 2006. Foi utilizado o teste de log-rank, a análise de regressão linear e o teste binomial (Z). O nível de signiicância estatística adotado foi de 5%.
RESULTADOS: O nível social predominante foi classe C. A mediana do aleitamento materno exclusivo foi de 90 dias. 61,25% das crianças estavam entre os percentis P15-P85 para índice de massa corporal e 61,12% para comprimento, respectivamente. Nas crianças cuja mãe estudou entre 9 e 11 anos o peso foi menor, bem como para os ilhos de mães desempregadas. Filhos de mães com proissões na área da saúde apresentaram menor comprimento, quando correlacionados ao aleitamento.
CONCLUSÃO: Os níveis encontrados para aleitamento, escolaridade e proissão maternas exerceram inluência sobre o estado de nutrição, indicando que a obesidade está acontecendo precocemente na infância nos lactentes do município.
KEY WORDS:
Growth. Body weight. Body height. Breast feeding. Educational status.
PALAVRAS-CHAVE:
Crescimento. Peso corporal. Estatura.
INTRODUCTION
Growth is a complex process that begins with conception, and its purpose is to enable evolution to maturity. By the time that human be-ings reach maturity, many structural modiications are evident. Growth is characterized by increases in total body size or in any of its parts, with associations between hyperplasia and hypertrophy. Development means acquisition of functions and abilities and it has been associated with cell diferentiation and maturation of diferent organs and systems.1,2
If the general conditions are suitable, growth and development will sequentially interact with each other until maturity is reached. he intra-uterine phase and the irst year of life are the most critical periods, dur-ing which the intensity of these parameters undergoes changes.1,2
How-ever,any reference to infant malnutrition should take into account that it is a public health problem in developing countries, given that 38.1% of children under ive years of age are estimated to present abnormal length/height and 31% of them, abnormal weight, in these countries.1,2
Non-exclusive breastfeeding over the irst six months of life, together with the family’s socioeconomic level, and subsequent inadequate in-troduction of complementary foods into the diet, may afect the devel-opment of dietary habits and growth.3,4 In the speciic case of the initial
years of life, weight and length measurements are important indicators of growth, in addition to being recommendable in studies aimed at as-sessing the nutritional status of a population.5-8
In 2000, the Brazilian Ministry of Health (DATASUS)5 found that
the prevalence of exclusive breastfeeding in Brazil was 53.1% for one month, 21.6% for between three and four months and 9.7% for between ive and six months. In the city of São Paulo, these rates were 36.2%, 15.1% and 7.6%, respectively. Low schooling level, young age, primipar-ity, early maternity and lack of knowledge about breastfeeding practices among the mothers were considered to be risk factors for weaning.
Anthropometric data need to be gathered periodically in order to monitor these conditions and to perform somatic evaluations. he process must be evaluated based on parameters such as weight, length and cephalic and thoracic perimeters, in order to determine whether weight is adequate for height and whether growth is following the nor-mal pattern.2-4
In the speciic case of the initial years of life, weight and length mea-surements are important indicators of growth.6-9 Growth can be
com-pared with a reference tool such as the curves published by the World Health Organization. Such comparisons can be made periodically, with demonstrations using graphs of postnatal growth patterns.
In Brazil, the National Demography and Health Survey (Pesquisa Nacional sobre Demograia e Saúde, PNDS)10 found that for the initial
24 months of life, the length-for-age indicator proved to be the most pronounced measurement of malnutrition. Length deicit was found to afect 7.0% of children, while weight deicit afected 1.7%.
On the other hand, overweight and obesity have shown increas-ing prevalence because they have been associated with inadequate feed-ing behavior.10 Monte and Giugliani11 reported that the complementary
feeding must be appropriate for weaning, to enable optimum growth and development. However, in nutritional terms, early introduction of complementary feeding could bring negative consequences, such as
the introduction of inappropriate nutrients and decreased duration of breastfeeding, with increased risk of diseases.9
Campinas, a city with over one million inhabitants located in the interior of the State of São Paulo, Brazil, that is considered to present high development (human development index, HDI, of 0.85),12 has
been collecting information on the growth of its children in some re-gions of the municipality, with distinct samples.
OBJECTIVE
he objective of the present study was to investigate the weight and length of children less than two years of age, according to the type and du-ration of breastfeeding, taking into considedu-ration the socioeconomic and demographic characteristics of their families. his was based on a cross-sectional epidemiological survey that aimed to attain an overview of the anthropometric data of infants living in the municipality.
METHODS
his cross-sectional study was carried out using a random draw in the city of Campinas, State of São Paulo, Brazil. he list of newborns was obtained from the live births registry (Sistema de Informação sobre Nascidos Vivos, SINASC),13 which covers 98% of births. his database
is composed of roughly 30 variables (including ethnicity, i.e. the color of the child’s skin, as informed by the mother, and the address of the adult responsible for the child), with access on request, accompanied by the appropriate authorization.
Since this study was to be descriptive in nature, the sample was cal-culated as a proportion of a inite population, using the prevalence of breastfeeding in the municipality (as described in previous years) as the source of information. he month following the birth was used for pling and a sample error of 0.065% was chosen, thus stipulating a sam-ple size of 2747 infants. Bearing in mind losses and refusals to partici-pate, 3000 infants were drawn and 2857 were included in the study.
Cross-sectional epidemiological studies that are based on interview data can be afected by factors4-7 such as the memory of the interviewed
research subjects, use of secondary subjects, subjects’ refusal to partici-pate in the research, inability to locate the potential participants in the study, changes of address, conidentiality of the data informed and the way in which the data obtained is treated. In the present study, 7.3% of the total number of families were not found and 2.5% did not agree to participate. he techniques used to minimize the chances of errors in-cluded checking the data using both the birth certiicate and SINASC records; making additional draws for the questionnaires; conducting in-terviews with the mothers by means of the status quo method, which avoids recent events that would afect the mother’s memory; holding the interviews at the University where the research was conducted; making larger draws in relation to the total sample size, in order to reach or ex-ceed the statistically calculated number; and sending out letters contain-ing information about the purpose of this study to public health oices, maternity hospitals and district councils.
moth-ers were interviewed at their homes after previously establishing an ap-pointment by telephone. he participants’ physical, moral and social wellbeing was always respected. All of the professionals involved were trained to use the tools developed for the survey. he socioeconom-ic and demographsocioeconom-ic information obtained enabled classisocioeconom-ication of the participants’ social level.12,14,15 he interviewers weighed and measured
these infants between zero and twenty-four months of age, by using portable easy-to-handle equipment, and with due regard to the techni-cal instructions.7,16,17 Participation in the study was voluntary and was
only possible after the adult responsible for the child had illed out the free and informed consent statement. he study was approved by the Research Ethics Committee of the Universidade Estadual de Campinas (Unicamp) (CEP 533/2002).
Survey and anthropometry
he conditions of the dwellings (type of construction, water sup-ply and sewage system); mother’s profession (university-level; universi-ty-level in the healthcare sector, i.e. physician, psychologist, dietician, speech therapist, physiotherapist, occupational therapist, nurse, den-tist or pharmacist; non-graduate level employees; or unemployed at the time of the interview; income distribution (expressed as multiples of the minimum monthly salary); and number of household appliances (from zero to four items: refrigerator, freezer, stove, color or black-and-white TV, radio, telephone, cell phone, computer and access to the internet), were used in the study as references for the socioeconomic level and liv-ing conditions of the children and their families (IBGE/PNAD).12,14,15
“Breastfeeding categories”, in accordance with World Health Orga-nization (WHO) recommendations, were used for illing out informa-tion on breastfeeding:2 exclusive breastfeeding, predominant
breastfeed-ing and full breastfeedbreastfeed-ing. In exclusive breastfeedbreastfeed-ing, the infant only drinks milk directly from the breast or milk extracted from it, without
any addition of other liquids or solids, with exception of vitamins, min-erals or medications in the form of drops or syrups. In predominant breastfeeding, the infant receives breast milk and may additionally re-ceive liquids such as water, tea and fruit juices. In full breastfeeding, maternal milk provision is associated with solid and semi-solid foods, including non-human milk.
he infants’ weights and lengths were measured by the interviewers at their homes, using portable equipment in accordance with the man-ufacturers’ instructions.7,16,17 A portable Soehnle pediatric balance was
used for weights.A portable Seca anthropometer was used for lengths. Anthropometric data were shown as percentiles and Z-scores, correlat-ing body mass index (BMI) and length-for-age. Cutof points of un-der 15 and over 85 for percentiles and between -1 and +1 for Z-scores were selected to classify low weight and short length, and overweight and long length, respectively. he Epi-Infosoftware18 and the Statistical
Package for the Social Sciences (SPSS) statistical software19 were used
to make comparisons with the new growth curve recommended by the
World Health Organization (WHO 2006; Anthro software).20-22
Data processing and analysis
In order to describe the sample proile according to the study vari-ables, frequency tables of category variables were constructed contain-ing absolute values (N) and percentages (%). Descriptive statistics on continuous variables were produced using median values. In order to study BMI and length curves, percentiles and Z-scores were calculated for each age group and gender. he binomial test (Z) was used to com-pare the proportions between percentile values found among children in Campinas and the WHO 2006 reference values. Linear regression anal-ysis was used in order to it the curves to the original data. he statistical signiicance level used for all tests was 5% (P < 0.05).
RESULTS
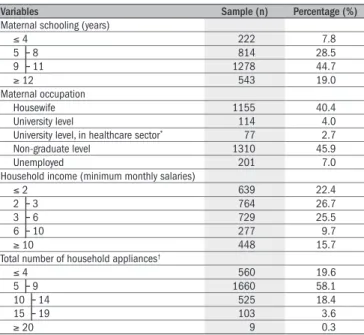
Table 1 describes the sociodemographic proile of the population evaluated. Boys accounted for 50.7% of the children. Most mothers had studied beyond elementary school and either were working in non-grad-uate level professions or declared that they were housewives. Universi-ty-level degrees were held by 6.7%, among which 2.7% related to the healthcare sector. Monthly income associated with the number of house-hold appliances allowed most of the study population to be classiied as economic class C, in accordance with the categories of the Brazilian In-stitute for Geography and Statistics (Instituto Brasileiro de Geograia e Estatística; IBGE),12,14,15 although all classes were represented.
Table 2 shows that the teenage mothers breastfed less, as did the moth-ers who were living without a partner and those who were working in technical professions. he mothers who were working in healthcare-relat-ed professions breastfhealthcare-relat-ed for longer. During the irst month of life, 66.2% of the children were on exclusive breastfeeding and 83.1% were on full breastfeeding. Maternal schooling level inluenced breastfeeding such that the children whose mothers had had education for either smaller or greater numbers of years received exclusive breastfeeding for longer periods.
Table 3 shows that only the weight curve for the female gender presented a signiicant efect on the interaction between predominant
Variables Sample (n) Percentage (%)
Maternal schooling (years)
≤ 4 222 7.8
5 ├ 8 814 28.5
9 ├ 11 1278 44.7
≥ 12 543 19.0
Maternal occupation
Housewife 1155 40.4
University level 114 4.0 University level, in healthcare sector* 77 2.7
Non-graduate level 1310 45.9
Unemployed 201 7.0
Household income (minimum monthly salaries)
≤ 2 639 22.4
2 ├ 3 764 26.7
3 ├ 6 729 25.5
6 ├ 10 277 9.7
≥ 10 448 15.7
Total number of household appliances†
≤ 4 560 19.6
5 ├ 9 1660 58.1
10 ├ 14 525 18.4
15 ├ 19 103 3.6
≥ 20 9 0.3
Table 1. Sociodemographic status of study families, Campinas, Brazil, 2004-2005
*Maternal occupation (university level, in healthcare sector): physician, psychologist, dietician, speech therapist,
physiotherapist, occupational therapist, nurse, dentist or pharmacist; †Total number of household appliances:
Variables
Median (days) Exclusive breastfeeding
(95% CI)
Full breastfeeding (95% CI)
Maternal age (years)
≤ 20 60 (49.8-70.2) 120 (109.1-130.9) 20 ├ 34 90 (87.2-92.8) 120 (116.5-123.5)
≥ 35 60 (50.9-69.1) 120 (110.7-129.3) Maternal occupation
Housewife 90 (85.8-94.2) 120 (113.1-126.9) University level 120 (94.8-145.2) 120 (100.8-139.2) University level, in healthcare sector 120 (98.0-142.0) 150 (134.2-165.8) Non-graduate level 60 (56.6-63.4) 120 (116.1-123.9) Unemployed 60 (46.8-73.2) 120 (110.1-129.9) Maternal schooling (years)
≤ 4 90 (76.7-103.3) 120 (110.0-130.1) 5 ├ 8 60 (55.5-64.5) 120 (113.0-127.0) 9 ├ 11 60 (56.3-63.7) 120 (115.5-124.5)
≥ 12 90 (80.0-100.0) 120 (113.4-126.6) Marital status
Unmarried 60 (56.6-63.4) 120 (112.5-127.5) Married 90 (87.2-92.8) 120 (116.5-123.5)
Table 2. Exclusive breastfeeding and full breastfeeding correlated with sociodemographic variables, Campinas, Brazil, 2004-2005
CI = conidence interval.
breastfeeding and maternal schooling. he children whose mothers had had schooling for between 9 and 11 years and who had received pre-dominant breastfeeding for longer than 120 days showed higher weight than the other children did (0.37 ± 0.16; P = 0.020). Even though the rate of predominant breastfeeding was signiicant in the multiple model (-0.31 ± 0.14; P = 0.027), it was lower among the children who were breastfed for longer period. his result should be taken into account be-cause of the signiicant interaction.
Table 4 shows the linear regression analysis on weight and length according to the gender. here was a signiicant diference in the weight curve for male infants according to the mother’s profession. Infants whose mothers did not have a job presented lower weight than did those whose mothers had non-graduate level education or low schooling lev-els (-0.43 ± 0.16; P = 0.007 for predominant breastfeeding). On the other hand, there was a signiicant diference in the weight curve relat-ing to predominant breastfeedrelat-ing among the female children. Infants who received predominant breastfeeding for more than 120 days pre-sented lower weight than did those with shorter breastfeeding periods (-0.18 ± 0.09; P = 0.047). here was also a signiicant diference in the length curve in relation to the mother’s profession, such that the chil-dren whose mothers were in healthcare professions presented shorter length than did those whose mothers had technical education or low schooling levels (-1.61 ± 0.76; P = 0.034 for exclusive breastfeeding).
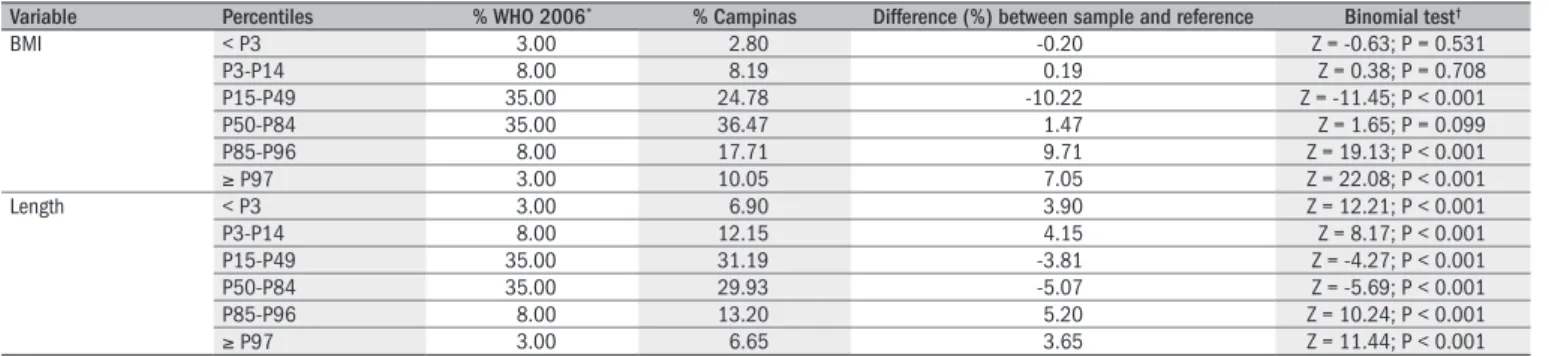
Table 5 shows that the result from the binomial test for diferences between expected (WHO) and observed (Campinas) values was signii-cant for the three BMI percentile ranges analyzed. Lower numbers of children among the sample had eutrophic values and higher numbers presented overweight/obesity, in relation to reference values. Regarding height, all ranges were signiicant: the highest negative percentage dif-ference was between P15 and P49 (-3.81%) and the highest positive diference was between P85 and P96 (5.2%).
In relation to internationalreference graphs,20-22 61.25% of the
chil-dren presented BMI between P15-P85, while 61.12% were within the range for length-for-age; 2.8% were below P3 for BMI and 6.9% for length, while 10.0% were above P97 for BMI and 6.65% for length (Figure 1). he median Z-score was 0.59 (-2.76 to +3.13) for BMI, and 0.11 (-2.42 to +3.69) for length at 12 months of age. he median was 0.34 (-2.13 to +4.98) for BMI and 0.50 (-3.15 to +3.88) for length at 24 months, in both genders (Figure 2).
DISCUSSION
he Campinas study was cross-sectional and population-based. It found that weaning occurred early among the children evaluated, given 50% had already been weaned at three months of age. Moreover, the anthropometric status stood out: growing levels of obesity beginning very early among the children under two years of age living in the city, such that 10% of them presented BMI above percentile 97. Multivari-ate logistic regression models were constructed for this study to iden-tify weight and length changes, and prevalences of 27.76% for excess weight and 19.85% for excess length were observed. his scenario was above the expected values, in comparison with the WHO 2006 refer-ence population (11.0%), thus indicating possible obesity among
chil-Dependent
variable Independent variable Slope
Standard
error P-value
Weight (male) Intercept 4.46 0.12 < 0.001 Age 0.67 0.02 < 0.001 Age (squared term ) -0.014 0.001 < 0.001 Breastfeeding (≥ P50) -0.036 0.133 0.785 Maternal Schooling 1* -0.064 0.175 0.715
Maternal Schooling 2 0.058 0.118 0.624 Maternal Schooling 3 0.012 0.110 0.915 IB versus MS 1† -0.148 0.251 0.557
IB versus MS 2 -0.122 0.175 0.486 IB versus MS 3 0.011 0.158 0.944 Length (male) Intercept 3.61 0.34 < 0.001 Age 2.45 0.05 < 0.001 Age (squared term ) -0.045 0.002 < 0.001 Breastfeeding (≥ P50) 0.245 0.377 0.517 Maternal Schooling 1* -0.591 0.498 0.235
Maternal Schooling 2 -0.055 0.334 0.870 Maternal Schooling 3 0.048 0.312 0.877 IB versus MS 1† -0.630 0.713 0.377
IB versus MS 2 -0.019 0.497 0.970 IB versus MS 3 -0.259 0.447 0.562 Weight
(female)
Intercept 4.05 0.12 < 0.001 Age 0.64 0.02 < 0.001 Age (squared term) -0.013 0.001 < 0.001 Breastfeeding (≥ P50) -0.305 0.138 0.027
Maternal Schooling 1* 0.011 0.155 0.942
Maternal Schooling 2 -0.054 0.114 0.636 Maternal Schooling 3 -0.122 0.109 0.263 IB versus MS 1† -0.075 0.251 0.765
IB versus MS 2 0.071 0.172 0.678 IB versus MS 3 0.373 0.161 0.020
Length (female)
Intercept 51.58 0.32 < 0.001 Age 2.54 0.05 < 0.001 Age (squared term) -0.046 0.002 < 0.001 Breastfeeding (≥ P50) -0.370 0.383 0.334 Maternal Schooling 1* 0.041 0.430 0.925
Maternal Schooling 2 0.069 0.317 0.828 Maternal Schooling 3 -0.183 0.303 0.545 IB versus MS 1† -0.619 0.697 0.375
IB versus MS 2 -0.265 0.477 0.579 IB versus MS 3 0.561 0.447 0.209
Table 3. Linear regression analysis on weight and length according to gender, age, breastfeeding (< P50 versus ≥ P50) and maternal schooling, in terms of the interaction between breastfeeding and maternal schooling, expressed as slope, standard error and P-value. Campinas, Brazil, 2004-2005
*MS = maternal schooling period; MS 1 = less than 4 years, MS 2 = between 5 and 8 years, MS 3 = between
9 and 11 years, IB = interaction breastfeeding, †IB versus MS = interaction between breastfeeding and maternal
dren under two years of age. he median Z-score was more uniform up to 12 months of age, given that a larger number of children were evaluated (2116), thereby giving higher statistical power to the analy-sis, despite the variability. Moreover, the standard deviation in relation to the median was found to vary greatly in some cases, as shown in Ta-bles 3 and 4.
he children presented a trend toward changes in nutritional sta-tus patterns that may have begun in early childhood.23-25 In the
pres-ent study, infants were assessed cross-sectionally by means of a random sample and a representative number of children for the population of this age group in the city. his was useful for diagnosing the nutritional status of infants in the city. However, the fact that cross-sectional stud-ies generally ind associations but do not establish a cause-efect rela-tionship between the variables should be taken into account. BMI val-ues above reference valval-ues were found mainly among children on full breastfeeding.
Based on multiple regression analysis, a signiicant correlation with maternal variables was found. Boys whose mothers were unemployed had lower weights than those born from employed mothers. Regard-ing length, children whose mothers worked as health professionals were the shortest, although this result may have been random or may have shown features of this speciic population. he National Demog-raphy and Health Survey (PNDS, 2006)10 showed an association
be-tween mothers’ schooling and malnutrition. Mothers with no schooling or who had attended school for only one to three years were 11 times more likely to have malnourished children than were mothers with 12 or more years of schooling. In Campinas, 44.5% of mothers had had between 9 and 11 years of education and families living with an income of not more than six minimum monthly salaries were uniformly distrib-uted, although 15.7% were living with an income of over ten minimum monthly salaries. Social indicators associated with the median levels of exclusive or full breastfeeding may have contributed to the nutritional status found, which difered from the national survey, thus showing that initial obesity was occurring at an early age.
Longo et al.26 conducted a study in all of the ive Brazilian
geo-graphical regions on more than 3000 infants. hey concluded that there was a positive association between the speeds of length and weight gain during exclusive breastfeeding and full breastfeeding and the maternal schooling level. Moreover, they concluded that the type of breastfeeding had a positive inluence on the adequacy of growth. he data obtained
Variable Percentiles % WHO 2006* % Campinas Difference (%) between sample and reference Binomial test†
BMI < P3 3.00 2.80 -0.20 Z = -0.63; P = 0.531 P3-P14 8.00 8.19 0.19 Z = 0.38; P = 0.708 P15-P49 35.00 24.78 -10.22 Z = -11.45; P < 0.001 P50-P84 35.00 36.47 1.47 Z = 1.65; P = 0.099 P85-P96 8.00 17.71 9.71 Z = 19.13; P < 0.001
≥ P97 3.00 10.05 7.05 Z = 22.08; P < 0.001 Length < P3 3.00 6.90 3.90 Z = 12.21; P < 0.001 P3-P14 8.00 12.15 4.15 Z = 8.17; P < 0.001 P15-P49 35.00 31.19 -3.81 Z = -4.27; P < 0.001 P50-P84 35.00 29.93 -5.07 Z = -5.69; P < 0.001 P85-P96 8.00 13.20 5.20 Z = 10.24; P < 0.001
≥ P97 3.00 6.65 3.65 Z = 11.44; P < 0.001
Table 5. Comparative analysis on body mass index (BMI) and length percentiles between the sample from Campinas, Brazil (2004 – 2005) and the World Health Organization (WHO) 2006 references
*Expected percentage in the respective percentile zone according to WHO 2006 references. †Z-statistic and P-value in relation to the Binomial Test for proportions, comparing the value shown in Campinas sample with the expected
values from WHO 2006 references.
Dependent
variable Independent variable Slope
Standard
error P-value
Weight (male) Intercept 4.51 0.10 < 0.001 Age 0.67 0.02 < 0.001 Age (squared term ) -0.014 0.001 < 0.001 Breastfeeding (≥ P50) -0.114 0.091 0.209 Maternal Occupation 1* -0.061 0.084 0.466
Maternal Occupation 2 0.080 0.221 0.718 Maternal Occupation 3 -0.212 0.314 0.500 Maternal Occupation 4 -0.425 0.158 0.007
IB versus MO 1† 0.032 0.128 0.804
IB versus MO 2 0.077 0.299 0.798 IB versus MO 3 0.017 0.381 0.965 IB versus MO 4 0.358 0.236 0.129 Length (male) Intercept 53.61 0.27 < 0.001 Age 2.46 0.05 < 0.001 Age (squared term ) -0.04 0.02 < 0.001 Breastfeeding (≥ P50) 0.053 0.258 0.836 Maternal Occupation 1* -0.058 0.238 0.806
Maternal Occupation 2 0.575 0.627 0.359 Maternal Occupation 3 -0.443 0.890 0.619 Maternal Occupation 4 -0.615 0.448 0.170 IB versus MO 1† -0.071 0.362 0.845
IB versus MO 2 0.258 0.850 0.761 IB versus MO 3 0.157 1.082 0.884 IB versus MO 4 0.198 0.669 0.768 Weight
(female)
Intercept 4.05 0.09 < 0.001 Age 0.64 0.02 < 0.001 Age (squared term) -0.013 0.001 < 0.001 Breastfeeding (≥ P50) -0.177 0.089 0.047
Maternal Occupation 1* -0.119 0.080 0.136
Maternal Occupation 2 0.024 0.214 0.911 Maternal Occupation 3 -0.221 0.241 0.359 Maternal Occupation 4 -0.253 0.166 0.127 IB versus MO 1† 0.133 0.125 0.291
IB versus MO 2 -0.277 0.307 0.368 IB versus MO 3 0.240 0.381 0.528 IB versus MO 4 0.187 0.234 0.425 Length
(female)
Intercept 51.59 0.25 < 0.001 Age 2.54 0.05 < 0.001 Age (squared term ) -0.046 0.002 < 0.001 Breastfeeding (≥ P50) -0.089 0.248 0.719 Maternal Occupation 1* -0.237 0.222 0.284
Maternal Occupation 2 0.838 0.593 0.158 Maternal Occupation 3 -0.616 0.669 0.357 Maternal Occupation 4 0.146 0.461 0.751 IB versus MO 1† -0.124 0.348 0.722
IB versus MO 2 -1.332 0.853 0.119 IB versus MO 3 -0.654 1.057 0.536 IB versus MO 4 -0.574 0.651 0.378
Table 4. Linear regression analysis on weight and length according to age, sex, breastfeeding (< P50 versus ≥ P50) and maternal occupation, in terms of the interaction between breastfeeding and maternal occupation, expressed as slope, standard error and P-value. Campinas, Brazil, 2004-2005
*MO = maternal occupation; MO 1 = housewife/no job; MO 2 = university degree; MO 3 = university level,
in healthcare sector; MO 4 = no job. Professions that require a technical level were used as a reference for
comparisons; IB = interaction breastfeeding; †IB versus MO = interaction between breastfeeding and maternal
Figure 1. Body mass index (BMI) and length percentiles for male and female children, compared with World Health Organization (WHO 2006) references. Campinas, Brazil, 2004-2005.
BMI percentiles - Male BMI percentiles - Female
0 2 4 6 8 10 12 14 16 18 20 22 24 10
12 14 16 18 20 22 24
P97
P50
P3 BMI
month
0 2 4 6 8 10 12 14 16 18 20 22 24 10
12 14 16 18 20 22 24
P97
P50
P3
month
BMI
Length percentiles - Male Length percentiles - Female
0 2 4 6 8 10 12 14 16 18 20 22 24 45
50 55 60 65 70 75 80 85 90 95 100
P97 P50 P3
month
0 2 4 6 8 10 12 14 16 18 20 22 24 45
50 55 60 65 70 75 80 85 90 95 100
P97 P50 P3
month
Length (cm)
Length (cm)
from our study are in agreement with their study, such that maternal schooling levels and professions were associated with the duration of the diferent types of breastfeeding and with growth.
Breastfeeding duration and growth were the focus of another study27
conducted in Belém (Pará, Brazil) that reported the efects of breastfeed-ing practices on growth rates, particularly between the sixth and seventh months of age. In the present study, the type of maternal breastfeed-ing mainly afected the length of the infants, when associated with the mother’s profession.
he initial assumptions were that children under two years of age would tend to become malnourished when not breastfed, as would those living under less privileged social conditions. he relationship between length deicits among infants and maternal schooling levels among mothers in healthcare professions is unclear. his was particularly so be-cause the assumption was that the children whose mothers worked in healthcare professions would be less malnourished because these wom-en would have more information on diet and breastfeeding techniques. hus, this inding may have been random, given that less than 3% of the infants’ mothers worked in healthcare professions.
he results from three household survey studies conducted in the city of São Paulo, Brazil, in 1974-1975, 1984-1985 and 1995-1996, 6,28-30 had already shown developments within growth patterns, in which
although malnutrition had been brought under control, it had not yet been solved. hus, obesity began to appear, mainly among the children of wealthier families. he data from the present study demonstrate this trend, even though it was conducted ten years after the last household survey carried out in the State of São Paulo. he deicits in the weight/
BMI mean Z-score – total sample
Weight and length mean Z-score – total sample
0 2 4 6 8 10 12 14 16 18 20 22 24
-1.0 -0.8 -0.6 -0.4 -0.2 0.0 0.2 0.4 0.6 0.8 1.0
BMI
month
0 2 4 6 8 10 12 14 16 18 20 22 24
-1.0 -0.8 -0.6 -0.4 -0.2 0.0 0.2 0.4 0.6 0.8 1.0
weight length
month
Z-score
Z-score WHO
composition in pediatrics]. Rev Ciênc Méd (Campinas). 2003;12(4):351-63.
9. Rice AL, Sacco L, Hyder A, Black RE. Malnutrition as an underlying cause of childhood de-aths associated with infectious diseases in developing countries. Bull World Health Organ. 2000;78(10):1207-21.
10. Brasil. Ministério da Saúde. Pesquisa Nacional sobre Demograia e Saúde da Criança e da Mulher. Apresentação. Available from: http://bvsms.saude.gov.br/bvs/pnds/index.php. Accessed in 2009 (Aug 7).
11. Monte CMG, Giugliani ERJ. Recomendações para alimentação complementar da criança em aleitamento materno [Recommendations for the complementary feeding of the breastfed child]. J Pediatr (Rio J.). 2004;80(5 Supl):s131-s141.
12. Prefeitura Municipal de Campinas. Origem. Available from: http://www.campinas.sp.gov.br/ campinas/campinas/origens/. Accessed in 2009 (Sep 3).
13. Silva AAM, Ribeiro VS, Borba Jr AF, Coimbra LC, Silva RA. Avaliação da qualidade dos dados do sistema de informações sobre nascidos vivos em 1997-1998 [Evaluation of data quality from the information system on live births in 1997-1998]. Rev Saúde Pública = J Piblic Health. 2001;35(6):508-14.
14. Brasil. Ministério do Planejamento, Orçamento e Gestão. Instituto Brasileiro de Geograia e Estatística. Pesquisa Nacional por Amostra de Domicílios. Síntese de indicadores 2006. Available from: http://www.ibge.gov.br/home/estatistica/populacao/trabalhoerendimen-to/pnad2006/default.shtm. Accessed in 2009 (Aug 7).
15. Barros AJD, Victora CG. Indicador econômico para o Brasil baseado no censo demográico 2000 [A nationwide wealth score based on the 2000 Brazilian demographic census]. Rev Saúde Pública = J Public Health. 2005;39(4):523-9.
16. Jelliffe DB. Evaluación del estado de nutrición de la comunidad. Geneva: Organización Mun-dial de La Salud (Monograph Series, 53); 1968.
17. Frisancho AR. Anthropometric standards for the assessment of growth and nutritional status. Ann Arbor: University of Michigan Press; 1993.
18. Dean AG, Dean JA, Coulombier D, et al. Epi Info, Version 6,0. Atlanta: Centers for Disease Control and Prevention; 1995.
19. SPSS Inc. SPSS (Statistical Package for Social Science) for windows [computer software]. Release 7.0. Chicago; 1996.
20. World Health Organization. Child Growth standards. The WHO child growth standards. Do-cumentation. Available from: http://www.who.int/childgrowth/standards/en. Accessed in 2009 (Aug 7).
21. WHO Multicentre Growth Reference Study Group. Enrolment and baseline characteristics in the WHO Multicentre Growth Reference Study. Acta Paediatr Suppl. 2006;450:7-15. 22. WHO Multicentre Growth Reference Study Group. Breastfeeding in the WHO Multicentre
Growth Reference Study. Acta Paediatr Suppl. 2006;450:16-26.
23. Radcliffe B, Payne JE, Porteous H, Johnston SG. “Failure to thrive” or failure to use the right growth chart? Med J Aust. 2007;186(12):660-1.
24. Menezes RCE, Osório MM. Consumo energético-protéico e estado nutricional de crianças menores de cinco anos, no estado de Pernambuco, Brasil [Energy and protein intake and nutritional status of children under ive years of age in Pernambuco state, Brazil]. Rev Nutr. 2007;20(4):337-47.
25. Siqueira RS, Monteiro CA. Amamentação na infância e obesidade na idade escolar em famílias de alto nível socioeconômico [Breastfeeding and obesity in school-age children from families of high socioeconomic status]. Rev Saúde Pública = J Public Health. 2007; 41(1):5-12.
26. Longo GZ, Souza JMP, Souza SB, Szarfac SC. Crescimento de crianças até seis meses de idade, segundo categorias de aleitamento [Growth of children up to six months of age and breast feeding practices]. Rev Bras Saúde Matern Infant. 2005;5(1):109-18.
27. Spyrides MHC, Struchiner CJ, Barbosa MTS, Kac G. Efeito da duração da amamentação predominante no crescimento infantil: um estudo prospectivo com modelos não lineares de efeitos mistos [Effect of predominant breastfeeding duration on infant growth: prospective study using nonlinear mixed effect models]. J Pediatr (Rio J). 2008;84(3):237-43. 28. Zeferino AMB, Barros Filho AA, Bettiol H, Barbieri MA. Acompanhamento do crescimento
[Monitoring growth]. J Pediatr (Rio J). 2003;79 (Supl 1):S23-S32.
29. Monteiro CA, Conde WL. Tendência secular da desnutrição e da obesidade na infância na cidade de São Paulo (1974-1996) [Secular trends in malnutrition and obesity among chil-dren in S. Paulo city, Brazil (1974-1996)]. Rev Saúde Pública = J Public Health. 2000;34 (6 Supl):52-61.
30. Monteiro CA, Conde WL. Tendência secular do crescimento pós-natal na cidade de São Pau-lo (1974-1996) [Secular trends in postnatal growth in S. PauPau-lo city, Brazil (1974-1996)]. Rev Saúde Pública = J Public Health. 2000;34(6 Suppl):41-51.
31. Brasil. Ministério do Planejamento, Orçamento e Gestão. Instituto Brasileiro de Geograia e Estatística. Pesquisa de Orçamentos Familiares 2002-2003. Antropometria e análise do estado nutricional de crianças e adolescentes no Brasil. Available from: http://www.ibge. gov.br/home/estatistica/populacao/condicaodevida/pof/2003medidas/default.shtm. Accessed in 2009 (Aug 7).
age and height/age ratios were under 10%, in relation to breast milk feeding types and socioeconomic strata, thus showing that the children were possibly beneiting from adequate diet and health conditions and were growing similarly to the reference population.
he Family Budget Survey (Pesquisa de Orçamentos Familiares,
POF, 2004),31 which was carried out by the IBGE between 2002 and
2003, showed that the median weight and length for two-year-old chil-dren were 12.1 kg and 12.6 kg for weight and 87.7 cm and 88.9 cm for length, for girls and boys respectively. he results for the population of Campinas were 12.24 kg and 87 cm for girls, and 13.00 kg and 89 cm for boys. his shows that the infants living in this municipality are growing similarly to what is found for the whole country.
CONCLUSIONS
Factors such as the availability of data and surveys, and the num-ber of children evaluated, made it possible to ind out about the an-thropometric situation, duration of breastfeeding and social conditions of young infants living in Campinas, São Paulo, Brazil. Modernization of the society and increased maternal schooling levels and income lev-els were positive factors for children’s nutritional status. he maternal schooling and breastfeeding levels probably made the largest contribu-tions towards this situation, which despite being far from the recom-mendations, is better than the Brazilian average. he data conirmed that this country is undergoing a nutritional transition, with decreas-ing undernutrition. On the other hand, obesity was found to be occur-ring early, at the beginning of childhood, among the infants living in Campinas. he study showed that the BMI of a notable proportion of the infants was above reference percentile 97, thus illustrating the trend toward obesity. However, in general, these infants presented a satisfac-tory nutritional status in comparison with infants living in other places in Brazil.
REFERENCES
1. Onis M, Victora CG. Gráicos de crescimento para bebês alimentados com leite materno [Growth charts for breastfed babies]. J Pediatr (Rio J). 2004;80(2):85-7.
2. World Health Organization. WHO. Global database on child growth and malnutrition. Gene-va: World Health Organization; 1997. Available from: http://whqlibdoc.who.int/HQ/1997/ WHO_NUT_97.4.pdf. Accessed in 2009 (Aug 7).
3. Brasil. Ministério da Saúde. Vigilância alimentar e nutricional — SISVAN. Orientações bá-sicas para a coleta, o processamento, a análise de dados e a informação em serviços de saúde. Brasília: Ministério da Saúde; 2004. Available from: http://bvsms.saude.gov.br/ bvs/publicacoes/orientacoes_basicas_sisvan.pdf. Accessed in 2009 (Aug 7). 4. Soares NT. Um novo referencial antropométrico de crescimento: signiicados e
implica-ções [A new growth anthropometric reference: meanings and implications]. Rev Nutr. 2003,16(1):93-104.
5. Brasil. Ministério da Saúde. Indicadores de morbidade e fatores de risco. D.19 Taxa de prevalência de aleitamento materno. Avaliable from: http://tabnet.datasus.gov.br/cgi/ idb2007/d19.htm. Accessed in 2009 (Sep 3).
6. Monteiro CA, Benício MHDA, Pino Zuñiga HP, Szarfac SC. Estudo das condições de saúde das crianças do município de São Paulo, SP (Brasil), 1984-1985. II. Antropometria nutricio-nal [Health conditions of chindren of the municipality of Säo Paulo, SP (Brazil), 1984-1985: II. Nutritional anthropometry]. Rev Saúde Pública. 1986;20(6):446-53.
7. Who Technical Report Series. Physical status: the use and interpretation of anthropometry. Report of a WHO Expert Committee. Geneva: World Health Organization; 1995. Available from: http://whqlibdoc.who.int/trs/WHO_TRS_854.pdf. Accessed in 2009 (Aug 7). 8. Telles RK, Barros Filho AA. O uso da antropometria como método de avaliação da
Place where the paper was presented: This paper was prepared from the PhD thesis “Prevalence of Breastfeeding, Complementary Introduction of Foods and Growth in Children under Two Years of Age in Campinas, São Paulo”, 2007, 149 p. – Bernardi, JLD – Universidade Estadual de Campinas (Unicamp)
Sources of funding: Fundação de Amparo à Pesquisa do Estado de São Paulo (Fapesp – Grant no. 03/01755-3)
Conlict of interest: None
Date of irst submission: November 25, 2008
Last received: September 3, 2009
Accepted: September 11, 2009
Address for correspondence:
Antônio de Azevedo Barros Filho
Universidade Estadual de Campinas (Unicamp) Departamento de Pediatria
Rua Tessália Vieira de Camargo, 126
Barão Geraldo — Cidade Universitária Zeferino Vaz Caixa Postal no 6.111
Campinas (SP) — Brasil CEP 13083-887