Rev Saúde Pública 2005;39(3) www.fsp.usp.br/rsp
Emission of aldehydes from light duty diesel
vehicles
Rui de Abrantesa, João V de Assunçãob e Edegar Yoshio Hiraia
aLaboratório de veículos.Companhia de Tecnologia de Saneamento Ambiental (Cetesb). São Paulo, SP,
Brasil. bDepartamento de Saúde Ambiental. Faculdade de Saúde Pública. Universidade de São Paulo.
São Paulo, SP, Brasil
Correspondence to: Rui de Abrantes
Av. Prof. Frederico Hermann Jr., 345 Pinheiros 05459-900 São Paulo, SP, Brasil
E-mail: [email protected]
Based on a Master's dissertation presented at the Faculdade de Saúde Pública da Universidade de São Paulo, 2002. Received on 2/3/2004. Reviewed on 10/9/2004. Approved on 9/11/2004.
Keywords
Hazardous substances. Aldehydes. Acetaldehyde. Formaldehyde. Vehicle emissions. Air pollution.
Abstract
Objective
To characterize acetaldehyde and formaldehyde emissions, which are harmful gases to human health and not yet regulated for diesel engines.
Methods
Standardized tests were performed in four diesel light duty commercial vehicles, using a frame dynamometer and test procedure FTP-75. The pollutants were analyzed by high performance liquid chromatography.
Results
Results have shown acetaldehyde emission ranged from 5.9 to 45.4 mg/km, and formaldehyde emission from 16.5 to 115.2 mg/km. The average emission for aldehyde sum was 58.7 mg/km, ranging from 22.4 to 160.6 mg/km. The proportion between the two substances remained constant, close to 74% for formaldehydes and 26% for acetaldehydes.
Conclusions
The emission of diesel vehicle aldehydes was significant when compared with actual spark ignition vehicle emissions, or with the foresee limit for Otto cycle vehicles in Brazilian legislation. Establishing emission limits for these substances also in diesel vehicles is imperative in the light of the vehicle fleet growth, toxicity of these compounds, and their contribution as precursors in ozone gas formation reactions in low troposphere.
INTRODUCTION
In the metropolitan region of São Paulo (MRSP) fleet of automotive vehicles, 5.9% were powered by diesel fuel in 2002. However, its relative share in mobile source emission was 83% of nitrogen oxides (NOx), 53% of sulphur oxides (SOx), and 77% of particulate matter (PM), not considering the share due to tyre wear emis-sions and 18.4% of total hydrocarbon rate.5
Depending on the increase of van use in public, school, and small delivery service transport, among others, MRSP diesel-powered light commercial vehi-cle fleet has had an expressive growth of 5.7% per year, a rate much higher than the last ten-year growth
average of the world’s vehicle fleet, of 2.6% per year.4
The emission of some diesel vehicle pollutants (total hydrocarbons, nitrogen oxides, sulphur oxides, particulate matter, among others) has already been regu-lated in Brazil. Despite that, this high growth rate, asso-ciated with epidemiological study results, causes new concerns with respect to the population’s health due to aldehyde exposure. This is because the law limits the emission of these pollutants only for spark-ignition ve-hicles, i.e., gasoline, alcohol, or gas-powered vehicles).7
respira-Rev Saúde Pública 2005;39(3) www.fsp.usp.br/rsp
Emission of aldehydes from vehicles Abrantes R et al
vans and one pick-up were submitted to standard-ized tests using a Clayton frame dynamometer, model ECE-50, in Cetesb’s Vehicle Emission Laboratory. This dynamometer has the capability of simulating vehicle use conditions on the road. Table 1 displays the main characteristics of vehicles used in the study.
Each vehicle was submitted to two tests. All vehi-cles were tested in accordance with the Brazilian Standard ABNT/NBR 6601/01 which driving cycle is identical to the American test procedure USEPA FTP-75.11 This standardized test procedure simulates
urban driving conditions. It is divided into three phases: cold, stabilization, and hot phase. Vehicle fuel consumption was also measured, in accordance with
Standard ABNT/NBR 7024.3
Vehicle adjustment and fuel consumption are two variables that can interfere with the results of a vehi-cle test; that is why test standards specify the use of a standardized fuel in order to reduce dispersion. This is mainly attained in vehicle homologation tests, when the aim is an exclusive assessment of the vehi-cle, which requires fuel repeatability.
It was sought to know the actual pollutant amount discharged by vehicles in use, including all the vari-ability that a non-standardized fuel or non-previously adjusted vehicles could generate. For that, commer-cial diesel fuel was used in the study instead of stand-ardized diesel fuel. All vehicles were tested with no previous adjustment in order to assess the effective aldehyde amount emitted into the atmosphere.
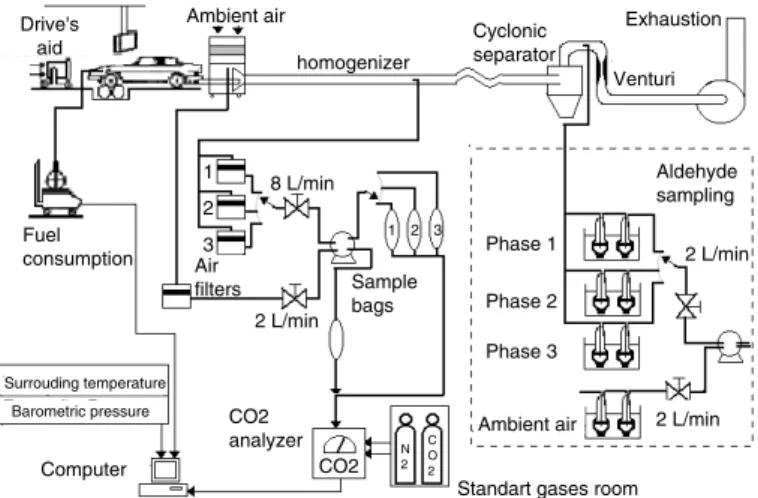
Figure 1 shows the sampling apparatus. After being mixed and homogenized with ambient air, samples were collected in accordance with CFR 40 method directions.11 A constant volume sampler per critical
venturi (Horiba CVS-CFV, model 20A), together with a total dilution tunnel, was used. This dilution tunnel comprised a stainless steel duct with a diameter that would create a turbulent flow to homogenize dis-charges with environmental air mixing.
An ambient air-mixing chamber was also used, re-ceiving dilution air previously filtered by two parti-cle filters, and one filter for organic compounds (hy-drocarbons). This chamber was positioned as close as tory tract irritation due to formaldehyde exposure.
Additionally they can cause potential harm to flora, including potherbs, and fauna, especially uni-cellular organisms that are relatively sensitive to formaldehydes.12,13
Aldehydes can be involved in chemical reactions in the atmosphere, generating other compounds. Among them the photochemical smog formation that mostly produces oxidizing gases, especially gas ozone. Besides causing respiratory conditions to hu-man beings, oxidizing gases can also damage materi-als, mainly rubbers.12
High gas ozone concentrations have been a reason for warning in many urban centers, especially MRSP, which has presented frequent violations to the air quality standard for this pollutant, as detected in
many measuring stations.5
Sporadic measurements of the atmosphere in the municipality of Sao Paulo by the Environmental Cleaning Technology Company (Cetesb) in 1997 have showed maximum levels of 40 parts per billion
(ppb) of acetaldehyde and 77 ppb of formaldehyde.5
These levels are not very different from those
ob-tained by Montero et al8 who in 1999 found
maxi-mum levels of 56.6 ppb of acetaldehyde and 46.6 ppb of formaldehyde. The World Health
Organiza-tion (WHO)14 recommends a limit level of 86.5 ppb
of formaldehyde for 30 minutes as maximum expo-sure time for the population.
The purpose of the present study was to identify and quantify two of the main aldehydes discharged by die-sel cycle light commercial vehicles. In addition, to compare their results with average Otto cycle vehicle discharges and with the limits established in the Bra-zilian legislation for spark-ignition vehicles.
The present study is intended to provide input for aldehyde emission regulation and public health pro-tection in Brazil.
METHODS
Four diesel cycle light commercial vehicles, three
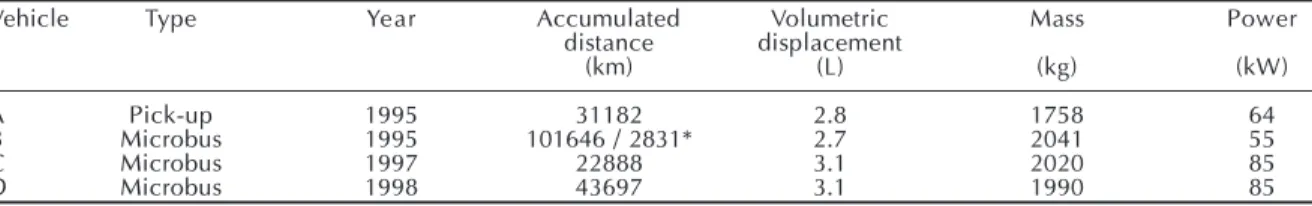
Table 1 - Characteristics of vehicles tested.
Vehicle Type Year Accumulated Volumetric Mass Power
distance displacement
(km) (L) (kg) (kW)
A Pick-up 1995 31182 2.8 1758 64
B Microbus 1995 101646 / 2831* 2.7 2041 55
C Microbus 1997 22888 3.1 2020 85
D Microbus 1998 43697 3.1 1990 85
!
Rev Saúde Pública 2005;39(3) www.fsp.usp.br/rsp
Emission of aldehydes from vehicles Abrantes R et al
possible to the vehicles in order to prevent water condensation in the sampling system.
As shown in Figure 1, the sampling point was positioned downstream of the cyclonic separator, in the center, facing upstream. A diluted portion of the discharge gas was bub-bled into gas washing flasks containing an absorbent solution, at a flow rate of two liters per minute, in accordance with directions of
the ABNT/NBR 12026 method.1
In order to obtain the actual vehicle emis-sions, each phase of the test had an assem-blage of two gas washing flasks in series and ambient air collecting had an assemblage of two flasks in series to subtract the ambient concentration from the total measured. These
procedures comprised a total of eight flasks, placed in a sink containing chilled water (temperature rang-ing from 2ºC to 6ºC). The ambient air samplrang-ing point was located close to the aldehyde sampler.
Each gas-washing flask contained 25 mL of an alde-hyde absorption solution, so that any aldealde-hyde in the discharge gas would generate carbonylic derivatives.
The absorption solution was prepared in the fol-lowing proportion: 150 mg of 2.4 dinitrophenylhy-drazine (purity equal to 99%, CAS 119-26-6) per liter of acetonitrile (high-performance liquid chromato-graph – HPLC –, purity higher over 99.9%, CAS 75-05-8), and added five drops of a perchloric acid solu-tion (170 ml of perchloric acid – 70% PA, formula
HClO4, CAS 7601-90-3 – per each distilled and
deionized water liter). The samples were injected on the same day of their sampling.
Gases, after filtering, were collected in inert plastic bags (tedlar) for quantification of carbon dioxide (CO2).
The method used to determine carbonylic deriva-tive concentrations was based on the proportionality of the areas under standard and sample chromato-graphic peaks. Carbonylic derivatives were separated, identified, and quantified in a HPLC with a visible ultraviolet (UV/VIS) detector.
A Waters pump model 6000A and a Jasco UV/VIS detector model UV-970, 365 nm wavelength, equipped the HPLC. A reverse-phase octadecylsilane (ODS) col-umn (C-18, 25 cm x 4.6 ID x 5 mm) was used with isocratic mobile phase containing 65% acetonitrile and 35% distilled water, at a flow rate of 1 mL/min.
In order to determine aldehyde linearity range, a
stock solution was prepared by dissolving the stand-ard of formaldehyde (99% purity, CAS 1081-15-8), and acetaldehyde (99% purity, CAS 1019-57-4) in acetonitrile with further homogenization. From this solution, five different dilutions were prepared and five injections of each solution were performed. Us-ing linear regression, each aldehyde linearity stripe was determined, adopting the criterion of correlation coefficient (r2) greater or equal to 0.9999.
Acetaldehyde linearity stripe ranged from 20.20 to 1,010 µg/L and its greatest standard deviation in the
calibration curve was 0.01436 µg/L. Formaldehyde
linearity stripe, however, ranged from 19.86 to 993 µg/L and its greatest standard deviation in the
cali-bration curve was 0.02057 µg/L.
Aldehyde detection limit was determined by adopting threefold the standard deviation obtained relatively to the minimum measurement;
acetalde-hyde level was 0.30 µg/L and formaldehyde level
was 0.67 µg/L.
Aldehyde quantification limit was determined by adopting tenfold the standard deviation obtained relatively to the minimum measurement;
acetalde-hyde level was 1.00 µg/L and formaldehyde level
was 2.23 µg/L.
As a calibration daily standard one of the stock solution dilutions was used and its concentration was as close as possible to the samples’ concentrations.
RESULTS
Table 2 displays the results of all tests performed. All tested vehicle acetaldehyde emission ranged from 5.9 up to 45.4 mg/km and formaldehyde emissions ranged from 16.5 up to 115.2 mg/km. Both aldehydes
Figure 1 - Vehicle test diagram, displaying collection points for aldehyde and carbonic gas samples.
Drive's aid
Ambient air
homogenizer
Fuel
consumption Air
filters
2 L/min
Surrouding temperature
Computer
Barometric pressure CO2
analyzer CO2
C O 2 N 2 Sample bags 8 L/min 1
2
3 Phase 1
Phase 2
Phase 3 Cyclonic separator
Exhaustion
Venturi
Aldehyde sampling
2 L/min 2 L/min
Ambient air
Standart gases room
" Rev Saúde Pública 2005;39(3) www.fsp.usp.br/rsp
Emission of aldehydes from vehicles Abrantes R et al
sum varied from 22.4 to 160.6 mg/km, while alde-hyde sum emission relatively to fuel consumption varied from 151.0 to 1,406.4 mg/L.
DISCUSSION
Comparing vehicle B’s urban* autonomy averages before and after engine reconditioning, they were 6.6 km/L for the two first tests before reconditioning and 6.7 km/L for the two tests after it. A practically inex-pressive improvement of almost 2% was found. Never-theless, the average aldehyde emission sum changed from 34.9% to 69.2 mg/km, a practically 100% in-crease. This unexpected value indicates the need for further evaluation, since a low pollutant emission is normally anticipated in well-regulated engines.
Though according to Turns,10 formaldehyde
genera-tion can be explained by methane or propane (ob-tained from combustion breakdown) stoichiometric oxidation with air under high temperatures,
generating O, H, and OH radicals that attack methane and propane.
Sjogren9 has studied emission of two
die-sel engines with several proportions of air/ fuel and has found values that ranged from
6.2 to 128 mg/kmfor acetaldehyde and from
4.8 to 258 mg/km for formaldehyde. These results show a wider range and maximum val-ues that are more than double of those ob-tained in the present study. However, these differences can be explained by differences found in the bus cycle, altering the pollutant emission profile, and of several air/fuel pro-portions; this provide fuel or oxygen in ex-cess for an adequate combustion.
Since 1992, Brazilian legislation, through the Ve-hicle Air Pollution Control Program (Proconve), has set an aldehyde sum emission limit of 150 mg/km for new Otto-cycle light passenger vehicles. In 1997, this limit was reduced to 30 mg/km, i.e., a reduction of 80%. In 1998, this program has set the same limit of 30 mg/km for new Otto-cycle light commercial vehi-cles (with a test weight up to 1,700 kg) and an emis-sion limit of 60 mg/km (for vehicles with a test weight greater than 1,700 kg).7
As of 2009 aldehyde emission limit has been an-ticipated to be 20 mg/km for the same categories of the vehicles with a test weight below or equal to 1,700 kg and 40 mg/km for vehicles with test weight greater than 1,700 kg. However, no inclusion has been an-ticipated for diesel cycle vehicle aldehyde emission.6
When compared with actual emissions of light spark
Figure 2 - Formaldehyde and acetaldehyde emission of the 10 tests performed, by run km, vehicle, and test. Comparison between PROCONVE limits in 1992 and 2009.
Acetaldehyde
Formaldehyde
Commercial light spark ignition vehicle emission limit
1992
2009 180
160
140
120
100
80
60
40
20
0
mg/km
Vehicle A 1
st
test
Vehicle A 2
nd
test
Vehicle B 1
st
test
Vehicle B 2
nd
test
Vehicle B 4
th
test
Vehicle C 2
nd
test
Vehicle C 1
st
test
Vehicle B 3
rd
test
Vehicle D 1
st
test
Vehicle D 2
nd
test
*Urban autonomy is inversely proportional to urban consumption, according to NBR 7024 (ABNT,2 1990).
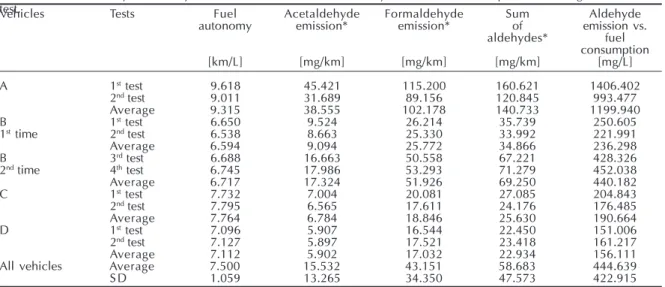
Table 2 - Fuel autonomy and aldehyde emission in the vehicles tested (by km and fuel consumption) according to vehicle and test.
Vehicles Tests Fuel Acetaldehyde Formaldehyde Sum Aldehyde
autonomy emission* emission* of emission vs. aldehydes* fuel
consumption
[km/L] [mg/km] [mg/km] [mg/km] [mg/L]
A 1st test 9.618 45.421 115.200 160.621 1406.402
2nd test 9.011 31.689 89.156 120.845 993.477
Average 9.315 38.555 102.178 140.733 1199.940
B 1st test 6.650 9.524 26.214 35.739 250.605
1st time 2nd test 6.538 8.663 25.330 33.992 221.991
Average 6.594 9.094 25.772 34.866 236.298
B 3rd test 6.688 16.663 50.558 67.221 428.326
2nd time 4th test 6.745 17.986 53.293 71.279 452.038
Average 6.717 17.324 51.926 69.250 440.182
C 1st test 7.732 7.004 20.081 27.085 204.843
2nd test 7.795 6.565 17.611 24.176 176.485
Average 7.764 6.784 18.846 25.630 190.664
D 1st test 7.096 5.907 16.544 22.450 151.006
2nd test 7.127 5.897 17.521 23.418 161.217
Average 7.112 5.902 17.032 22.934 156.111
All vehicles Average 7.500 15.532 43.151 58.683 444.639
S D 1.059 13.265 34.350 47.573 422.915
SD: standard deviation
#
Rev Saúde Pública 2005;39(3) www.fsp.usp.br/rsp
Emission of aldehydes from vehicles Abrantes R et al
ignition vehicles manufactured in 1995, die-sel vehicle produce more aldehydes than gasoline ones and have the same magnitude as those of alcohol vehicles, given the emis-sion average factor of 25 mg/km for gasoline
vehicles and 42 mg/km for alcohol vehicles.5
In early Proconve implementation years, diesel vehicle aldehyde emission was consid-ered insignificant, for their emission was much lower when compared with same category Otto-cycle vehicles. However, as seen in Figure 2, two of the four tested vehicles have violated the spark ignition limit, that is, 60 mg/km; one after its engine had been rectified and the other with 31,000 original km. The other two vehicles emitted on average approximately 46% of the limit already established for same category spark ignition vehicles.
In Brazil, no studies have been carried out aiming at determining deterioration factors related to die-sel vehicle aldehyde emission, seen as highly im-portant, for it is necessary to have a better knowl-edge of the profile of these compound emissions to the atmosphere.
The results suggest that, in some cases, diesel vehi-cles of the tested category emit much more aldehydes than spark ignition vehicles. The latter have already been equipped with catalytic converters, which sig-nificantly reduce these pollutant emissions.
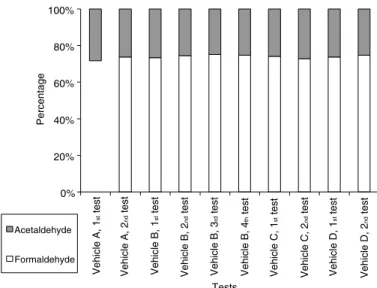
Though aldehyde sum emission differences were significant from one vehicle to another – by analy-sis of variance (ANOVA), one can confirm that alde-hyde emission average was different among vehi-cles (F*=28>Fc**=6.6). The proportion between acetaldehyde and formaldehyde remained practi-cally the same in the ten tests performed, for it was around 74% of formaldehyde and 26% of acetalde-hyde, as shown in Figure 3.
Figure 3 - Acetaldehyde and formaldehyde emission share (%), by vehicle tested and test.
0% 20% 40% 60% 80% 100%
Vehicle A, 1
st
test
Vehicle A, 2
nd
test
Vehicle B, 1
st
test
Vehicle B, 2
nd
test
Vehicle B, 3
rd
test
Vehicle B, 4
th
test
Vehicle C, 1
st
test
Vehicle C, 2
nd
test
Vehicle D, 1
st
test
Vehicle D, 2
nd
test
Tests
Percentage
Acetaldehyde
Formaldehyde
*F: Factor calculated in ANOVA test. **Fc: Critical factor in ANOVA test.
Performing studies with larger samples would be relevant, including the carrying out tests in motor dynamometers and in other vehicle categories in or-der to describe the in-use diesel vehicle fleet alde-hyde emission profile, evaluate the deterioration fac-tor of these vehicles as well as create an invenfac-tory of these pollutants emissions.
As a conclusion, the present study shows diesel vehicle aldehyde emission is significant and im-portant and defining an emission limit for these sub-stances, as for spark ignition vehicles, is also neces-sary for these vehicles. Brazilian legislation restric-tion for spark ignirestric-tion vehicles with regards to alde-hyde emissions showed to be effective and resulted in environmental improvements, especially with the use of catalytic converters. Its relevance is stressed considering diesel vehicle fleet growth, added to the fact that aldehydes pose risks to human health, contribute to an increase in biota morbidity and mor-tality rates, besides being significantly involved in ozone formation photochemical reactions in low troposphere.
REFERENCES
1. Associação Brasileira de Normas Técnicas [ABNT]. NBR 12026: veículos rodoviários automotores leves: determinação da emissão de aldeídos e cetonas contidas no gás de escapamento, por cromatografia líquida Método DNPH. Rio de Janeiro; 1997. p. 10.
$ Rev Saúde Pública 2005;39(3) www.fsp.usp.br/rsp
Emission of aldehydes from vehicles Abrantes R et al
3. Associação Brasileira de Normas Técnicas [ABNT]. NBR 7024, de 1989: veículos rodoviários automotores leves: medição do consumo de combustível. Rio de Janeiro; 1990. p. 9.
4. Associação Nacional dos Fabricantes de Veículos Automotores [Anfavea]. Anuário estatístico da indústria automobilística brasileira 2000 [relatório on-line]. Disponível em: URL: http://
www.anfavea.com.br/Index.html [27 mai 2003]
5. Companhia de Tecnologia de Saneamento Ambiental [Cetesb]. Relatório de qualidade do ar no Estado de São Paulo 2001. São Paulo; 2002. p. 130.
6. Conselho Nacional de Meio Ambiente [CONAMA]. Resolução n. 315, de 29 out 2002: Dispõe sobre as novas etapas do Programa de Controle de Poluição do Ar por veículos Automotores [Proconve]. Brasília (DF): Diário Oficial da União; 15 mar 2002.
7. Instituto Brasileiro do Meio Ambiente e dos Recur-sos Naturais Renováveis [Ibama]. Programa de controle da poluição do ar por veículos automoto-res (Proconve). 2º ed. Brasília (DF); 1998. p. 181. [Coleção Meio Ambiente. Série Diretrizes - Gestão ambiental, 2]
8. Montero L, Vasconcellos PC, Souza SR, Pires MA, Coyllo ORS, Andrade MF et al. Measurements of atmospheric carboxylic acids and carbonyl compounds in São Paulo city, Brazil. Environ Sci
Technol 2001;35:3071-81.
9. Sjögren M, Li H, Rannug U, Westerholm R. Multivariate analysis of exaust emissions from heavy-duty diesel fuels. Environ Sci Technol
1996;30:38-49.
10. Turns SR. An introduction to combustion: concepts and aplications. New York: McGraw-Hill; 1996. p. 128-49.
11. United States of America. Code Federal Regulations. CFR 40 part 86 sub part B. Emission regulations for 1977 and later model year new light-duty vehicles and new light-duty trucks; test procedures. Available from URL: http://
www.access.gpo.gov/nara/cfr/waisidx_99/ 40cfr86_99.html [2000 Apr 12]
12. World Health Organization (WHO). Acetaldehyde. Geneva; 1995. [International Programme on Chemical: Safety Environmental Health Criteria, 167]
13. World Health Organization (WHO). Formaldehyde. Geneva; 1989. [International Programme on Chemical Safety: Environmental Health Criteria, 89]