Food Science and Technology ISSN 0101-2061
DI:
D http://dx.doi.org/10.1590/1678-457X.25416
1 Introduction
High fructose corn syrup (HFCS) is a corn-based sweetener that is used in various food and beverages. Compared with other sugars, the lower price and easier handling of HFCS has made it the first choice for food and beverage companies which produce beverages, baked goods, canned products, jams and jellies, confectioneries and dairy products (Hanover & White, 1993; Park & Yetley, 1993). HFCS is also extremely resistant to microbial spoilage and requires less storage space compared to an equivalent amount of solid sweeteners (Hanover & White, 1993).
A sufficient consumption of fruit and vegetable is recommended for human diet (Slavin & Lloyd, 2012). USDA’s Food Guide Pyramid (United States Department of Agriculture, 2005) recommends 2-4 servings of fruit and 3-5 servings of vegetables daily. Dptimizing the use of fruits and vegetables in different product formats, such as processed juice, provides more options to the consumers. Consumption of fruit juice, which is cheap and easy to access throughout the year, helps to fulfill the recommended amount of fruits and vegetables. Fruit juices, as well as fruits, contain many essential nutrients, such
as vitamins, minerals, carotenoids, flavonoids and dietary fiber, which are important and integral part of a healthy diet and are highly recommended for their nutritional content, their phytochemical value and the presence of health-promoting compounds (Khandpur & Gogate, 2015).
Dbesity is a health problem worldwide, including in Turkey. According to a National Statistical Institute Health Survey (National Statistical Institute, 2012), more than one third of Turkish adults (34.8%) were defined as overweight, and 17.2% were considered to be obese. Many studies have reported an incremental increase in energy intake over the past several decades, which is believed to be one of the most important underlying reasons of obesity (Nielsen & Popkin, 2004; Harnack et al., 2000; Gibson & Shirreffs, 2013). High consumption of sugar-sweetened beverages is considered to contribute to increased weight gain, increased energy intake and development of diabetes mellitus (Hernández-Cordero et al., 2015). Some authors have noted that excess sugar intake from soft drinks is the main problem (Melanson et al., 2008), and furthermore some others have reported
Effects of long-term consumption of high fructose corn syrup containing
peach nectar on body weight gain in sprague dawley rats
Gulsah DZCAN SINIR1, Senem SUNA1, Sevda INAN2, Deniz BAGDAS3, Canan Ece TAMER1,
Dmer Utku CDPUR1*, Deniz SIGIRLI4, Emre SARANDDL4, Gursel SDNMEZ2, Ilker ERCAN4,
Turkkan EVRENSEL5, Dmer Faruk TARIM6, Erdal EREN6, Vildan UYLASER1, Bige INCEDAYI1
Received 23 Sept., 2016 Accepted 23 Oct., 2016
1 Department of Food Engineering, Faculty of Agriculture, Uludag University, Görükle, Bursa, Turkey 2 Department of Pathology, Faculty of Veterinary Medicine, Uludag University, Görükle, Bursa, Turkey
3 Experimental Animals Breeding and Research Center, Faculty of Medicine, Uludag University, Görükle, Bursa, Turkey 4 Department of Biostatistic, Faculty of Medicine, Uludag University, Görükle, Bursa, Turkey
5 Department of Medical Oncology, Faculty of Medicine, Uludag University, Görükle, Bursa, Turkey 6 Department of Paediatric Endocrinology, Faculty of Medicine, Uludag University, Görükle, Bursa, Turkey
*Corresponding author: [email protected] Abstract
High fructose corn syrup (HFCS) is one of the most used sweeteners in the food industry. Health concerns regarding the consumption of HFCS-containing foods have developed in parallel with the increasing amount of people who become overweight. This study was conducted to investigate whether HFCS-containing peach nectar (pn-HFCS) consumption has more detrimental effects on anthropometrical and biochemical parameters compared with sucrose-containing peach nectar (pn-sucrose). Fifty-day-old Sprague Dawley rats were divided into three groups and were fed (A) pn-HFCS + ad libitum chow, (B) pn-sucrose + ad libitum chow and (C) only ad libitum chow for 7 months. The percentage change in body weight (PCBW), body mass index (BMI), and Lee index were calculated, and serum triglyceride, glucose, insulin and leptin concentrations were measured. The PCBW, BMI, Lee index, serum triglyceride, glucose, insulin and leptin concentrations were insignificant among the three groups. We can suggest that peach nectar consumption resulted in more energy intake than the control and since pn-HFCS group consumed more chow than the pn-sucrose group. The results show that long term daily HFCS or sucrose consumption in peach nectar is not associated with weight gain and does not stimulate metabolic changes in Sprague Dawley rats.
Keywords: HFCS; weight gain; insulin; leptin; BMI; peach nectar.
a connection between HFCS intake and obesity (Bray et al., 2004; Elliott et al., 2002). It was suggested that diet containing high-fructose cause hypertriglyceridemia, hyperinsulinemia, insulin resistance, impair glucose tolerance and increased body weight (BW) (Stanhope et al., 2015; Voznesenskaya & Tordoff, 2015; Johnson et al., 2007). There is a hypothesis that fructose consumption could promote weight gain because it does not stimulate insulin secretion or leptin production which may result in disturbances of satiety (Havel, 2005; Bocarsly et al., 2010).
According to the Dietary Guidelines for Americans, the calorie allowance from added sugars and sweeteners should not exceed 10% of the total caloric intake; however, American’s actual consumption was around 11 to 17% at different ages (United States Department of Agriculture, 2015) and sweetened soft drinks constitute 7% of the total energy intake (Gibson & Shirreffs, 2013; Kit et al., 2013). Several short-term in vivo studies (Light et al., 2009; Bocarsly et al., 2010, Babacanoğlu et al., 2013) investigated the effect of HFCS solution consumption (8-20%) on obesity related parameters, and those yielded conflicting results. Since HFCS is common in several food products other than beverages, people are faced with chronic fructose consumption; so further studies are needed to inquire about any long-term consequences of HFCS intake on health. Accordingly, this study was conducted to examine long-term (7 months) peach nectar containing HFCS (pn-HFCS) and peach nectar containing sucrose (pn-sucrose) consumption on weight gain and related anthropometrical and biochemical parameters in Sprague-Dawley rats.
2 Materials and methods 2.1 Materials
For this study, fifty-day-old male Sprague–Dawley rats were provided from the Experimental Animals Breeding and Research Center, Uludag University, Medical Faculty, Bursa, Turkey. Rats were housed individually in conventional cages in a temperature- and humidity-controlled room (21 ± 2 °C, 50 ± 5%) under a 12-h light/dark cycle with free access to chow, peach nectar and water. The animals were cared for in accordance with the “Guide to the Care and Use of Experimental Animals” and all procedures were approved by the Local Ethics Committee for Animal Experiments, Uludag University (2011-05/11).
2.2 Experimental model
Male rats (55-150 g, n = 41 / group) were fed either (A) peach nectar containing HFCS (pn-HFCS) and chow, (B) peach nectar containing sucrose (pn-sucrose) and chow or (C) chow only for 7 months. Rats were sampled to groups systematically. The peach nectar and chow were provided to the rats ad libitum for 24 hours. Peach nectar consumption was measured daily, and chow consumption was measured weekly at the same time period (09:00 to 10:00 a.m.). In this study, HFCS-55 was chosen because of its common and suitable usage in the food industry. HFCS-55 was obtained from a private ingredient provider company and its specifications were 76.5-77.5% dry solids, 3.5-4.5 pH and 55% min. fructose. According to Turkish Juice Industry Association (Meyve Suyu Endüstrisi Derneği, 2011) peach nectar is the most preferred fruit nectar in Turkey. According
to consumer’s choice, peach nectar was preferred as a material and formulations were determined based on preliminary tests in this study. The peach nectar was produced in a commercial fruit juice company in Bursa. Peach nectars, which aseptically filled 1L water-soluble dry matter (Association of Analytical Communities, 1980), fat (International Drganization for Standardization, 2009), carbohydrate (Food and Agriculture Drganization of the United Nations, 1998) and protein (Association of Analytical Communities, 2000b) contents, titratable acidity (Association of Analytical Communities, 2000a), ascorbic acid level (Association of Analytical Communities, 1991), fructose content (Association of Analytical Communities, 1979), total phenolic matter (Zhang & Hamauzu, 2004) and antioxidant activity (2,2-diphenyl-1-picrylhydrazyl - DPPH) (Zhang & Hamauzu, 2004) were analyzed and energy (Food and Agriculture Drganization of the United Nations, 2003) values of nectars were calculated. Standard rodent chow (2800 kcal/kg) and tap water were provided to all groups. Body weight (BW) changes were also measured weekly.
2.3 Anthropometrical and biochemical parameters
The abdominal circumference (AC) (anterior to the hindfoot), thoracic circumference (under the foreleg), and body length (BL) (nose-to-anus) were measured in all rats at the end of 7 months. All measurements and surgical procedures were performed under 2.5-3.5% sevoflurane (Abbott Lab., IL, USA) inhaled anesthesia.
The BW and BL were used to determine the body mass index (BMI) and Lee index, which are anthropometrical parameters for the evaluation of obesity. The parameters were calculated as follows:
Body mass index (BMI) = body weight (g) / length2 (cm2); and
Lee index = cube root of body weight (g) / nose-to-anus length (cm) (Bernardis, 1970).
Blood samples were collected by cardiocentesis into serum tubes. The samples were centrifuged at 4000 rpm for 5 min. Serum samples were frozen and stored at −80 °C until analyses were performed.
Serum glucose and triglyceride concentrations were measured (n = 10) using an autoanalyzer (Aeroset System Abbott, Abbott Laboratories, Diagnostic Division, IL, USA). Serum insulin and leptin concentrations were measured (n = 10) with a commercially available ELISA kit (Merck Millipore Corporation, Billerica, MA, USA), following the manufacturer’s protocol. Systematic sampling was used to identify 10 rats in each group to assess the biochemical parameters.
Unilateral body fat pads were collected from the hepatic, abdominal and gonadal regions after cardiocentesis and weighed individually.
2.4 Statistical analysis
U-test was used for comparing two groups after the Kruskal Wallis test was performed, in cases in which significances was determined. The Mann-Whitney U-test was used for comparing the continuous variables not meeting normality assumption. Continuous variables were presented as the median (of the minimum and maximum values). Correlations between the variables were examined with Pearson, Spearman and partial correlation coefficients. The significance level was set to α = 0.05. Statistical analyses were performed with IBM SPSS Statistics version 21.0 (IBM Corp., NY, USA).
3 Results and discussion
3.1 Composition of peach nectar, consumption of peach nectar and chow and PCBW
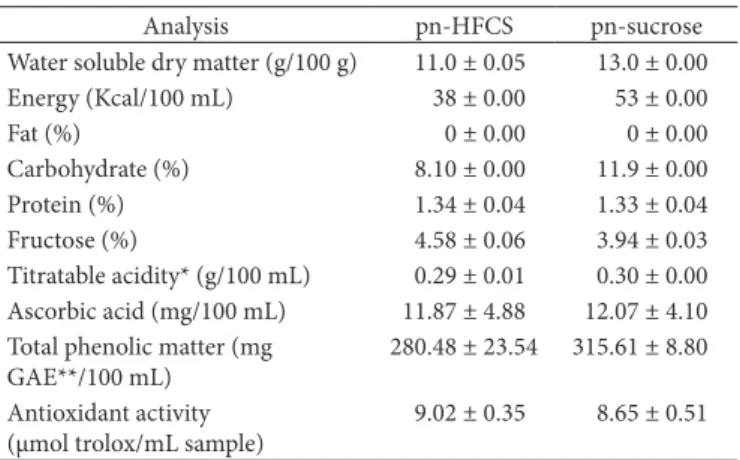
The results of physicochemical analyses of the peach nectars were presented as the mean value ± standard deviation in Table 1. Since the fructose content of the pn-HFCS (4.58 ± 0.06%) was higher than the pn-sucrose (3.94 ± 0.03%), fructose intake of the pn-HFCS group was higher (p < 0.05) than the pn-sucrose group (Figure 1) during the study.
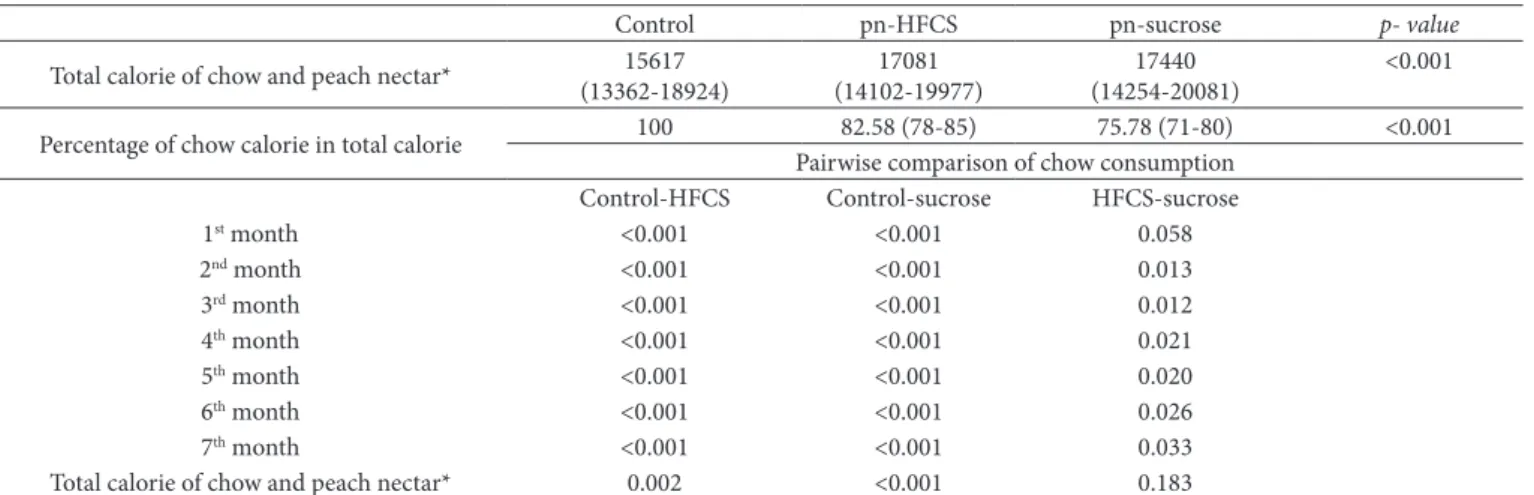
There were significant differences in total chow consumption (Figure 2) and total caloric (chow + peach nectar) intake (Table 2) among the study groups. When the groups were compared pairwise in terms of total caloric intake (chow + peach nectar), significant differences were observed between the control and pn-HFCS groups and the control and pn-sucrose groups (Table 2). Light et al. (2009) investigated the effects of drinking different caloric beverages sweetened with 13% (w/v) glucose, sucrose, fructose, and HFCS-55 on the development of adiposity and metabolic disorders in female rats over a period of 8 weeks. Similar with our results, Light et al. (2009) found significant difference in total energy intake in control group versus study groups, but there were no significant differences in total energy intake among the sucrose, HFCS-55 and fructose consuming study groups during 8 weeks.
The control group, which was fed with chow, showed the largest amount of chow consumption, followed by the pn-HFCS group and the pn-sucrose group (Figure 2). Similar to our results, Light et al. (2009) reported that rats in the control group obtained
the most calories from solid food compared with HFCS and sucrose groups. According to these data, we can assume that rats consuming caloric sweetener reduce caloric intake from solid food.
There was no overall difference in peach nectar consumption between the rats fed pn-HFCS and pn-sucrose (Figure 3). Related to higher energy content of pn-sucrose (Table 1), rats fed pn-sucrose obtained higher energy than did the pn-HFCS
Figure 1. HFCS amount in peach nectars over the 7 months (p < 0.05).
Values were presented as median.
Table 1. Results of the physicochemical analysis of the peach nectar.
Analysis pn-HFCS pn-sucrose
Water soluble dry matter (g/100 g) 11.0 ± 0.05 13.0 ± 0.00 Energy (Kcal/100 mL) 38 ± 0.00 53 ± 0.00
Fat (%) 0 ± 0.00 0 ± 0.00
Carbohydrate (%) 8.10 ± 0.00 11.9 ± 0.00
Protein (%) 1.34 ± 0.04 1.33 ± 0.04
Fructose (%) 4.58 ± 0.06 3.94 ± 0.03
Titratable acidity* (g/100 mL) 0.29 ± 0.01 0.30 ± 0.00 Ascorbic acid (mg/100 mL) 11.87 ± 4.88 12.07 ± 4.10 Total phenolic matter (mg
GAE**/100 mL)
280.48 ± 23.54 315.61 ± 8.80
Antioxidant activity (μmol trolox/mL sample)
9.02 ± 0.35 8.65 ± 0.51
Values were presented as median ± standard deviation. * citric acid; ** gallic acid equivalent.
Figure 2. Cumulative chow consumption over the 7 months (p < 0.05).
Values were presented as median.
Figure 3. Cumulative peach nectar consumption over 7 months
group from peach nectar. In line with our results, Light et al. (2009) found that rats consuming sucrose (13% w/v) obtained more calories compared with those that consumed HFCS-55 or fructose solutions.
In the present study, there were significant differences among the groups in pairwise comparison of total chow consumption for all measurements performed throughout the 7 months, except for the first month data of the pn-HFCS and pn-sucrose groups (Table 2). Pn-HFCS and pn-sucrose groups obtained most of their energy (82.58% and 75.78%, respectively) from chow, but as mentioned above, they consumed significantly less chow than the control group. Taking total energy intake into consideration, we can assume that peach nectar consumption resulted in more energy intake than the control group. This increment in energy intake might be related to the palatable sweet taste of peach nectar or its effects on metabolism or satiety. However, it is not clear why pn-HFCS group consumed more chow than the pn-sucrose group; it is possible that fructose consumption had more stimulating effect on appetite compared with the sucrose.
Although the peach nectar-consuming groups of the present study obtained higher energy than did the control group, there were no significant differences in the PCBW among the groups during and at the end of 7 months (Figure 4). Babacanoğlu et al. (2013) investigated the effects of 10% HFCS and 20% HFCS-containing solution consumption in rats over a period of 12 weeks and in another study Lowndes et al. (2014) compared the consumption of sucrose or HFCS-sweetened (10% and 20%) low-fat milk at the recommended daily caloric intake for 10 weeks. Similar to our results, both of those authors reported that the consumption of solutions or milk had no effect on the PCBW among the groups compared to control. In another study, Light et al. (2009) investigated the effects of drinking different caloric beverages sweetened with 13% (w/v) glucose, sucrose, fructose, and HFCS-55 on the development of adiposity and metabolic disorders in female rats over a period of 8 weeks. The HFCS-55 group showed a higher final BW compared with the glucose and control groups (p = 0.02), but there were no significant differences observed among the HFCS-55, sucrose and fructose groups. The results of Light et al. (2009) are partly comparable to our findings. However, Bocarsly et al. (2010)
reported an increased BW in the rats consuming HFCS solution (8% v/v) compared with the sucrose (10% v/v) consuming rats both in 8 weeks and 6 months studies.
3.2 Biochemical parameters
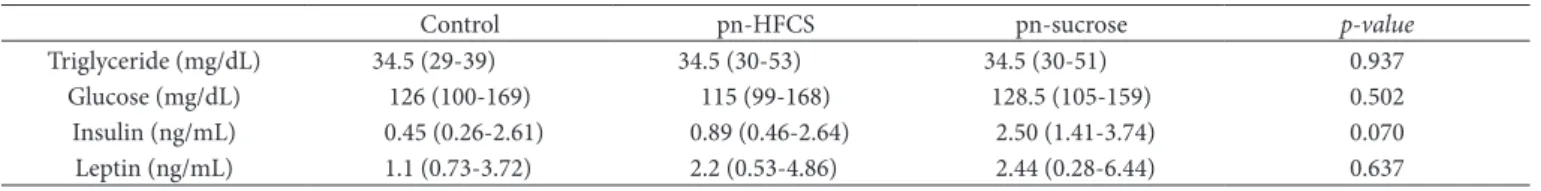
In this study, the concentrations of triglycerides, glucose, insulin and leptin did not differ among the three groups at the end of 7th month (Table 3). Similar to our study, several authors did not find any difference in blood glucose, triglyceride and insulin levels or abdominal adiposity between the groups in their studies (Light et al., 2009; Bocarsly et al., 2010; Iida et al., 2013; Lowndes et al., 2014).
Babacanoğlu et al. (2013) found that plasma glucose, insulin and triglyceride concentrations increased following the consumption of 10% and 20% HFCS-containing solutions for a period of 12 weeks. Alzamendi et al. (2009) reported that the consumption of 10% fructose-containing feeding caused increases in plasma leptin level and abdominal adipose tissue in male rats compared with the control group. Shapiro et al. (2008) observed that chronic fructose consumption in the form of 60% fructose contained diet caused leptin resistance prior to increases in BW, adiposity, serum leptin in male rats.
Figure 4. Cumulative percentage changes of body weight (PCBW) from
baseline over the 7 months (p > 0.05). Values were presented as median.
Table 2. Total calories with pairwise comparison of three groups.
Control pn-HFCS pn-sucrose p- value
Total calorie of chow and peach nectar* 15617 (13362-18924)
17081 (14102-19977)
17440 (14254-20081)
<0.001
Percentage of chow calorie in total calorie 100 82.58 (78-85) 75.78 (71-80) <0.001 Pairwise comparison of chow consumption
Control-HFCS Control-sucrose HFCS-sucrose
1st month <0.001 <0.001 0.058
2nd month <0.001 <0.001 0.013
3rd month <0.001 <0.001 0.012
4th month <0.001 <0.001 0.021
5th month <0.001 <0.001 0.020
6th month <0.001 <0.001 0.026
7th month <0.001 <0.001 0.033
Total calorie of chow and peach nectar* 0.002 <0.001 0.183
In a study conducted on human subjects, researchers compared the metabolic effects of HFCS and sucrose on the twenty-fourth hour after the consumption of an 11% w/w (weight/weight) sugar solution mixed with carbonated water. In that study, the glucose, insulin and leptin concentrations did not significantly differ between the individuals who consumed fructose or sucrose-sweetened beverages with meals (Stanhope et al., 2008). In another study, the consumption of high fructose containing beverages (30%) with meals had lead to a reduction in insulin and leptin in women at the end of a twenty-four hour period, compared to the consumption of the same amount of glucose-containing beverages with meals (Teff et al., 2004).
3.3 Anthropometrical parameters
Body weight gain alone is not sufficient to define obesity. For this reason, criteria, such as the BMI, Lee index, TC and AC are used. In this study, there were no significant differences among the study groups in terms of the BMI and Lee index (Table 4). Novelli et al. (2007) fed male Wistar rats with a sucrose solution, high-carbohydrate diet or control diet for 30 days and compared Lee index and BMI among the groups. They found no difference in Lee index, which ranged from 0.29 to 0.33, among the study groups. In another study, Engelbregt et al. (2001) investigated the body composition of pubertal male rats and reported the BMI of a normal rat as 0.53 g/cm2. Novelli et al. (2007) stated that the BMI of normal adult rats ranges from 0.45 to 0.68 g/cm2. According to assumption of Novelli et al. (2007), the rats in our study with the BMI of 0.68 g/cm2 were accepted as borderline for obesity (Table 4). The differences between BMI and Lee index were not significant among the groups. The HFCS group
showed a significantly larger AC than the control group. There were no significant differences in TC or BL among the groups. The ratio of AC to TC was higher in both the HFCS and sucrose groups compared with the control group (Table 4). However, Novelli et al. (2007) found a higher AC to TC ratio in the sucrose group compared with the HFCS and control groups.
Also in our study, leptin concentration and Lee index were found to be correlated in the control (p = 0.028) and pn-HFCS groups (p = 0.016), but there was no correlation found between leptin concentration and BMI. Maffei et al. (1995) have reported a strong correlation between the plasma leptin concentration and BMI in rodents and humans. Heden et al. (2014) found that daily consumption of 355 mL HFCS-sweetened regular soda did not significantly alter BW, insulin secretion, glucose, lipid, or cholesterol responses in either normal weight or obese individuals.
There were no significant differences in the weights of the hepatic, abdominal and gonadal fat pads among the groups (Table 4). Iida et al. (2013) investigated the tissue accumulation of fat in rats fed corn starch, HFCS or rare sugar syrups (RSS) which contain D-psicose and D-allose. They found that the weight of mesenteric, perirenal and epididymal fat did not differ between the starch and HFCS groups, but they observed significant difference between the HFCS and RSS groups. Bravo et al. (2013) investigated the effect that adding the most often consumed fructose- and glucose-containing sugars to a daily diet had on liver fat content and intramuscular adipose tissue. Sixty-four individuals, men and women, aged 20 to 60, consumed low-fat milk sweetened (8%, 18% and 30%) with either high-fructose corn syrup (HFCS) or sucrose for 10 weeks. Computed tomography
Table 3. Biochemical measurements in serum at the end of 7th month.
Control pn-HFCS pn-sucrose p-value
Triglyceride (mg/dL) 34.5 (29-39) 34.5 (30-53) 34.5 (30-51) 0.937
Glucose (mg/dL) 126 (100-169) 115 (99-168) 128.5 (105-159) 0.502
Insulin (ng/mL) 0.45 (0.26-2.61) 0.89 (0.46-2.64) 2.50 (1.41-3.74) 0.070
Leptin (ng/mL) 1.1 (0.73-3.72) 2.2 (0.53-4.86) 2.44 (0.28-6.44) 0.637
Values were presented as median (minimum value -maximum value).
Table 4. Anthropometrical parameters and pairwise comparison of three groups.
Control pn-HFCS pn-sucrose p- value
BMI 0.68 (0.60-0.82) 0.67 (0.60-0.82) 0.68 (0.57-0.80) 0.594
Lee Index 0.30 (0.29-0.32) 0.30 (0.29-0.32) 0.30 (0.28-0.31) 0.205
AC (cm) 16.95 (13-20) 17.80 (13-23) 17.50 (14-23) 0.015
TC (cm) 14.50 (12-16) 14.30 (12-18) 14.40 (12-18) 0.786
BL (cm) 24.50 (23-27) 25 (22-27) 24.80 (23-27) 0.243
AC/TC 1.18 (1.03-1.35) 1.23 (1.05-1.42) 1.24 (1.05-1.39) <0.001
Hepatic fat (g) 10.73 (6.60-12.56) 10.74 (7.42-13.92) 10.09 (8.21-15.74) 0.991 Abdominal fat (g) 2.69 (0.96-7.43) 3.36 (0.83-7.29) 4.79 (0.89-13.38) 0.725 Gonadal fat (g) 1.55 (0.21-2.15) 1.81 (0.57-5.27) 2.80 (0.52-7.80) 0.523
Pairwise Comparison
Control-HFCS Control-sucrose HFCS-sucrose
AC 0.003 0.061 0.575
AC/TC <0.001 0.033 0.153
imaging was used for fat content determination of the liver and magnetic resonance imaging was used to find the fat content of muscle. There were no significant differences identified in the fat content of the liver, vastus lateralis muscle or gluteus maximus muscle between the study groups. These results showed that fructose consumption as a part of daily diet did not promote fat storage either in the liver or in muscles.
4 Conclusion
The chronic consumption of pn-HFCS or pn-sucrose did not cause significant differences in PCBW or anthropometrical parameters except AC and AC/TC in both of the peach nectar-consuming groups. The concentrations of glucose, insulin, leptin and triglycerides did not significantly change after the consumption of both peach nectars.
The results of the present study suggest that long term daily HFCS or sucrose consumption in peach nectar is not associated with weight gain and does not stimulate metabolic changes (PCBW, BMI, Lee index, serum triglyceride, glucose, insulin and leptin concentrations) in Sprague Dawley rats.
Acknowledgements
This research was supported by Uludag University Scientific Research Project No: UAP(Z)2011/65. All authors critically reviewed the content and have approved the final version of manuscript. The authors had no conflicts of interest.
References
Alzamendi, A., Giovambattista, A., Raschia, A., Madrid, V., Gaillard, R. C., Rebolledo, D., Gagliardino, E. S., & Spinedi, E. (2009). Fructose-rich diet-induced abdominal adipose tissue endocrine dysfunction in normal male rats. Endocrine, 35(2), 227-232. PMid:19165636. http://dx.doi.org/10.1007/s12020-008-9143-1.
Association of Analytical Communities – ADAC. (1979). Saccharides
(major) in corn syrup: liquid chromatographic method: 979.23.
Rockville: ADAC International.
Association of Analytical Communities – ADAC. (1980). Solids (soluble)
in fruits and fruit products: 932.12. Rockville: ADAC International.
Association of Analytical Communities – ADAC. (1991). Ascorbic
acid in vitamin preparations and juices: 967.21. Rockville: ADAC
International.
Association of Analytical Communities – ADAC. (2000a). Acidity
(titratable) of fruit products: 942.15. Rockville: ADAC International.
Association of Analytical Communities – ADAC. (2000b). Protein
(crude) in animal feed: 990.03. Rockville: ADAC International.
Babacanoğlu, C., Yildirim, N., Sadi, G., Pektas, M. B., & Akar, F. (2013). Resveratrol prevents high-fructose corn syrup-induced vascular insulin resistance and dysfunction in rats. Food and Chemical
Toxicology, 60, 160-167. PMid:23872130. http://dx.doi.org/10.1016/j.
fct.2013.07.026.
Bernardis, L. L. (1970). Prediction of carcass fat, water and lean body mass from Lee’s nutritive ratio in rats with hypothalamic obesity.
Journal of Experiential Education, 26(7), 789-790. PMid:4914444.
http://dx.doi.org/10.1007/BF02232553.
Bocarsly, M. E., Powell, E. S., Avena, N. M., & Hoebel, B. G. (2010). High-fructose corn syrup causes characteristics of obesity in rats:
Increased body weight, body fat and triglyceride levels. Pharmacology,
Biochemistry, and Behavior, 97(1), 101-106. PMid:20219526. http://
dx.doi.org/10.1016/j.pbb.2010.02.012.
Bravo, S., Lowndes, J., Sinnett, S., Yu, Z., & Rippe, J. (2013). Consumption of sucrose and high-fructose corn syrup does not increase liver fat or ectopic fat deposition in muscles. Applied Physiology, Nutrition,
and Metabolism, 38(6), 681-688. PMid:23724887. http://dx.doi.
org/10.1139/apnm-2012-0322.
Bray, G. A., Nielsen, S. J., & Popkin, B. M. (2004). Consumption of high-fructose corn syrup in beverages may play a role in the epidemic of obesity. The American Journal of Clinical Nutrition, 79(4), 537-543. PMid:15051594.
Elliott, S. S., Keim, N. L., Stern, J. S., Teff, K., & Havel, P. J. (2002). Fructose, weight gain, and the insulin resistance syndrome. The
American Journal of Clinical Nutrition, 76(5), 911-922. PMid:12399260.
Engelbregt, M. J. T., van Weissenbruch, M. M., Popp-Snijders, C., Lips, P., & Delemarre van de Waal, H. A. (2001). Body mass index, body composition, and leptin at onset of puberty in male and female rats after intrauterine growth retardation and after early postnatal food restriction. Pediatric Research, 50(4), 474-478. PMid:11568290. http://dx.doi.org/10.1203/00006450-200110000-00009.
International Drganization for Standardization – ISD. (2009). EN ISO
659: determination of oil content (Reference method). London: ISD.
Retrieved from http://www.iso.org/iso/iso_catalogue/catalogue_tc/ catalogue_detail.htm?csnumber=43169
Food and Agriculture Drganization of the United Nations – FAD. (1998). Carbohydrates in human nutrition. Rome: FAD. Retrieved from http://www.fao.org/docrep/w8079e/w8079e00.htm
Food and Agriculture Drganization of the United Nations – FAD. (2003). Food energy: methods of analysis and conversion factors. Rome: FAD. Retrieved from http://www.fao.org/uploads/media/ FAD_2003_Food_Energy_02.pdf
Gibson, S., & Shirreffs, S. M. (2013). Beverage consumption habits “24/7” among British adults: association with total water intake and energy intake. Nutrition Journal, 12(1), 19. PMid:23305461. http:// dx.doi.org/10.1186/1475-2891-12-9.
Hanover, L. M., & White, J. S. (1993). Manufacturing, composition, and applications of fructose. The American Journal of Clinical Nutrition, 58(5, Suppl), 724-732. PMid:8213603.
Harnack, L. J., Jeffery, R. W., & Boutelle, K. N. (2000). Temporal trends in energy intake in the United States: an ecologic perspective.
The American Journal of Clinical Nutrition, 71(6), 1478-1484.
PMid:10837288.
Havel, P. J. (2005). Dietary fructose: implications for dysregulation of energy homeostasis and lipid/carbohydrate metabolism.
Nutrition Reviews, 63(5), 133-157. PMid:15971409. http://dx.doi.
org/10.1111/j.1753-4887.2005.tb00132.x.
Heden, T. D., Liu, Y., Kearney, M. L., & Kanaley, J. A. (2014). Weight classification does not influence the short-term endocrine or metabolic effects of high-fructose corn syrup-sweetened beverages.
Applied Physiology, Nutrition, and Metabolism, 39(5), 544-552.
PMid:24766236. http://dx.doi.org/10.1139/apnm-2013-0407. Hernández-Cordero, S., López-Dlmedo, N., Rodríguez-Ramírez, S.,
Barquera-Cervera, S., Rivera-Dommarco, J., & Popkin, B. (2015). Comparing a 7-day diary vs. 24 h-recall for estimating fluid consumption in overweight and obese Mexican women. BMC
Public Health, 15(1), 1031-1041. PMid:26446676. http://dx.doi.
org/10.1186/s12889-015-2367-0.
Novelli, E. L. B., Diniz, Y. S., Galhardi, C. M., Ebaid, G. M. X., Rodrigues, H. G., Mani, F., Fernandes, A. A. H., Cicogna, A. C., & Novelli Filho, J. L. (2007). Anthropometrical parameters and markers of obesity in rats. Laboratory Animals, 41(1), 111-119. PMid:17234057. http:// dx.doi.org/10.1258/002367707779399518.
Park, Y. K., & Yetley, E. A. (1993). Intakes and food sources of fructose in the United States. The American Journal of Clinical Nutrition, 58(5, suppl), 737-747. PMid:8213605.
Shapiro, A., Mu, W., Roncal, C., Cheng, K. Y., Johnson, R. J., & Scarpace, P. J. (2008). Fructose-induced leptin resistance exacerbates weight gain in response to subsequent high-fat feeding. American Journal
of Physiology. Regulatory, Integrative and Comparative Physiology,
295(5), 1370-1375. PMid:18703413. http://dx.doi.org/10.1152/ ajpregu.00195.2008.
Slavin, J. L., & Lloyd, B. (2012). Health benefits of fruits and vegetables.
Advances in Nutrition, 3(4), 506-516. PMid:22797986. http://dx.doi.
org/10.3945/an.112.002154.
Stanhope, K., Griffen, S. C., Bair, B. R., Swarbrick, M. M., Keim, N. L., & Havel, P. J. (2008). Twenty-four-hour endocrine and metabolic profiles following consumption of high-fructose corn syrup-, sucrose-, fructose-, and glucose-sweetened beverages with meals. The American
Journal of Clinical Nutrition, 87(5), 1194-1203. PMid:18469239.
Stanhope, K. L., Medici, V., Bremer, A. A., Lee, V., Lam, H. D., Nunez, M. V., Chen, G. X., Keim, N. L., & Havel, P. J. (2015). A dose-response study of consuming high-fructose corn syrup–sweetened beverages on lipid/lipoprotein risk factors for cardiovascular disease in young adults. The American Journal of Clinical Nutrition, 101(6), 1144-1154. PMid:25904601. http://dx.doi.org/10.3945/ajcn.114.100461. Teff, K. L., Elliott, S. S., Tschöp, M., Kieffer, T. J., Rader, D., Heiman, M., Townsend, R. R., Keim, N. L., D’alessio, D., & Havel, P. J. (2004). Dietary fructose reduces circulating insulin and leptin, attenuates postprandial suppression of ghrelin, and increases triglycerides in women. The Journal of Clinical Endocrinology and Metabolism, 88(6), 2963-2972. PMid:15181085. http://dx.doi.org/10.1210/jc.2003-031855. United States Department of Agriculture – USDA. (2005). Washington,
DC: USDA. Retrieved from http://www.cnpp.usda.gov/FGP United States Department of Agriculture – USDA. (2015). Washington,
DC: USDA. Retrieved from http://health.gov/dietaryguidelines/2015/ guidelines/chapter-2/a-closer-look-at-current-intakes-and-recommended-shifts/#figure-2-9
Voznesenskaya, A., & Tordoff, M. G. (2015). Low-calcium diet prevents fructose-induced hyperinsulinemia and ameliorates the response to glucose load in rats. Nutrition & Metabolism, 12(1), 12. PMid:26516336. http://dx.doi.org/10.1186/s12986-015-0035-0.
Zhang, D., & Hamauzu, Y. (2004). Phenolics, ascorbic acid, carotenoids and antioxidant activity of broccoli and their changes during conventional and microwave cooking. Food Chemistry, 88(4), 503-509. http://dx.doi.org/10.1016/j.foodchem.2004.01.065.
Potential role of sugar (fructose) in the epidemic of hypertension, obesity and the metabolic syndrome, diabetes, kidney disease, and cardiovascular disease. The American Journal of Clinical Nutrition, 86(4), 899-906. PMid:17921363.
Khandpur, P., & Gogate, P. R. (2015). Effect of novel ultrasound based processing on the nutrition quality of different fruit and vegetable juices. Ultrasonics Sonochemistry, 27, 125-136. PMid:26186829. http://dx.doi.org/10.1016/j.ultsonch.2015.05.008.
Kit, B. K., Fakhouri, T. H. I., Park, S., Nielsen, S. J., & Dgden, C. L. (2013). Trends in sugar-sweetened beverage consumption among youth and adults in the United States: 1999-2010. The American
Journal of Clinical Nutrition, 98(1), 180-188. PMid:23676424. http://
dx.doi.org/10.3945/ajcn.112.057943.
Iida, T., Yamada, T., Hayashi, N., Dkuma, K., Izumori, K., Ishii, R., & Matsuo, T. (2013). Reduction of abdominal fat accumulation in rats by 8-week ingestion of a newly developed sweetener made from high fructose corn syrup. Food Chemistry, 138(2-3), 781-785. PMid:23411176. http://dx.doi.org/10.1016/j.foodchem.2012.11.017. Light, H. R., Tsanzi, E., Gigliotti, J., Morgan, K., & Tou, J. C. (2009). The type of caloric sweetener added to water influences weight gain, fat mass, and reproduction in growing Sprague-Dawley female rats.
Experimental Biology and Medicine, 234(6), 651-661. PMid:19359658.
http://dx.doi.org/10.3181/0812-RM-368.
Lowndes, J., Sinnett, S., Pardo, S., Nguyen, V. T., Melanson, K. J., Yu, Z., Lowther, B. E., & Rippe, J. M. (2014). The effect of normally consumed amounts of sucrose or high fructose corn syrup on lipid profiles, body composition and related parameters in overweight/ obese subjects. Nutrients, 6(3), 1128-1144. PMid:24642950. http:// dx.doi.org/10.3390/nu6031128.
Maffei, M., Halaas, J., Ravussin, E., Pratley, R. E., Lee, G. H., Zhang, Y., Fei, H., Kim, S., Lallone, R., Ranganathan, S., Kern, P. A., & Friedman, J. M. (1995). Leptin levels in human and rodent: Measurement of plasma leptin and ob RNA in obese and weight-reduced subjects.
Nature Medicine, 1(11), 1155-1161. PMid:7584987. http://dx.doi.
org/10.1038/nm1195-1155.
Melanson, K. J., Angelopoulos, T. J., Nguyen, V., Zukley, L., Lowndes, J., & Rippe, J. M. (2008). High-fructose corn syrup, energy intake, and appetite regulation. The American Journal of Clinical Nutrition, 88(6), 1738-1744. PMid:19064539. http://dx.doi.org/10.3945/ ajcn.2008.25825E.
Meyve Suyu Endüstrisi Derneği – MEYED. (2011). Ataşehir: MEYED. Retrieved from http://www.meyed.org.tr/userfiles/file/sektor_ istatistikleri/meyve_suyu_sektoru_raporu___2011.pdf
National Statistical Institute – NSI. (2012). Health survey. Sofia: NSI. Retrieved from http://www.turkstat.gov.tr/Kitap.do?metod=KitapDetay&KT_ ID=1&KITAP_ID=223/