Maria Helena D’Aquino BenícioI,II
Ana Paula Bortoletto MartinsII
Sonia Isoyama VenancioII,III
Aluísio Jardim Dornellas de BarrosIV
I Departamento de Nutrição. Faculdade de Saúde Pública. Universidade de São Paulo. São Paulo, SP, Brasil
II Núcleo de Pesquisas Epidemiológicas em Nutrição e Saúde. Faculdade de Saúde Pública. Universidade de São Paulo. São Paulo, SP, Brasil
III Núcleo de Investigação em Nutrição. Secretaria de Estado da Saúde de São Paulo. Instituto de Saúde. São Paulo, SP, Brasil IV Departamento de Medicina Social.
Faculdade de Medicina. Universidade Federal de Pelotas. Pelotas, RS, Brasil Correspondence:
Maria Helena D’Aquino Benício
Faculdade de Saúde Pública da Universidade de São Paulo
Av. Dr. Arnaldo, 715
01246-904 São Paulo, SP, Brasil E-mail: [email protected] Received: 5/23/2012 Approved: 12/9/2012
Article available from: www.scielo.br/rsp
Estimates of the prevalence of
child malnutrition in Brazilian
municipalities in 2006
ABSTRACT
OBJECTIVE: To estimate the prevalence of malnutrition in children for all Brazilian municipalities.
METHODS: A multilevel logistic regression model was used to estimate the individual probability of malnutrition in 5,507 Brazilian municipalities in 2006, in terms of predictive factors grouped according to hierarchical levels. The response variable was child malnutrition (children aged from six to 59 months with height for age and sex below -2 z-scores, according to the World Health Organization standard). The predictive variables were determinants of malnutrition measured similarly by the National Demographics and Health Survey-2006 and the Sample from the 2000 Demographic Census. At level 1 (individual): sex and age, level 2 (household): socioeconomic variables, water and indoor plumbing, urban or rural area and level 3 (municipal): location of the municipality and coverage of the Family Health Strategy (FHS) in 2006.
RESULTS: The study detected a statistically signifi cant chance of malnutrition in male children, those living in households with two or more individuals per room, those belonging to the lowest quintiles of the socioeconomic score, those with three or more children under fi ve in the household, those with no access to running water or located in the North. There was a negative dose-response association between FHS coverage and the chance of malnutrition (p = 0.007). FHS coverage in the municipality equal to or greater than 70% showed a 45% reduction in the chance of infant malnutrition. Estimates of the prevalence of child malnutrition show that most of the cities have the risk of malnutrition under control, very low or low. Risks of greater magnitude exist only in 158 municipalities in the North Region.
CONCLUSIONS: Childhood malnutrition as a public health problem is concentrated in the cities of the North region, where FHS coverage is lower. A protective effect of FHS in relation to child malnutrition was found in the country as a whole, irrespective of other determinants of the problem.
DESCRIPTORS: Child Nutrition Disorders, epidemiology.
Malnutrition in childhood continues to be a public health problem in developing countries. Growth deficiencies in infancy are associated with higher mortality, repeated infectious diseases, compromised psycho-motor development, less success in education and lower productive capacity in adult life.6,18
National surveys are indispensable in diagnosing the nutritional situation and for drawing up intervention strategies to dace the problem in Brazil. However, these surveys do not allow for estimates to be made at a muni-cipal level due to the organization of their sampling. This makes it diffi cult to identify intra-regional inequa-lities or more serious foci of the problem which call for differentiated interventions. The importance of the availability of municipal estimates on the frequency of childhood malnutrition resides in the fact that the municipality is a primary federal entity for the country’s political organization and for implementing public policies in the social sector.11
The fi rst estimates of the risk of childhood malnutri-tion in Brazilian municipalities were produced using statistical predictive models, developed from the nutrition survey carried out by the Brazilian Institute of Geography and Statistics (IBGE) in 1989 (National Health and Nutrition Survey – PNSN). Estimates were produced for all 4,489 Brazilian municiaplities existing at that time.5 These estimates signifi cantly changed the distribution of federal program resources for combatting malnutrition, reversing the former practice of identical treatment for non-identical situ-ations. The Ministry of Health established the amount of funds transferred to each Brazilian municipality as part of the federal program”Incentives to Combat Nutritional Defi ciencies (ICCN)”, in 1998.a The same estimates were used to calculate the number of quotas allocated to each municipality in the federal “Food Grant” Program.
Estimates of the prevalence of childhood malnutrition were produced for each of the 5,507 Brazilian muni-cipalities in existence on the occasion of the 2000 Demographic Census. The statistical predictive models were developed base on the IBGE national survey carried out in 1996 (National Demographics and Health Survey PNDS, 1996). The estimates of the prevalence of childhood malnutrition were obtained by applying INTRODUCTION
the equation from the fi nal predictive model to the chil-dren studied in more detail by the 2000 Census Sample.b
The PNDS carried out in 2006c made it possible to analyze the evolution of childhood malnutrition in Brazil. Monteiro et al13 (2009) identifi ed that “two thirds of the reduction identifi ed can be attributed to the favorable evolution of four factors studied: 25.7% to the increase in maternal levels of education, 21.7% to families’ increased purchasing power, 11.6% to the expansion in health care and 4.3% to improvements in sanitation”.
The increased access of mothers and children to health care coincides with the expansion of the Family Health Strategy (ESF), the coverage of which increased from 6.6% of the population in 1998 to 46.2% in 2006.d The ESF is a strategy to reorient the care model through multi-disciplinary teams in primary health care units. The Family Health Care as a strategy for structuring the municipal health care systems aims to reorganize the health care model in the Brazilian Unifi ed Health System (SUS) and seeks greater rationalization in the used of the other care levels.16 The focus on establishing the ESF in the poorest and most vulnerable areas contri-butes to the reduction in inequalities in access to health care services in Brazil.4
This study aimed to estimate the risk of childhood malnutrition in Brazilian municipalities.
METHODS
This study was carried out in 5,507 Brazilian munici-palities based on the data from the latest national health and nutrition survey, the PNDS-2006, and the 2000 Census Sample. The method used to estimate the risk of childhood malnutrition in Brazilian municipalities was based on the development of individual statistical predictive models, using multilevel analysis (or hierar-chical models or mixed effect models).9 This analysis was chosen due to the hierarchical organization of the population of children (Level 1) in households (Level 2) and in municipalities (Level 3) and to the existence of intra-group correlation. The models are equations which enable the probability of an illness in a specifi c individual to be estimated, according to the presence of absence of predictive factors organized according to pre-established hierarchical levels.9
a Ministério da Saúde. Portaria nº 2409. Diario Ofi cial Uniao. 23 mar 1998. Estabelece critérios e requisitos para implementação de ações de combate às carências nutricionais nos municípios. Brasília (DF); 27 mar 1998. Seção 1, n 59, p36-62.
b Benicio MHD’A, Venancio SI, Konno SC, Monteiro CA. Novas estimativas para a prevalência de desnutrição na infância nos 5507 municípios brasileiros a partir de modelos logísticos multinível aplicados à Amostra de crianças do Censo 2000. São Paulo; 2005 [cited 2012 Nov 26]. Available from: http://www.fsp.usp.br/nupens/desn_municipios_brasileiros.pdf (Série Pesquisas em Epidemiologia Nutricional do NUPENS/USP, 1).
c Ministério da Saúde. Pesquisa Nacional de Demografi a e Saúde da Criança e da Mulher – PNDS 2006: dimensões do processo reprodutivo e da saúde da criança. Brasília (DF); 2009.
The empirical base was a sample of children aged six to 59 months from the PNDS-2006 and municipal information from a variety of sources was used to construct the predictive models. The PNDS-2006 was carried out between November 2006 and May 2007 by a consortium of Brazilian academic institutions, coordinated by the Brazilian Center of Planning and Analysis (CEBRAP). The anthropometric survey was planned and supervised by the Center for Health and Nutrition Research (NUPENS/USP). The PNDS-2006 process of probabilistic sampling meant the study was nationally representative including both urban and rural areas and all fi ve of Brazil’s geographic macro-regions.7 The survey included 3,931 children aged between six and 60 months resident in 652 Brazilian municipalities.
The response variable for the statistical predictive models was the child’s nutritional state. All children with a Z score of height for age < -2 was considered to be malnourished, according to World Health Organization (WHO) growth standards.20
The predictive variables included in the modelling process at an individual and household level were selected considering the classic model for determining malnutrition19 and the availability and compatibility of the data collected by the PNDS-2006 and the 2000 Census Sample. In Level 1 (individual/child), the following were considered: age (six to 24 months and 24 to 60 months) and sex. The variables in Level 2 (household) were: socio-economic score (level of education of the head of the household and the number of TVs, owning a car, fridge/freezer, DVD/ video cassette player, washing machine, telephone and computer) generated based on analysis of the main components and presented in quintiles;3 number of indi-viduals per room (1, 2 and ≥ 3 individuals); number of children per household (1, 2 and ≥ 3 children); indoor plumbing and whether located in an urban or rural area.
Predictive variables for Level 3 (municipal) were: loca-tion of the municipality (North, Northeast and the rest regrouped into the South-Center);e population size in 2006 (number of inhabitants: up to 15 thousand, 1550 thousand, 50100 thousand and ≥ 100 thousand) and ESF coverage, according to the offi cial indicator used by the Ministry of Health Department of Primary Care (www.siab.datasus.gov.br). This indicator corresponds to the product of the number of family health care teams established by the month of December of each year by the estimated mean number of individuals dealt for each team (3,450 individuals) for each municipality. This
fi gure is identical for all of the Brazilian municipalities
and was constant throughout 2000 and 2006. The offi cial ESF indicator estimates its potential coverage, as it estimates the strategies user population. With the consolidation of the establishment of the ESF from 2000 onwards, the indicator came to be an increasingly good estimate of effective ESF coverage, providing data which was progressively more consistent with the percentage of the population registered by the health care workers and the percentage of families cared for by the ESF.1
Uni-variate analysis was carried out before modeling took place. All of the predictive variables were included in the multiple analysis as they are traditionally linked with malnutrition and poverty in the literature.19 A multi-level logistical regression model was used for the iterative generalized least squares procedure.9,f The modelling was carried out in stages: age and sex of the child (Level 1) were introduced in the fi rst stage; variables at the household level were incorporated one by one, followed by the municipal level (Level 3). The statistical signifi cance of each parameter included in the model was evaluated using the Wald test, obtained from the ratio of maximum likelihood estimates for parameter β1, in relation to estimates for its standard error. Interactions of interest, such as ESF – region and ESF – socioeco-nomic score were tested one by one in a multiple model containing statistically signifi cant parameters.
The overall predictive capacity of the fi nal model was assessed by the ROC curve. Its predictive capacity was reaffi rmed by comparisons between the prevalence of malnutrition estimated by the model and that detected directly by PNFS-2006 in the North, Northeast and Center-South regions using the Chi-squared test, as recommended by Hosmer & Lemeshow10 (1989).
The estimates of the prevalence of childhood malnutri-tion for each municipality were obtained by applying the equation from the fi nal model to the database referring to the children (n = 1,809,744) included in the 2000 Census Sample. The questionnaire used in the households which formed part of this sample provided information on socioeconomic variables measured in a similar way to those used in the PNDS-2006.c The planning the Census 2000 Sample guaranteed the repre-sentation of the population of each Brazilian munici-pality through systematic sampling within each census tract. The sampling fraction was 10% in municipalities with populations estimated to be over 15 thousand, and 20% in the others.g
Applying the equation from the fi nal model to the 2000 Census Sample allowed the individual probability of
e The North and Northeast have different socio-economic conditions and access to public services. The Southeast, South and Midwest were regrouped due to the fact that they are similar with regards the distribution of the predictive variables and the association between each of them and malnutrition.
f Young TK. MLwiN. Macros for advanced multilevel modeling. London: Institute of Education; 1999.
malnutrition for each of the children studied in the 2000 Census Sample to be estimated. The prevalence of malnutrition in each municipality in 2000 was esti-mated by the mean of the individual probabilities of the children resident in that municipality and expresses the mean risk of malnutrition in the municipality. Factor correction was used to estimate the municipal preva-lence in 2006 (ratio between estimated prevapreva-lence in 2000 and that detected directly by the PNDS 2006 in each region). The prevalence for each municipality were shown on a map, categorized into six levels of risk according to the WHO criteria;21 under control (prevalence < 5%), very low (between 5% and 7.5%), low (between 7.5% and 10%), medium (between 10% and 15%), high-medium (between 15% and 20%) and high (≥ 20%).
The data were processed using Stata 10 software, consi-dering the complex sample structure in the case of the PNDS-2006 using the”svy” command. The weighting recommended by the IBGE was used in the Census Sample. The multi-level analysis was carried out using MLwiN 2.16 software. The level of signifi cance adopted for the analysis was 0.05. A cutoff level of 0.10 was adopted to test the interactions. TabWin 3.5,h software with the Municipal Digital Mesh, Brazil 2005 was used to create the map, with a scale of 1:250,000.
This study analyzes secondary data from the PNDS 2006, approved by the Research Ethics Committee of the of the Sao Paulo State Department of Health (Protocol CEP no 185/05).
RESULTS
The percentage of children who live in households with three or more children aged under fi ve (5%) or without indoor plumbing (14%) was low. The majority of the children live in urban areas and more than half in municipalities with populations between 100 thousand and one million residents. Around 40% of the children lived in municipalities with Family Health Strategy (ESF) coverage > 50%. The explanatory variables were strongly linked to the risk of malnutrition, except living in an urban or rural area and ESF coverage, although these were incorporated into the multiple analysis even so (Table 1).
The chance of malnutrition showed statistically signi-cant increases in male children, those who lived in households with two or more individuals per room and those in household not connected to the public water supply with indoor plumbing. The variable socioe-conomic score in quintiles proved to have a negative dose-response curve relationship with the outcome. The number of children under fi ve years old in the household
proved to have a positive dose-response curve rela-tionship with childhood malnutrition (Table 2).
Children living in the Northeast had a similar chance of malnutrition as those living in the Center-South region; those who lived in the North had a higher chance of malnutrition. ESF coverage provided a positive dose-response protective effect with relation to the outcome (p of the trend = 0.007).
Children living in municipalities with ESF coverage between 15% and 30% had a 385 reduction in the chance of childhood malnutrition, compared with those who lived in municipalities with coverage between 0% and 15%. Municipal coverage between 30% and 50% reduced the chance by 40%, climbing to 48% reduced chance in municipalities with coverage between 50% and 70%. Above this level the reduction in chance was 45% (Table 2).
Interactions between ESF coverage, region and malnu-trition and between ESF coverage, socioeconomic score and the response variable were not statistically signifi cant (data not shown).
The values predicted by the model were reliable estimates of the individual probability of suffering childhood malnutrition for each of the possible combi-nations of the predictive variables, with a minimum value of 0.021 and a maximum of 0.431 (data not shown in the tables).
The overall predictive capacity of the fi nal model, evaluated by the ROC curve, showed that the proba-bility of a malnourished child being identifi ed as such by the model was higher than that of child who was not malnourished (area beneath the curve was equal to 0.85; 95%CI 0.83;0.88), which gave the model good overall predictive capacity (Figure 1).
The reliability of the estimates produced by the
fi nal model were reaffi rmed by the evidence that the predicted prevalence of malnutrition for the North (13.2%), Northeast (6.6%) and Center-South (6.1%) were close to those observed directly based on the PNDS -2006: 14.5%, 5.8% and 5.9%, respectively (p = 0.174 for the Chi-squared test).
In the period in question (2000 to 2006) there was a signifi cant reduction (p < 0.001) in the frequency of adverse conditions for all of the determinants consi-dered. Half of the children studied in 2000 were living in households with socioeconomic scores correspon-ding to the fi rst quintile of distribution of the score in the PNDS-2006 and only 10% lived in households with socio-economic scores in the highest quintile. Between 2000 and 2006 the percentage of children living in
Table 1. Prevalence of childhood malnutrition in children aged six to 59 months according to the factors of the study. Brazil, 2006.
Variable n of children
(n = 3,931) %
Prevalence of
malnutrition (%) p
Individual Level
Age (months) 0.014
6 |- 24 1,290 33.6 10.0
24 |- 60 2,641 66.4 6.0
Sex 0.012
Male 2,020 52.6 8.8
Female 1,911 47.4 5.8
Household Level
Socioeconomic score 0.006
1 Quintile 794 21.6 9.5
2 Quintile 644 18.4 10.0
3 Quintile 694 20.0 6.7
4 Quintile 706 20.2 4.3
5 Quintile 562 19.8 2.8
Number of individuals per room < 0.001
< 2 3,410 92.5 6.6
2 or more 521 7.5 17.4
Household with indoor plumbing < 0.001
Yes 3,192 86.5 6.4
No 737 13.6 15.5
Number of children under fi ve in the household 0.001
1 2,281 67.3 5.6
2 1,228 27.5 10.7
3 or more 422 5.2 12.7
Location of child’s household 0.540
Urban 1,383 80.9 8.1
Rural 2,548 19.1 7.2
Municipal Level
Region in which the child’s household is located < 0.001
North 881 10.8 16.1
Northeast 769 27.3 6.4
Centre-South 788 41.8 6.2
Percentage of ESF coverage (%) - 2006 0.383
0 |-15 685 18.6 8.0
15 |- 30 722 22.0 4.5
30 |- 50 686 18.3 8.2
50 |- 70 537 12.9 8.9
70 1,301 28.2 7.9
Population - 2006 0.002
< 15 thousand 751 12.3 8.7
15 |- 50 thousand 1,012 24.3 7.3
50 |- 100 thousand 502 10.4 14.8
100 |- 1 million 1,022 33.9 6.7
Over 1 million 644 19.1 3.7
households with ≥ 2 per room or not connected to the public water supply (with indoor plumbing) was reduced by half (Table 3).
The estimates of municipal prevalence of malnutri-tion for the 2000 set of Brazilian municipalities were obtained by applying the equation from the fi nal predic-tive model to the 2000 Census Sample. To obtain these estimates for 2006, factor correction corresponding to the ratio between estimated prevalence and that detected directly by the PNDS-2006 was used. The
results confi rm the heterogeneity of the distribution of the frequency of childhood malnutrition risk in Brazil. The interval of variation went from municipalities in which the risk of malnutrition was around 3% (2.8% in Santa Tereza in the state of Rio Grande do Sul and 3.7% in the municipality of Sao Caetano, Sao Paulo state) to those in which the frequency reached 29.0% (Jordão in the state of Acre).
The Brazilian municipalities were grouped in catego-ries, according to the estimated percentage of children
Table 2. Odds ratio of malnutrition in children aged six to 59 months adjusted by the fi nal multilevel model. Brazil, 2006.
Variable OR 95%CI p (global)
Individual Level
Age (months) 0.126
6 |- 24 1.23 0.94;1.62
24 |- 60 1 −
Sex 0.038
Male 1.32 1.02;1.72
Female 1 −
Household Level
Socioeconomic scoreb 0.003a
1 Quintile 1.76 1.16;2.65
2 Quintile 1.90 1.29;2.82
3 Quintile 1.41 0.94;2.12
4 Quintile 1 −
Number of individuals per room 0.020
< 2 1 −
2 or more 1.57 1.07;2.29
Household with indoor plumbing 0.041
Yes 1 −
No 1.44 1.01;2.04
Number of children under fi ve in the household < 0.001a
1 1
2 1.68 1.25;2.26
3 or more 2.21 1.46;3.04
Municipal Level
Region in which the child’s household is located 0.037
North 1.48 1.05;2.09
Northeast 0.91 0.61;1.38
Centre-South 1 −
Percentage of ESF coverage (%) - 2006 0.007a
0 |-15 1
15 |-30 0.62 0.40;0.96
30 |-50 0.60 0.38;0.94
50 |-70 0.52 0.32;0.85
70 0.55 0.37;0.81
a P value of the trend.
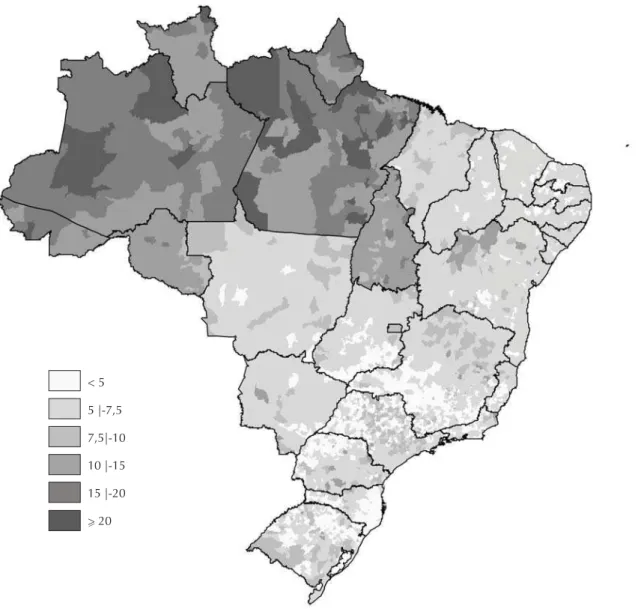
between six and 59 months with growth defi ciency. Around 25% of Brazilian municipalities were found to have the situation under control and more than half had a very low risk of childhood nutrition (57.1%). The proportions of Brazilian municipalities in the situation of medium, high medium and high risk of malnutrition were 5.6%, 2.0% and 0.9% respectively. The map of the country (Figure 2) was created to show the spatial distribution of childhood malnutrition risk in Brazil. The areas with municipalities in which the risk of malnutrition was under control are light colored. Progressively darker tones were used to color the areas in which the risk is very low, low, medium, high medium and high.
The majority of situations in which the risk of childhood malnutrition were medium, highmedium and high were found in the North, with situations of very low or under
Table 3. Distribution (%) of the children aged six to 59 months studied in the Census Sample 2000 and in the PNDS-2006
according to the variables of prediction of the fi nal model. Brazil, 2006.
Variable Census 2000
(n = 1,809,744) %
PNDS-2006
(n = 3,931) % p
Age (months) 0.364
6 |- 24 32.6 33.6
24 |- 60 67.4 66.4
Sex 0.117
Male 50.8 52.6
Female 49.2 47.4
Socioeconomic score in the PNDS-2006a < 0.001b
Quintile 1 51.2 21.6
Quintile 2 17.4 18.4
Quintile 3 11.1 20.0
Quintile 4 10.2 20.2
Quintile 5 10.1 19.8
Number of individuals per room < 0.001
< 2 85.2 92.5
2 or + 14.8 7.5
Household with indoor plumbing < 0.001
Yes 73.6 86.5
No 26.4 13.6
Number of children under fi ve in the household < 0.001
1 61.4 67.3
2 30.3 27.5
3 or + 8.3 5.2
Region 0.024
North 10.1 10.8
Northeast 30.9 27.3
Center-South 59.0 62.0
a Score of the socioeconomic quintiles: Quintiles 1: 22 to 182, Quintiles 2: 183 to 234, Quintiles 3: 230 to 280, Quintiles 4: 281 to 357 e Quintiles 5: 358 to 557.
b P value of the trend.
PNDS: National Research on Demography and Health
1 ROC area: 0.8545
0.00 0.25 0.50 0.75 1.00
0.00
0.25
0.50
0.75
1.00
Reference 1 – Specificity
Sensiti
vity
Figure 1. Evaluation of the fi nal model’s predictive capacity
control predominating in the other regions. There was, however, areas of low prevalence in the North (more populous municipalities in the states of Rondônia and Tocantins) (Figure 2).
The most disadvantaged areas in the Northeast were located in the North of Bahia. Situations of risk of malnutrition being under control were found mainly in the state capitals and in large urban areas. The most disadvantaged situation in the Southeast was seen in municipalities occupying the northern half of the state of Minas Gerais. The municipalities in which the risk of malnutrition was under control were situated in the southern half of the state and extended throughout the mining area to the area of Belo Horizonte and most of Sao Paulo. The most disadvantaged areas of the South, with a medium risk of childhood malnutrition, were found in small, circumscribed areas of the Center South of the state of Paraná and in smaller areas in Rio
Grande do Sul. This situation was even less common in the Center South of the country (Figure 2).
DISCUSSION
There was a high statistically significant chance of malnutrition in male children, those living in households with two or more individuals per room, households belonging to the lower quintiles of the socioeconomic score, those with three or more children under fi ve, those which did not have indoor plumbing and those located in the North. The negative dose--response link between municipal ESF coverage in 2006 and the chance of malnutrition showed the protective effect of the ESF in relation to childhood malnutrition, irrespective of the other determinants of the problem.
Compared with children living in municipalities with poor or no ESF coverage (between 0% and 15%), the < 5
5 |-7,5
7,5|-10
15 |-20 10 |-15
> 20
other children showed progressively lower chance of being malnourished, with the lowest level being (0.52; 95%CI 0.32;0.85) in those living in municipalities with coverage between 50% and 70% and a small fl uctuation (0.55; 95%CI 0.37;0.81) in the condition of municipal coverage ≥ 70%.
The results concur with those of previous studies in which male children and those living in households which are disadvantaged from a socio-economic or sanitation point of view point of view were statistically signifi cant.8,14,17 The higher frequency of childhood malnutrition in the North of the country has been described in the PNDS-2006 offi cial report.c
Studies on the protective effect of ESF coverage on childhood malnutrition were not found in the national literature. Of those studies which sought to assess the impact of the ESF on health indicators at a national level, two were identifi ed which looked at the outcome of infant mortality. Macinko et al12 (2006), made use of secondary data from all federal states between 1991 and 2002, and reported that an increase of 10% in ESF coverage resulted in a 4.5% decline in infant mortality after controlling for other determinants of childhood health. Aquino et al2 (2008), using secondary data from 721 Brazilian municipalities between 1996 and 2004, observed a statistically signifi cant negative link between ESF municipal coverage and infant mortality rates after controlling potential confounding variables.
Considering the similarity between the determinants of infant mortality and those of childhood malnutrition,19 the impact of ESF coverage on reducing mortality in the abovementioned articles is confi rmed in this study, which suggests protection of ESF coverage with regards malnutrition.
A statistically significant association was observed between ESF coverage and a higher percentage of pregnant women receiving tetanus vaccine during the ante-natal period and higher recorded birth weight records for the children in the PNDS-2006 sample (data not shown). This makes the fi ndings related to the protective effect of the ESF on childhood nutrition more robust as they may indicate better quality health care, presumably applicable to the prevention and control of childhood malnutrition.
The final model showed good predictive capacity evaluated by the area below the ROC curve, the size of which was greater than that shown in the previous study: 0.76; 95%CI 0.65; 0.87; however, the study did not include the variable ESF coverage, this indicator not being available at that time.b
A positive aspect of this study was that it esti-mated individual probability of malnutrition, using multi-level analysis – more appropriate when the sample is grouped into individual, household and municipal levels – rather than cluster analysis used in the other studies in the literature.15,i,j
A limitation of this study is the gap in time between the PNDS-2006 and the 2000 Census Sample. The possible correction factor for updating the 2000 esti-mates of 2006 was obtained by aggregating the results of all the regions and assuming homogeneous evolu-tion for all of the municipalities in the same region.
The minimum and maximum estimated municipal prevalence values (2.8% and 29%) are lower than those presented in a previous Brazilian study, which contained estimates for 2000 (3.3% and 45.0%).b In that study, more than a third of Brazilian municipa-lities in the North, Northeast and Southeast (north of Minas Gerais) showed a prevalence above 15%. In this study, 2.9% of Brazilian municipalities presented this situation, all in the North of the country.
In spite of advances, inter-regional inequalities still exist. The spatial distribution of childhood malnutri-tion in Brazil in 2006 shows concentramalnutri-tions of muni-cipalities with medium high and high risk and none at low risk or under control in some parts of the North. The Northeast is similar to the other regions of the Center-South, where almost all of the municipalities presented low or under control risk.
The information produced by this study and by others with a similar methodology (Small Area Estimation)15,i,j are important in supporting the mana-gers of municipalities and other government spheres in implementing public policies.4
The allocation of fi nancial resources for expanding the ESF was not very signifi cant in the North of the country before 2006, being concentrated in the munici-palities in the Northeast. From this year onwards, there was great expansion in the ESF in municipalities in the Center-South and modest implementation of new ESF teams in municipalities in the North.
In spite of advances, there are still regional inequalities which merit the attention of the formulators of public policy and reinforce the role of increased access to health care for mothers and children, expressed by ESF coverage, in the reduction of childhood malnutrition, especially in the North of the country.
i Elbers C, Lanjouw JO, Lanjouw P. Welfare in villages and towns: micro-level estimation of poverty and inequality. Amsterdan: Tinbergen Institute; 2001[cited 2012 Nov 26]. Available from: http://lacea.org/meeting2000/ChrisElbers.pdf
1. Aquino R, Barreto ML. Programa Saúde da Família: acerca da adequação do uso do seu indicador de cobertura. Cad Saude Publica. 2008;24(4):905-14. DOI: http://dx.doi.org/10.1590/S0102-311X2008000400022
2. Aquino R, Oliveira NF de, Barreto ML. Impact of the Family Health Program on infant mortality in Brazilian Municipalities. Am J Public Health. 2008;99(1):87-93. DOI:http://dx.doi.org/10.2105/AJPH.2007.127480
3. Barros AJD, Victora CG. Indicador econômico para o Brasil baseado no censo demográfi co de 2000. Rev Saude Publica. 2005;39(4):523-9. DOI: http://dx.doi.org/10.1590/S0034-89102005000400002
4. Barros AJD, Victora CG, Cesar JA, Neumann NA, Bertoldi AD. Brazil: Are Health and Nutrition Programs Reaching the Neediest? In: Gwatkin DR, Wagstaff A, Yazbeck AS, editors. Reaching the poor with health, nutrition and population services. What works, what doesn’t and why. Washington: World Bank; 2005. p. 281-306. Disponível em: http://siteresources.worldbank. org/INTPAH/Resources/Reaching-the-Poor/complete.pdf
5. Benicio MHD’A, Monteiro CA. Desnutrição infantil nos municípios brasileiros: risco de ocorrência. Brasília: UNICEF, NUPENS-USP; 1997.
6. Black RE, Allen LH, Bhutta ZA, Caulfi eld LE, Onis M, Ezzati M. Maternal and child undernutrition: global and regional exposures and health consequences. Lancet. 2008;371(9608):243-60. DOI:http://dx.doi.org/10.1016/S0140-6736(07)61690-0
7. Cavenaghi S. Aspectos Metodológicos e comparabilidade com pesquisas anteriores. In: Ministério da Saúde. Pesquisa Nacional de Demografi a e Saúde da Criança e da Mulher – PNDS 2006: dimensões do processo reprodutivo e da saúde da criança. Brasília; 2009. p.13-32.
8. Drachler ML, Andersson MCS, Leite JCC, Marshall T, Aerts DRG, Freitas PF, et al. Desigualdade social e outros determinantes da altura em crianças: uma análise multinível.
Cad Saude Publica. 2003;19(6):1815-25. DOI: http://dx.doi.org/10.1590/S0102-311X2003000600025
9. Goldstein H. Multilevel statistical models. 2. ed. London: Edward Arnold; 1995.
10. Hosmer DW, Lemeshow S. Applied logistic regression. New York: John Wiley & Sons; 1989.
11. Yunes J. O SUS na lógica da descentralização.
Estud Av. 1999;13(35):65-70. DOI:
http://dx.doi.org/10.1590/S0103-40141999000100006
12. Macinko J, Guanais FC, Souza MFM. Evaluation of the impact of the Family Health Program on infant mortality in Brazil, 1990-2002. J Epidemiol Community Health. 2006;60(1):13-9. DOI:http://dx.doi.org/10.1136/jech.2005.038323
13. Monteiro CA, Benício MHD’A, Konno SC, Silva ACF, Lima ALL, Conde WL. Causas do declínio da desnutrição infantil no Brasil, 1996-2007.
Rev Saude Publica. 2009;43(1):35-43. DOI:
http://dx.doi.org/10.1590/S0034-89102009000100005
14. Oliveira LPM, Barreto ML, Assis AMO, Braga Jr ACR, Nunes MFP, Oliveira NF, et al. Preditores do retardo do crescimento linear em pré-escolares: uma abordagem multinível. Cad Saude Publica. 2007;23(3):1-13. DOI: http://dx.doi.org/10.1590/S0102-311X2007000300019
15. Rogers BL, Wirth J, Macías K, Wilde P. Mapping Hunger: a report on mapping malnutrition prevalence in the Dominican Republic, Ecuador and Panama. In: Working Paper in Food Policy and Applied Nutrition.
v. 34. Medford: Friedman School of Nutrition Science and Policy, Tufts University; 2007.
16. Santana ML, Carmagnani MI. Programa de saúde da família no Brasil: um enfoque sobre seus pressupostos básicos, operacionalização e vantagens. Saude Soc. 2001;10(1):33-54. DOI: http://dx.doi.org/10.1590/S0104-12902001000100004
17. Souza OF, Benício MHDB, Castro TG, Muniz PT, Cardoso MA. Desnutrição em crianças menores de 60 meses em dois municípios no Estado do Acre: prevalência e fatores associados.
Rev Bras Epidemiol. 2012;15(1):211-21. DOI: http://dx.doi.org/10.1590/S1415-790X2012000100019
18. Victora CG, Adair L, Fall C, Hallal PC, Martorell R, Richter L, et al. Maternal and child undernutrition: consequences for adult health and human capital. Lancet. 2008;371(9609):340-57. DOI:http://dx.doi.org/10.1016/S0140-6736(07)61692-4
19. UNICEF. Policy review: strategy for improved nutrition of children and women in developing countries. New York; 1990. (Policy review paper, E/CEF/ 1990/1.6).
20. World Health Organization. WHO child growth standards: length/height-for-age, for-age, weight-for-length, weight-for-height and body mass index-for-age: methods and development. Geneva; 2006.
21. World Health Organization. Physical Status: the use and interpretation of anthropometry. Geneva; 1995. (WHO Technical Series, 854).
REFERENCES
Article based on the thesis for admission as Associate Professor submitted by Maria Helena D’Aquino Benício entitled: ”Estimativas da prevalência de desnutrição infantil nos 5.507 municípios brasileiros em 2006”, presented to the
Faculdade de Saúde Pública, Universidade de São Paulo, in 2010.
Research carried out with the fi nancialsupport of the Conselho Nacional de Desenvolvimento Científi co e Tecnológico