Accidents involving motorcycles and potential years
of life lost. An ecological and exploratory study
Drielle Rezende Pavanitto
I, Renata Armani de Moura Menezes
I, Luiz Fernando Costa Nascimento
IIDepartment of Medicine, Universidade de Taubaté (UNITAU), Taubaté (SP), Brazil
INTRODUCTION
Brazil occupies the ith place among the countries with the highest numbers of traic deaths, only preceded by India, China, the United States and Russia. he mortality rate due to road transport accidents (RTAs) increased from 18.0 to 22.5 deaths/100,000 inhabitants between 2000 and 2010, which represented an increase of 32.3% over this decade.1 he motorcycle
acci-dent mortality rate in Brazil increased from 0.5 to 4.5/100,000 inhabitants from 1996 to 2009, which represented an increase of 800% over this period.2 Collisions between motorcycles and
automobiles was the largest cause of these accidents (38.4%) and accidental falls from motor-cycles was the second (32%), in a survey on 378 recorded incidents involving motorcycle acci-dents in Corumbá, Mato Grosso do Sul, in 2010.3 Motorcycle accidents are highly worrisome,
since they mainly afect young people of economically active age, with a high chance of death,4
as shown in the state of Sergipe, among 554 motorcycle accident victims who were attended at a referral center.5
In the western region of the Paraíba valley, in the state of São Paulo, a cluster of nine munici-palities with the highest hospitalization rates due to motorcycle accidents was identiied through spatial analysis.6 his approach, including the indicator of potential years of life lost (PYLL), was
used in the state of Pernambuco, in the year 2007, for a study on accidents due to RTAs. It was found that 13,196 RTAs involved motorcycles, which represented 27. 5% of the total number of accidents.7 he PYLL indicator estimates the impact of deaths on society. It qualiies deaths
and presents a new criterion for selecting priorities. hrough a single igure, the PYLL indicator covers the magnitude of the impact, expressed as the number of deaths according to the age at which the event occurs, and the vulnerability to death. hus, this indicator quantiies mortality not only according to the frequency of occurrence of death but also according to the time let to live, up to the limit of life expectancy.
IMedical Student, Department of Medicine, Universidade de Taubaté (UNITAU), Taubaté (SP), Brazil.
IIPhD. Researcher, Department of Energy, Universidade Estadual Paulista (UNESP), Guaratinguetá (SP), and Assistant Professor, Department of Medicine, Universidade de Taubaté (UNITAU), Taubaté (SP), Brazil.
KEY WORDS:
Life expectancy.
Geographic information systems. Motorcycles.
Accidents, traic.
ABSTRACT
CONTEXT AND OBJECTIVE: Traic accidents have gained prominence as one of the modern epidemics that plague the world. The objective of this study was to identify the spatial distribution of potential years of life lost (PYLL) due to accidents involving motorcycles in the state of São Paulo, Brazil.
DESIGN AND SETTING: Ecological and exploratory study conducted in São Paulo.
METHODS: Data on deaths among individuals aged 20-39 years due to motorcycle accidents (V20-V29 in the International Classiication of Diseases, 10th revision) in the state of São Paulo in the years
2007-2011 were obtained from DATASUS. These data were stratiied into a database for the 63 microregions of this state, according to where the motorcyclist lived. PYLL rates per 100,000 inhabitants were calculated. Spatial autocorrelations were estimated using the Global Moran index (IM). Thematic, Moran and Kernel maps were constructed using PYLL rates for the age groups of 20-29 and 30-39 years. The Terraview 4.2.2 software was used for the analysis.
RESULTS: The PYLL rates were 486.9 for the ages of 20-29 years and 199.5 for 30-39 years. Seventeen micro-regions with high PYLL rates for the age group of 20-29 years were identiied. There was higher density of these rates on the Kernel map of the southeastern region (covering the metropolitan region of São Paulo). There were no spatial autocorrelations between rates.
Spatial analysis is a geostatistical tool that is becoming widely used in research, including in health-related ields. One of its applications encompasses identiication of spatial clusters, i.e. any aggregations of events that are not merely random. hrough developing maps, the aim is to analyze whether the distribution of these events actually presents a spatial pattern, or whether it is random. In addition, these data can be used by other sectors, such as transport-related educa-tion and inspeceduca-tion, and may serve as a basis for reducing the risk of accidents. hus, one of the indications for using spatial analysis is to identify sites with greater intensity of accidents, i.e. critical areas. his can serve as backing for implementation of prevention and control measures, as presented in several recent articles published in Brazil.6,8-11
OBJECTIVE
Considering the increasing number of motorcycles that form part of the vehicle leet, the vulnerability of motorcyclists and their pos-sible pillion passengers and the age group to which most motorcy-clists belong, the purpose of this study was to identify the spatial distribution of PYLL in the microregions of the state of Sao Paulo, according to accidents involving motorcycles from 2007 to 2011.
METHODS
An exploratory ecological study was conducted using spatial anal-ysis tools, on mortality data relating to accidents involving motor-cycles in the state of São Paulo, Brazil, according to its 63 micro-regions. he mortality data were obtained from the Mortality Information System (SIM), which includes data from death certii-cates from all over the country and is available through the web-site of the Department of Information Technology of the Brazilian National Health System (DATASUS).12 he period examined was
from January 1, 2007, to December 31, 2011, and the age groups covered were 20 to 29 years and 30 to 39 years. he diagnoses con-sidered related to accidents involving motorcyclists (V20-V29 of the International Classiication of Diseases, 10th revision).
he sizes of the populations within these age strata (20-39 years of age) over this period were ascertained and mortality rates per 100,000 inhabitants were calculated, to make it possible to compare PYLL values between the microregions. Five-year periods were used to minimize possible luctuations in death data. he popula-tion estimates used were obtained from the DATASUS website.12
he technique for PYLL estimation proposed by Romeder and McWhinnie was used,13 as expressed in the following
math-ematical formula:
PYLL = Σ (70 – i – 0.5) di
where i was taken to be the midpoint of the intervals from
20 to 29 years and from 30 to 39 years for each group, and
di was the number of deaths in each microregion, according
to age group.
he PYLL rates for the age groups of 20 to 29 years and 30 to 39 years were calculated to ensure comparability with other stud-ies on populations of diferent sizes and populational pyramids. he following mathematical formula, adapted from Romeder and McWhinnie, was used:13
PYLL rate = (PYLL /N)*100,000 inhabitants
where N = the number of people in the corresponding age group.
he age limit of 70 years was chosen because this was the age proposed in the original method.
hese values were inserted in a digital map of the state of São Paulo according to its microregions, which was obtained from the Brazilian Institute for Geography and Statistics (Instituto Brasileiro de Geograia e Estatística, IBGE). hematic maps were then con-structed using the PYLL values for the ranges of 20-29 years and 30-39 years. In addition to the thematic maps, Kernel maps con-taining quartic function, density calculation, adaptive radius and 200 columns were constructed; these maps analyzed the behav-ior of dot patterns. hus, through interpolation, the Kernel maps provided point intensities relating to the process, throughout the study region. From this, an overview of the areas of higher density of PYLL was obtained.14
Box maps were another form of graphical representation that was used. In this, correlations were made between Z (nor-malized values) and Wz values (averages of neighbors) in scat-ter plots divided into quadrants (Q). he Q values ranged from 1 to 4, such that Q1 corresponded to high-high values (i.e. high values of Z and high values of Wz); Q2, low-low; Q3, high-low; and Q4, low-high.14
The statistical analysis was based on calculation of the Global Moran Index (IM) for motorcycle riders’ PYLL rates. This index indicates the degree of spatial association in the information set, from the product to the mean, thus providing a single value as a measure of the spatial association for the entire data set. The values for this index, which is an overall measurement of spatial autocorrelation, are contained within the interval [-1; 1]. In calculating this index, it is important to establish its statistical validity by estimating its significance (P-value). Values close to zero indicate a lack of significant spatial autocorrela-tion between the values of the variables. Positive and negative values indicate positive or negative self-correlations between variables, respectively.14
RESULTS
A total of 5,348 deaths in the age range of 20 to 39 years over the years 2007 to 2011 were identiied in the 63 microregions of the state of São Paulo. Of these, 3,686 deaths (68.9%) occurred in the age group of 20-29 years and 1,662 deaths (31.1%) in the age group of 30-39 years. here were 4,885 deaths of males (91.3%).
he mortality coeicients according to age group were 10.04 deaths/100,000 inhabitants for the range of 20-29 years and 4.96/100,000 inhabitants for the range of 30-39 years of age.
Table 1 shows that the mean PYLL rate among the population living in the state of São Paulo aged 20-29 years old was almost double that of the population aged 30-39 years. he minimum and maximum were also practically double in the 20-29 years population but the Moran indices for these age groups were not signiicantly diferent.
Figure 1 shows the thematic maps of PYLL rates per 100,000 inhabitants for accidents involving motorcyclists aged 20-29 years (Figure 1A) and 30-39 years (Figure 1B). he highest contribution to these rates was the age group of 20 to 29 years, in which 38 micro-regions presented rates greater than 400 PYLL/100,000 inhabitants. he Kernel maps show high densities of PYLL rates in micro-regions located in the metropolitan region of São Paulo and also in its surroundings, such as in Sorocaba, Osasco, Campinas, Jundiaí, Itapecerica da Serra, Franco da Rocha, Bragança Paulista and Piedade, for the age groups of 20-29 and 30-39 years (Figures 2A and 2B).
Figure 3 presents Box maps that depict the microregions of high priority (HIGH), low priority (LOW) and no statistical signiicance
Table 1. Descriptive analysis on age group variables (years) with mean, standard deviation (SD), minimum (Min) and maximum (Max) values for potential years of life lost, and the Moran index (IM) with respective P-values, state of São Paulo, 2007-2011
Age group Mean (SD) Min-Max IM (P-value)
20-29 486.9 (231.6) 98.1-1134.0 0.01 (0.41) 30-39 199.5 (105.5) 23.7-568.6 -0.04 (0.28)
Figure 2. Kernel maps showing densities of rates of potential years of life lost per 100,000 inhabitants, among motorcyclists aged 20-29 years (A) and 30-39 years (B), according to microregions of the state of São Paulo, 2007-2011.
LD = low density; MD = medium density; HD = high density.
A
B
0 100 200
Km
300
0 100 200
Km
300
HD MD LD
HD MD LD
N N
Figure 1. Rates of potential years of life lost per 100,000 inhabitants among motorcyclists aged 20-29 years (A) and 30-39 years (B), according to microregions of the state of São Paulo, 2007-2011.
A
B
0
0 100 200 100 200
Km Km
300 300
up to 200 200 ~ 300 300 ~ 400 400 ~ higher
up to 200 200 ~ 300 300 ~ 400 400 ~ higher
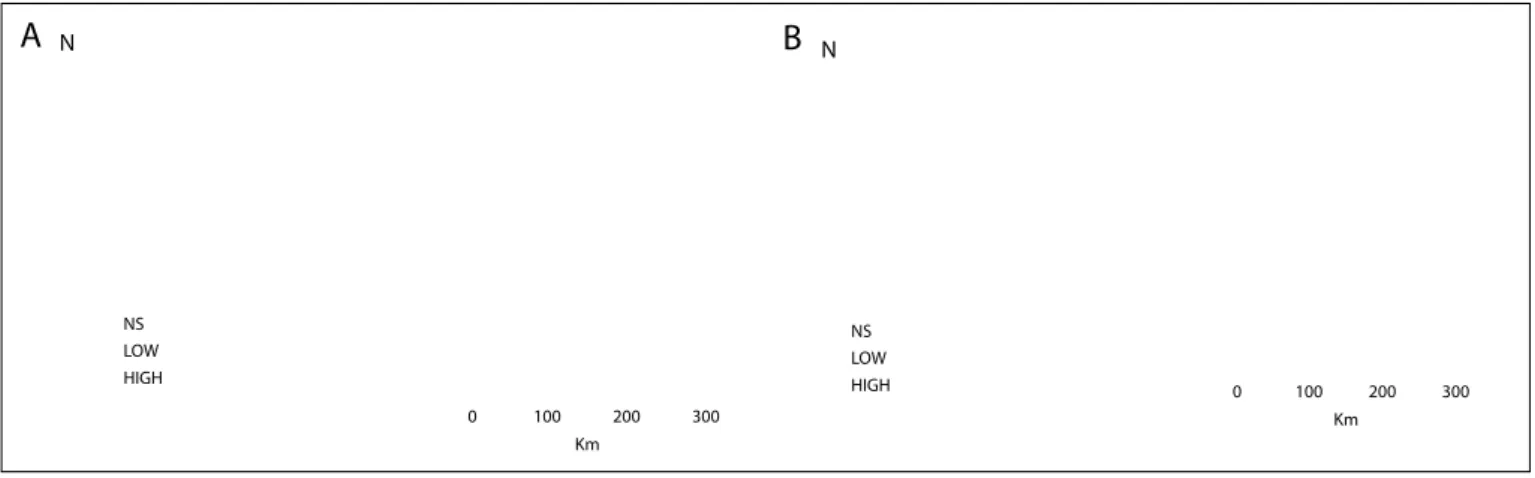
(NS) regarding their PYLL rates per 100,000 inhabitants. Figure 3A shows the PYLL rates for the age group of 20 to 29 years old, and indi-cates that 17 microregions have high priority for interventions; while Figure 3B shows the PYLL rates for the age group of 30-39 years, and indicates that 14 microregions have high priority for interventions.
DISCUSSION
To the best of our knowledge, this was the irst study conducted using data from the state of São Paulo, thus making it diicult to compare this study with diferent places and times. In this study, greater concentration of accidents was identiied in the metropolitan region of São Paulo and also in the microregions of Sorocaba, Osasco, Campinas, Jundiaí, Itapecerica da Serra, Franco da Rocha, Bragança Paulista and Piedade. Moreover, it was possible to identify microregions with high PYLL rates that deserve high-priority interventions to minimize these rates, to be implemented by regional managers and authorities linked to traf-ic management, given that these rates show the high impact of deaths within an economically active age range.
his study focused on a spatial approach to potential years of life lost by speciically addressing motorcycle accidents. Traic accidents involving motorcycles in the state of São Paulo are wor-rying. In 2012, there were 1,700 deaths due to motorcycle accidents in the state of São Paulo and 1,200 (approximately 71%) occurred in the age group of 20-39 years, which is a young and economi-cally active segment of the population. In our study, around 71% of the accidents involving motorcycles occurred among individuals in this age group, with higher prevalence among males (91.3%).12
he approach used here, i.e. spatial analysis, has been applied in many public health studies such as those describing accidents involving motorcyclists in Maringá, Paraná,4 and in the Paraíba
valley, state of São Paulo,6 and in studies on other topics such as
the spatial distribution of cesarean section rates in the state of São
Paulo,9 Alzheimer’s deaths in the state of São Paulo10 and
pneumo-nia in the Paraíba valley, state of São Paulo.11
A study conducted in the state of Pernambuco, in 2007, brought together spatial analysis and PYLL in relation to motorcycle acci-dents. It found that the mean number of PYLL due to RTA was 35.1 years, and that among the victims, 27.5% were motorcyclists, 24.6% were pedestrians and 17.82% were car occupants.7
In Rio Branco, Acre, the number of accidents involving motor-cycles and the number of victims have been correlated with the growth of the leet of motorcycles, which increased by 42.2% over the study period, while the leet of other vehicle types increased by 9.2%. hese accidents predominantly involved males and the age groups of 20 to 29 and 30 to 39 years.15
he Brazilian leet of motorcycles increased from approxi-mately 2,800,000 in 1998 to 16,500,000 in 2010, which was an increase of 490%.2 his increase, which resulted from marketing
actions promoted by manufacturers and resellers, from low pur-chase prices associated with the introduction of long-term inanc-ing for instalment plans with small monthly repayments, and from use of motorcycles as a work tool for an increasing range of pro-fessional activities, may have contributed towards the increase in the number of accidents. Nevertheless, other causes may be cor-related with this increase, including a lack of safety measures such as roads that are not always well maintained, riders’ carelessness in traic, negligence regarding the quality and validity of helmets (which have a maximum useful life) and lack of supervision by the highway authorities regarding motorcycle and rider conditions.1,4
he data presented in this study coincide with the indings of Silva et al., who used spatial analysis in a study carried out in the state of Pernambuco, where the highest death rates involving motorcyclists formed urban clusters, including in the metropoli-tan region of Recife. Both studies showed higher rates of PYLL among in male motorcyclists and in the age group of 20-39 years.16
Figure 3. Box maps showing microregions that present high priority for interventions (HIGH), low priority (LOW) and no statistical signiicance (NS), according to potential years of life lost per 100,000 inhabitants, involving motorcyclists aged 20-29 years (A) and 30-39 years (B); state of São Paulo, 2007-2011.
A
B
0 100 200
Km
300
0 100 200
Km
300 NS
LOW HIGH
NS LOW
HIGH
Our indings also coincide with those of Andrade and Mello-Jorge,17 who identiied a loss of more than 1.3 million years due
to terrestrial transport accidents over the years 2011 to 2013. hey indicated that the age group that was most compromised was from 20 to 39 years, which accounted for 760,000 PYLL (around 60% of the total), of which 650,000 PYLL (around 86% in 20-39 age strata) related to males. he death rate per 100,000 inhabit-ants was highest (6.3) among motorcyclists. hese authors showed that the costs were of the order of R$ 115 million (approximately US$ 30 million), which corresponded to 50% of the total expenses incurred through hospitalizations due to road traic accidents and to 550,000 days of hospitalization due to traic accidents involv-ing motorcycles in 2012.18
Mascarenhas et al. evaluated records from emergency services in 24 state capitals and from the national capital (Brasília) relating to transportation accidents involving motorcyclists. hey found that 66% of these admissions related to victims between 20 and 39 years of age, which was a rate similar to what was found in our study.19
In a time series study conducted using data from the state of Santa Catarina, among 19,889 motorcycle accidents, 84.43% of these involved male victims. he age groups of 20 to 29 years and 30 to 39 years accounted for a total of 10,564 hospitalizations (around 53%).20
Accidents involving motorcycles accounted for around 12% of all deaths in the age group 20-29 years old in our study. In total, males were much more afected (around 90%).12
he present study may have limitations and among these, it needs to be pointed out that the data used were secondary, although they were obtained from an oicial source (DATASUS). On the other hand, no information was available regarding whether deaths occurred at the accident site or at hospital shortly ater the acci-dent, or whether they occurred later on, as a result of complica-tions from the injuries sufered by the motorcyclist. No information regarding whether the accidents occurred on highways or on the streets of the municipalities that make up the microregions stud-ied was available. he systems compromised by the accident, such as skull trauma and fractures of upper and/or lower limbs, and the complications resulting from these injuries, have not been studied. In addition, ecological study designs do not indicate causality, but on the other hand they provide information to generate hypothe-ses. Nevertheless, the fact that microregions with high rates of lost years of life were identiied through the present study is enough to activate regional and municipal managers to seek to discover the possible reasons that are leading to these disastrous indings.
CONCLUSIONS
From the data of the present study, it can be concluded that the number of years of life lost through occurrences of motorcycle accidents in this young age group (20-39 years of age) consti-tutes an important social and public health problem. he spatial approach proved to be a useful tool for identifying microregions
that deserve attention and provides backing for implementation of local and regional policies to minimize these accident rates.
REFERENCES
1. Morais Neto OL, Montenegro MM, Monteiro RA, et al. Mortalidade por acidentes de transporte terrestre no Brasil na última década: tendência e aglomerados de risco [Mortality due to road traic accidents in Brazil in the last decade: trends and risk clusters]. Ciênc Saúde Colet. 2012;17(9):2223-36.
2. Martins ET, Boing AF, Peres MA. Mortalidade por acidentes de motocicleta no Brasil: análise de tendência temporal, 1996-2009 [Motorcycle accident mortality time trends in Brazil, 1996-2009]. Rev Saúde Pública. 2013;47(5):931-41.
3. Ganne N, Martinez AT, Rodrigues C, Delgado MUC, Souza FA. Estudo sobre acidentes de trânsito envolvendo motocicletas, ocorridos no Município de Corumbá, Estado de Mato Grosso do Sul, Brasil, no ano 2010 [Motorcycle accidents in the Municipality of Corumbá, Mato Grosso do Sul State, Brazil, in 2010]. Rev Pan-Amaz Saúde. 2013;4(1):15-22 4. Oliveira NLB, Sousa RMC. Fatores associados ao óbito de
motociclistas nas ocorrências de trânsito [Factors associated with the death of motorcyclists in traffic accidents]. Rev Esc Enferm USP. 2012;46(6):1379-86.
5. Vieira RCA, Hora EC, Oliveira DV, Vaez AC. Levantamento epidemiológico dos acidentes motociclisticos atendidos em um Centro de Referência ao Trauma de Sergipe [An epidemiological survey on motorcycle accident victims assisted at a Reference Trauma Center of Sergipe]. Rev Esc Enferm USP. 2011;45(6):1359-63.
6. Nunes MN, Nascimento LFC. Internações hospitalares por acidentes de moto no Vale do Paraíba [Hospitalization due to motorcycle accidents in the Paraiba Valley using spatial analysis]. Rev Assoc Med Bras. 2010;56(6):684-7.
7. Almeida APB, Lima MLC, Oliveira Júnior FJM, Abath MB, Lima MLLT. Anos potenciais de vida perdidos por acidentes de transporte no Estado de Pernambuco, Brasil, em 2007 [Potential years of life lost because of road traic accidents in Pernambuco state, Brazil, 2007]. Epidemiol Serv Saúde. 2013;22(2):235-42.
8. Lucena RM, Sousa JL. Anos potenciais de vida perdidos (APVP) por Aids: Pernambuco, 1996 e 2005 [Years of potential life lost (YPLL) by Aids: Pernambuco, 1996 and 2005]. DST J Bras Doenças Sex Transm. 2009;21(3):136-42.
9. Campi SFS, Nascimento LFC. Distribuição espacial das cesarianas no Estado de São Paulo [Spatial distribution of C-sections within the State of São Paulo]. Rev Assoc Med Bras. 2014;60(5):419-23.
10. Almeida MC, Gomes CM, Nascimento LF. Spatial distribution of deaths due to Alzheimer’s disease in the state of São Paulo, Brazil. Sao Paulo Med J. 2014;132(4):199-204.
12. Brasil. Ministério da Saúde. Departamento de Informática do SUS (Datasus). Available from: http://www2.datasus.gov.br/DATASUS/index. php. Accessed in 2017 (Apr 6).
13. Romeder JM, McWhinnie JR. Años de vida potencial perdidos entre las edades de 1 y 70 años: un indicador de mortalidad prematura para la planiicación de la salud. In: Buck C, Llopis A, Nájera E, Terris M, orgs. El desafío de la epidemiología: problemas y lecturas seleccionadas. Washington: Organización Panamericana de la Salud; 1988. p. 254-63. Available from: http://www.saludcolectiva-unr.com.ar/docs/SC-122. pdf. Acessed in 2017 (Sep 28).
14. Neves MC, Ramos FR, Camargo ECG, Câmara G, Monteiro AM. Análise exploratória espacial de dados sócio-econômicos de São Paulo. Available from: www.dpi.inpe.br/gilberto/papers/marcos_gisbrasil2000. pdf. Accessed in 2017 (Sep 6).
15. Rocha GS, Schor N. Acidentes de motocicleta no município de Rio Branco: caracterização e tendências [Motorcycle accidents in the municipality of Rio Branco in the State of Acre: characterization and trends]. Ciênc Saúde Colet. 2013;18(3):721-31.
16. Silva PHNV, Lima MLC, Moreira RS, Souza WV, Cabral APS. Estudo espacial da mortalidade por acidentes de motocicleta em Pernambuco [Spatial study of mortality in motorcycle accidents in the state of Pernambuco, northeastern Brazil]. Rev Saúde Pública. 2011;45(2):409-15.
17. Andrade SSCA, Mello-Jorge MHP. Mortalidade e anos potenciais de vida perdidos por acidentes de transporte no Brasil, 2013 [Mortality and potential years of life lost by road traic injuries in Brazil, 2013]. Rev Saúde Pública. 2016;50:59.
18. Andrade SSCA, Jorge MHPM. Internações hospitalares por lesões decorrentes de acidente de transporte terrestre no Brasil, 2013: permanência e gastos [Hospitalization due to road traic injuries in Brazil, 2013: hospital stay and costs]. Epidemiol Serv Saúde. 2017;26(1):31-8. 19. Mascarenhas MDM, Souto RMCV, Malta DC, et al. Características de
motociclistas envolvidos em acidentes de transporte atendidos em serviços públicos de urgência e emergência [Characteristics of motorcyclists involved in road traic accidents attended at public urgent and emergency services]. Ciên Saúde Coletiva. 2016;21(12):3661-71. 20. Schneider IJC, Schütz MV, Nazário NO, et al. Tendência das internações
por acidentes motociclísticos em homens de 20 a 39 anos no Estado de Santa Catarina - Sul do Brasil [Trends in hospitalizations due to motorcycle accidents involving men aged 20 to 39 years in the state of Santa Catarina - Southern Brazil]. Cad Saúde Colet. 2017;25(2):233-41.
Conlict of interest: None
Sources of funding: None
Date of irst submission: April 6, 2017
Last received: August 2, 2017
Accepted: August 7, 2017
Address for correspondence: Luiz Fernando Costa Nascimento
Departamento de Energia, Universidade Estadual Paulista (UNESP) Av. Ariberto Pereira da Cunha, 333
Guaratinguetá (SP) — Brasil CEP 12516-410
Tel. (+55 12) 3123-2161
E-mail: [email protected]