Introduction
Water is polluted as a consequence of the domestic and industrial men activity. This includes varying extents and types of pollutants. It is a complex problem that sometimes is not always considered with the proper seriousness. Many scientists are putting efforts to understand these systems and to propose new methods to overcome this problem. Such methods include precipitation, flocculation, adsorption, and biodegradation processes [1]. In general, differ-ent processes must be combined to achieve the desired contaminants removal level.
Colored effluents receive special attention because they are easily detected and on the other hand, the chemical structure of such dyes varies enormously. Certain methods can work very well for the uptake of a specific group of dyes but sometimes they can be inefficient to remove other
different types of dyes. Adsorption methods have received great attention because they are effec-tive and their application processes are relaeffec-tively simple. Activated carbon is the most widely used adsorbent for color removal. It has the ability to adsorb large amounts of various types of dye. Due to its relatively high cost, other lower cost materials have been also investigated as adsor-bents for dye removal from aqueous media. Some of these materials are: chitin [2], Fuller’s earth and fired clay [3], cellulose based polymers [4], peat [5] and wood [6]. Lignin-based materials were also investigated: post-vanillin lignin for cationic and anionic dyes [7, 8] and hydrolytic lignin modified with cationic surfactant for anionic dye adsorption [9]. The results have shown that through lignin chemical modification and/or by just varying the adsorption conditions, the use of lignin as an adsorbent for dye removal from aqueous media can be significantly
www.scielo.br/eq www.ecletica.iq.unesp.br
Volume 32, número 4, 2007
Methylene blue adsorption onto modified lignin
from sugar cane bagasse
N. Consolin Filhoa*, E. C. Venancioa, M. F. Barriquelloa, A. A. W. Hechenleitnerb, E. A. G. Pinedab
aEmbrapa – Instrumentação Agropecuária, Rua XV de Novembro, 1452, C.P. 741,
CEP:13.560-970, São Carlos, SP, Brazil
bDepartamento de Química, Universidade Estadual de Maringá, Avda. Colombo 5790,
CEP 87020-900 Maringá, PR, Brazil *[email protected]
Abstract: The adsorption kinetics and equilibrium of methylene blue (MB) onto reticulated formic lignin (RFL) from sugar cane bagasse was studied. The adsorption process is pH, temperature and ionic strength (µ) dependent and obeys the Langmuir model. Conditions for higher adsorption rate and capacity were determined. The faster adsorption (12 hours) and higher adsorption capacity (34.20 mg.g-1) were observed at pH = 5.8 (acetic acid-sodium acetate aqueous buffer), 50 °C and 0.1 ionic strength. Under temperature (50 °C) control and occasional mechanical stirring it took from 1 to 10 days to reach the equilibrium.
enhanced. In some cases it showed a higher adsorption capacity than activated carbon.
In this work is presented the use of reticu-lated formic lignin as an adsorbent material for methylene blue removal from aqueous media. Lignin was obtained from sugar cane bagasse, an abundant agro-industrial residue in various regions of Brazil. The adsorption equilibrium and kinetic studies were carried out by varying the temperature, pHand ionic strength (µ).
Experimental details
Formic lignin from sugar cane bagasse
Sugar cane bagasse was obtained from a local Sugar and Alcohol Industry (USACIGA). The sample was firstly washed with excess of deionized water, dried at room temperature (25 oC), and then it was grounded in a knife mill.
The fraction up to 100 mesh of particle size was isolated for further studies. From the sugar cane bagasse powder (200 g), extractives were removed by using a soxhlet apparatus, in three stages using the following solvents (0.5 L): n-hexane (Mallinckrodt – AR), ethanol (Synth) and deionized water (this sequence), until the liquid remained uncolored in each solvent. Lignin was then extracted under reflux (~100oC) during three hours in the presence of formic acid (80%) (J. T. Baker). Aqueous 1 % (w/v) hydrochloric acid (HCl) (Merk) used as catalyst and the liquid-to-solid ratio was 115 mL to 10 g. The liquor obtained was concentrated in a rota-tory evaporator until a viscous liquid was obtained. The lignin precipitation was obtained by adding deionized water (drop by drop) to the viscous liquid, where hemicelluloses remains dissolved. The lignin was isolated and it was then dissolved in hot formic acid followed by precipitation by adding water. The resulting lignin precipitate was filtered and the solid por-tion collected. The filtrate (solid porpor-tion, lignin) was then oven dried at 60°C during 60 minutes. The formic lignin (FL) obtained was grounded by using a ceramic mortar and pestle and it was then stored in dark glass flasks. In order to obtain an insoluble lignin sample, FL was retic-ulated as described below.
Formic lignin reticulation
As reticulating agent acidic formaldehyde (Synth) solution was used. 10 mL of 40% formalde-hyde and 5 mL of 37 % HCl aqueous solution were added to 0.4 g of FL and the resulting mixture was maintained under reflux (~100 oC) during 30 min. The dispersion was then filtered and the resulting solid material was washed and vacuum (mechani-cal) dried at 60°C until the sample presents a con-stant weight.
Solubility of lignin samples
Aqueous sodium acetate/acetic acid buffer solutions (pH= 4.5 and 5.8), aqueous HCl solu-tion (pH = 2), and aqueous sodium hydroxide (pH =8.0) were prepared.
50 mg of lignin sample was added to a round bottom volumetric flask containing 25 mL of aque-ous sodium acetate/acetic acid pH= 4.5 buffer solu-tion. The solubility of lignin sample in buffer system was monitored by measuring absorption increments at 280 nm (HITACHI U-2000 spectrophotometer). The exact same procedure as described above was repeated except that the following aqueous systems were used: (1) aqueous sodium acetate/acetic acid
pH= 5.8 buffer solution; (2) pH= 2.0 HCl aqueous solution; (3) pH= 8.0 sodium hydroxide (NaOH) aqueous solution. The lignin samples used were FL and RFL, respectively.
Adsorption experiments
Methylene blue (MB) aqueous solution (10.0 mg.mL-1) was prepared by using deionized water and a buffer aqueous solutions (pH =4.5 and 5.8). 50 mg of RFL was added to a round bot-tom volumetric flask containing 25 mL of MB aqueous solution and it was then left inside a ther-mostatic bath during 0.5 to 10 days with occa-sional mechanical siring. The resulting disper-sions were then centrifuged and the MB concen-tration of the supernatant solution was deter-mined by absorption measurements at 662 nm (HITACHI U-2000 spectrophotometer). The amount of MB adsorbed was calculated from the difference between the MB concentration in the solutions before and after the adsorption studies.
The ionic strength (µ) controlled experi-ments were carried out by adding sodium chloride (NaCl) to deionized water to attain ionic concen-tration of 0.5 and 1.0. The exact amount of NaCl added prepare pHand µ controlled aqueous solu-tions was calculated using the Henderson-Hasselbach modified equation [10]. All experi-ments of adsorption were performed in duplicate.
Results and discussion
The solubility of the FL and RFL samples in aqueous solutions was quantified by measur-ing the UV absorption intensity at 280 nm. It was observed that RFL presented the lowest solubili-ty in all studied systems, i.e. aqueous buffer solu-tion (pH= 4.5 and 5.8, maximum of absorption intensity = 0.06 a.u.) and HCl and NaOH aque-ous solutions (pH = 2.0 and 8.0, maximum of absorption intensity = 0.11 a.u.). The FL present-ed relatively high solubility in all systems stud-ied, where the maximum of absorption intensity at 280 nm was higher than 1.6 a.u.. Therefore, RFL was used for the MB adsorption studies.
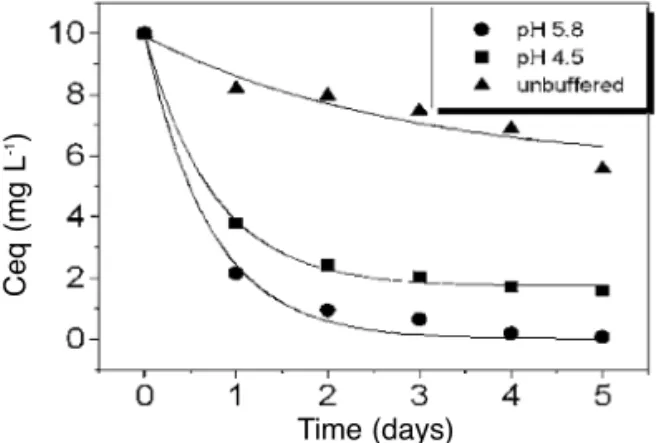
Figure 1 shows the dye concentration decay for MB initial concentration of 10.0 mg.mL-1in the presence of RFL at 30°C. The rate of MB uptake from buffered aqueous solutions at
pH = 5.8 and 4.5, respectively, is much faster than from the unbuffered aqueous solution at pH
= 5.9. When the MB (10.0 mg.mL-1) was kept in the presence of RFL during five days in a pH= 5.8 buffered aqueous solution almost all MB
was removed from the liquid phase. These results suggest that the µ plays an important role in the adsorption process. The µ of the buffered aque-ous solutions (pH= 5.8, pH= 4.5) is higher than of the unbuffered aqueous solutions (pH = 5.9).
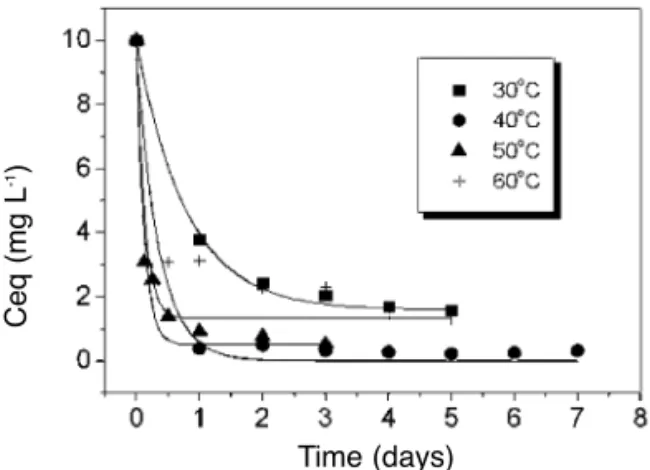
In order to analyze the temperature influence in this MB adsorption process, adsorption experi-ments were carried out in the three different aqueous solutions (buffered aqueous solutions pH= 5.8, pH
= 4.5 and unbuffered aqueous solutions pH = 5.9). The temperatures studied were: 40, 50 and 60°C. The results are summarized in Figs. 2-4. In two dif-ferent systems, i.e. unbuffered (pH = 5.9) and buffered (pH=4.5), the MB adsorption presented a maximum in the temperature range of 30 - 60°C, namely at 40 °C and 50 °C, respectively. In the pH = 5.8 buffered aqueous solution, MB is completely removed from the liquid phase at 30oC and at 50°C. At 60°C some of the adsorbed MB is desorbed from the RFL surface. The minimum time interval required to reach the adsorption equilibrium, with complete dye removal, was approximately 12 hours (at pH= 5.8 and 50°C). With the unbuffered aque-ous solution, the complete dye removal was not obtained and the minimum time interval required to reach the adsorption equilibrium was approximate-ly 2 days (at pH= 5.8 and 50°C).
The three step model proposed by McKay and McConvey [11] for basic and acidic dyes adsorption on wood was used to analyze the adsorption data from this work. This model cal-culates the change in adsorbate concentration (Ct) as a function of the time of adsorption (t) by the equation described below:
Figure 1.MB uptake by RFL in different aqueous media at 30°C.
Figure 2.Temperature influence in MB adsorption onto RFL from unbuffered solution at pH = 5.9.
Ceq (mg L
-1)
Time (days)
Ceq (mg L
-1)
where CS is the adsorbate concentration in the liquid phase near the outer surface of the adsor-bent particle (mg.dm-3), β is the external mass transfer coefficient (cm.s-1), Sis the outer surface of the adsorbent particles per volume unit of par-ticle free slurry (cm-1).
The β Sproduct was determined from the slope at t→0 of the Ct/C0versus tplot. The results are presented in Table 1. A high increment in β Sis observed when the temperature is increased from 30 to 40°C in the buffered aqueous solutions, and from 40 to 50°C in the unbuffered aqueous solution. On the other hand, a decrease in β Sis observed when the temperature increases from 50 to 60°C in the three systems described above. The β Svalues calculated from experiments carried out at the same
temperature for the three systems describe above increases as follows: unbuffered solution (pH = 5.9)
<buffered solution (pH = 4.5) <buffered solution (pH = 5.8). It can be observed that the adsorption kinetic depends on all three parameters, tempera-ture, pHand µ. The effect of the temperature on the MB adsorption behavior on RFL is probably relat-ed to an increase of the adsorption rate with the increase of the temperature up to a limit value (50 oC). This increase in the MB adsorption rate is due
to the increase of the MB diffusion coefficient. At relatively high temperatures, i.e 60 oC, the dessorp-tion process is favored and thus the amount of adsorbed MB decreases. The effect of the pHon the MB adsorption process may be related to the increase of the ionization degree of the carboxylic groups present in the lignin structure when the pH
is increased. This increase in the ionization degree of the carboxylic groups might enhance the interac-tion process between the adsorbate (MB), a cainterac-tion- cation-ic dye and the adsorbent (RFL), whcation-ich results in a driving force for adsorbate diffusion in the region near the surface of the lignin particles. The µ influ-ence is evident when data from buffered and unbuffered aqueous solutions with pH = 5.8 and 5.9, respectively, are compared. β Svalues calculat-ed from pH = 5.8 buffered aqueous solutions are much higher than β Svalues calculated from pH= 5.9 unbuffered aqueous solution. Therefore, it indi-cates that the µ of the buffer system play an impor-tant role in the adsorption process.
Adsorption equilibrium experiments were also done. A MB adsorption time of 10 days was used. The influence of the aqueous medium, i.e. pH
and µ, and temperature was also analyzed. The Langmuir model fits well to all isotherms obtained in this study, as it can be seen from in Fig. 5. Figure 5 shows an increase on the adsorbed adsorbate con-centration (q) with the increase of the adsorbate concentration in the liquid phase at the equilibrium (Ceq) up to a Ceqlimit value, after which no further change in q values is observed. The Ceqlimit value is equal to 10 mmol L-1at pH= 5.8 (buffer system). In other hand, the unbuffered system (pH= 5.9) did not reach a Ceqlimit value. The Langmuir isotherm can be written as described below:
Figure 3.Temperature influence in MB adsorption onto RFL from buffered solution at pH = 5.8.
Figure 4.Temperature influence in MB adsorption onto RFL from buffered solution at pH = 4.5.
Ceq (mg L
-1)
Time (days)
Ceq (mg L
-1)
where Ceq is the adsorbate concentration in the liquid phase at equilibrium, q is the adsorbed adsorbate concentration at equilibrium, qmis the adsorbent capacity, KL is a measure of the adsorption intensity (Langmuir constant).
The qmand KLdata for all adsorption equi-librium experiments were obtained from the fit of the experimental data to the Langmuir equation. These results are shown in Tables 2 and 3.
The data from Tables 2 and 3 shows that the adsorption rate behavior do not fit to the adsorption capacity behavior. Data for unbuffered aqueous solution at 30°C are the most particular ones, where the slower process results to an adsorption capacity similar to those obtained from buffered aqueous medium at the same temperature. At the two other temperatures (40 and 50 °C) the adsorption capaci-ty of the RFL in buffered solution is more than three times higher than the corresponding adsorption capacity of the unbuffered aqueous solution. On the other hand, for the unbuffered aqueous solution the higher adsorption capacity occurs at the lower tem-perature (30 °C), and for the buffered aqueous solu-tions the higher adsorption capacity occurs at the higher temperature (50 °C). There is no definite ten-dency of KLdata when the temperature is changed but at a constant temperature it increases in the fol-lowing order: unbuffered aqueous solution (pH = Figure 5. Adsorption isotherms of MB on RFL in
the presence of three different aqueous solutions, as indicated in the figure. Solid lines are theoreti-cal Langmuir isotherms and symbols are experi-mental data.
q (mmol g
-1)
5.9) < buffered aqueous solution (pH = 4.5) <
buffered aqueous solution (pH = 5.8).
In Table 3 it can be observed that, at 30°C, the 0.1 µ gives the higher adsorption capacity. At 50°C this parameter has a little effect on the adsorp-tion capacity, which might indicates that in this con-dition the temperature effect is more important. Comparing the results from unbuffered aqueous solution (pH = 5.9) presented in Table 2 (qm=5.64 mg.g-1at 50°C) with the results from buffered aque-ous solution (pH = 5.8) presented in Table 3 (qm=34.20 mg.g-1at 50°C) it can be concluded that
qmreach’s a maximum at an µ of approximately 0.1. The effect of µ lower than 0.1 in buffered aqueous solution could not be analyzed due to acetic acid/sodium acetate minimum concentrations that are required to prepare the buffer systems.
The Scatchard equation that is described below
is often used to study binding to macromolecules [12]. If the adsorption model considered is valid, a plot of q/Ceqversus q will be linear, the intercept is
KLqm, and the slope is equal to –KL. When the Scatchard plot does not give a unique straight line, this indicates that the binding sites are not identical or are not independent. Figure 6 shows the Scatchard plots for the MB adsorption onto RFL at 30°C. Similar plots were obtained at 40°C and
50°C. Comparing the results from Fig. 6 with the results from Fig. 5, it can be seen that the adsorption data obtained at pH= 5.8, which shows a deviation from the linearity in Fig. 6, corresponds to the isotherm that has achieved the saturation. This behavior is related to the fact that, at higher θ, inter-actions between binding sites become more likely.
The Scatchard’s plots for the adsorption sys-tems under study in the conditions mentioned in Table 2 were analyzed. Table 4 shows the Scatchard parameters, KLand qm.They coincide with the cor-responding Langmuir parameters only in the cases in which two straight lines are obtained, when they are computed from the lower one. In the other cases the Langmuir parameters are always higher than the corresponding Scatchard parameters, indicating Figure 6. Scatchard plots for the adsorption equi-librium of MB onto RFL at 30°C.
q/Ceq (L
g
-1)
that in the first case the final portion of the isotherm is more important and the Scatchard treatment is more sensible to the initial portion of that curve. The non linear Scatchard plots cannot be attributed to higher adsorption capacity or adsorption process rate as can be seen comparing with data in Tables 1 and 2. There are β Sand KLdata of the unbuffered (pH= 5.9) and the buffered (pH= 4.5) aqueous sys-tems in the same interval as the data of buffered aqueous system (pH = 5.8), which show a linear behavior in the Scatchard plot.
To qm data, a full 23 factorial design (three factors, each at two levels) was applied. The stan-dard experimental matrix for the factorial design and the results of qmare shown in Table 5. A statis-tical analysis was performed on these qmresults, and the main effects and interaction effects for the
dif-ferent variable combinations were calculated. The results (Table 6) show that temperature is the most important factor in the MB adsorption. Increasing the µ (A), the adsorption decreases, even when pH
(B) and temperature (C) increases, as showed by the results of interactions AB, AC and ABC.
Conclusions
References
[1] M. L. Richardson, JSDC 99 (1983) 198-200.
[2] G. McKay, H. S. Blair, J. R. Gardner, J. Appl. Polym. Sci. 29 (1984) 1499-1514.
[3] G. McKay, M. S. Otterburn, J. A. Aga, Water, Air and Soil Pollution 24 (1985) 307-322.
[4] M. C. Hwang, K. M. Chen, J. Appl. Polym. Sci. 48 (1993) 48, 299-311.
[5] S. J. Allen, G. K. McKay,Y. J. H. Khader, J. Colloid and Interface Sci. 126 (1988) 517-524.
[6] H. M. Asfour, O. A. Fadali, M. M. M. S. El-Geundi, J. Chem. Technol. Biotechnol. 35A (1) (1985) 21-27.
[7] J. Lebek, W. Wardas, Cellulose Chem. Technol. 30 (1996) 213-221.
[8] W. Wardas, J. Lebek, Cellulose Chem. Technol. 28(3) (1994) 255-263.
[9] A. F. Nikiforov, O. V. Lokai, V. V. Pushkarev, Khim. Tekhnol. Vody. 9(1) (1987) 73-76.
[10] M. A. Hashim, K. H. Chu, P. S. Tsan, J. Chem. Tech. Biotechnol. 62 (1995) 253-260.
[11] G. McKay, I. F. McConvey, J. Chem. Tech. Biotechnol. 31 (1981) 401-408.
[12] JR. I. Tinoco, K. Sauer, J. C. Wang, Physical Chemistry – Principles and Applications in Biological Sciences, 3rd. Ed., Prentice – Hall Inc., New Jersey, 1995, chap. 5.
Langmuir model. The general tendencies observed with the adsorption capacity are:
- It decreases when the µ increases in the range of 0.1 to 1.0,
- It increases when the temperature increases in the range of 30 to 50°C,
- It increases when the pHincreases in the range from 4.5 to 5.8, in buffered aqueous solutions. - The faster adsorption and higher capacity
were observed at 50°C, pH= 5.8 and 0.1 of µ, for which interactions between binding sites were detected through Scatchard analysis. - µ is a very important variable especially at
30oC in all pHvalues studied. Increasing I, q
m decreases dramatically at this temperature. - The qm values of methylene blue adsorbed
onto reticulated lignin from sugar cane bagasse can be described by the equation - qm= 14.75 – 0.5(I) + 6.00(pH) – 1.00(I)(pH) +
20.00(t) + 2.50(I)(t) + 6.00 (pH)(t) – 1.00(I) (pH)(t)
- when the experiments are carried out according to the factorial design described in Table 5. - The adsorption of MB onto RFL is exothermic
process when it is carried out at pH= 5.8 - It is possible to prepare adsorbents at low cost
from lignin that can adsorb methylene blue, since sugar cane bagasse is relatively cheap material and it can be found in any region of in Brazil.
Acknowledgements
NCF acknowledge FAPESP (proc. No 06/58872-0), and Embrapa – Instrumentação Agropecuária. EAGP and AAWH acknowledge DQI – UEM and grants from CNPq proc.500.527/95-0 and 300.694/90-3.
Received 11 September 2007 Accepted 22 November 2007
N. Consolin Filho, E. C. Venancio, M. F. Barriquello, A. A. W. Hechenleitner, E. A. G. Pineda, Adsorção de azul de metileno em lignina modificada obtida do bagaço de cana de açúcar.
Resumo: Estudou-se neste trabalho, a cinética de adsorção e o equilíbrio de adsorção do azul de metileno (AM) em lignina fórmica reticulada (LFR) obtida do bagaço de cana de açúcar. O processo de adsorção é dependente do pH, temperatura e força iônica (µ) e obedece ao modelo de Langmuir. Algumas condições como a alta capacidade e velocidade de adsorção foram determinadas. Observou-se rápida adsorção (12 horas) e alta capacidade de adsorção (34,20 mg.g-1) em pH = 5,8(tampão aceta-to de sódio-ácido acético), 50oC e 0,1 de força iônica. Para alcançar o equilíbrio de adsorção, o sistema foi termostatizado com tempos de 1 a 10 dias, com agitação ocasional.