Height-Balancing for Performance
in Metric Access Methods
∗
Marcos R. Vieira, Caetano Traina Jr., Fabio J. T. Chino, Agma J. M. Traina
ICMC – Institute of Mathematics and Computer Sciences USP – University of Sao Paulo at Sao Carlos
Avenida do Trabalhador Sao-Carlense, 400 CEP 13560-970 – Sao Carlos – SP – Brazil {mrvieira, caetano, chino, agma}@icmc.usp.br
Abstract
Metric Access Methods (MAM) are employed to ac-celerate the processing of similarity queries, such as the range and thek-nearest neighbor queries. Current meth-ods, such as the Slim-tree and the M-tree, improve the query performance minimizing the number of disk ac-cesses, keeping a constant height of the structures stored on disks (height-balanced trees). However, the overlap-ping between their nodes has a very high influence on their performance. This paper presents a new dynamic MAM called theDBM-tree (Density-Based Metric tree), which can minimize the overlap between high-density nodes by relaxing the height-balancing of the structure. Thus, the height of the tree is larger in denser regions, in order to keep a tradeoff between breadth-searching and depth-searching. An underpinning for cost estimation on tree structures is their height, so we show a non-height dependable cost model that can be applied for DBM-tree. Moreover, an optimization algorithm calledShrinkis also presented, which improves the performance of an already builtDBM-treeby reorganizing the elements among their nodes. Experiments performed over both synthetic and real world datasets showed that theDBM-treeis, in av-erage, 50% faster than traditional MAM and reduces the number of distance calculations by up to 72% and disk accesses by up to 66%. After performing theShrink algo-rithm, the performance improves up to 40% regarding the number of disk accesses for range and k-nearest neigh-bor queries. In addition, the DBM-tree scales up well, exhibiting linear performance with growing number of el-ements in the database.
Keywords:Metric Access Method, Metric Tree,
In-∗This work has been supported byFAPESP(S˜ao Paulo State Research
Foundation) under grants 01/11987-3, 01/12536-5 and 02/07318-1 and byCNPq(Brazilian National Council for Supporting Research) under grants 52.1685/98-6, 860.068/00-7, 50.0780/2003-0 and 35.0852/94-4.
dexing, Similarity Queries.
1. Introduction
The volume of data managed by the Database Man-agement Systems (DBMS) is continually increasing. Moreover, new complex data types, such as multimedia data (image, audio, video and long text), geo-referenced information, time series, fingerprints, genomic data and protein sequences, among others, have been added to DBMS.
The main technique employed to accelerate data re-trieval in DBMS is indexing the data using Access Methods (AM). The data domains used by traditional databases, i.e. numbers and short character strings, have the total ordering property. Every AM used in traditional DBMS to answer both equality (=and6=) and relational ordering predicates (≤,<,≥and>), such as the B-trees, are based on this property.
Unfortunately, the majority of complex data domains do not have the total ordering property. The lack of this property precludes the use of traditional AM to index complex data. Nevertheless, these data domains allow the definition of similarity relations among pairs of ob-jects. Similarity queries are more natural for these data domains. For a given reference object, also called the query center object, a similarity query returns all objects that meet a given similarity criteria. Traditional AM rely on the total ordering relationship only, and are not able to handle these complex data properly, neither to answer similarity queries over such data. These restrictions led to the development of a new class of AM, the Metric Ac-cess Methods (MAM), which are well-suited to answer similarity queries over complex data types.
[9] were developed to answer similarity queries based on the similarity relationships among pairs of objects. The similarity (or dissimilarity) relationships are usually rep-resented by distance functions computed over the pairs of objects of the data domain. The data domain and distance function defines a metric space or metric domain.
Formally, a metric space is a pair<S, d()>, where S is the data domain andd()is a distance function that
complies with the following three properties:
1. symmetry:d(s1, s2)=d(s2, s1);
2. non-negativity: 0< d(s1, s2)<∞ifs1 6=s2and
d(s1, s1) = 0; and
3. triangular inequality: d(s1, s2) ≤ d(s1, s3) +
d(s3, s2),
∀s1, s2, s3∈S. A metric datasetS⊂Sis a set of objects
si ∈Scurrently stored in a database. Vectorial data with
aLpdistance function, such as Euclidean distance (L2), are special cases of metric spaces. The two main types of similarity queries are:
• Range query - Rq: given a query center object sq ∈Sand a maximum query distancerq, the query Rq(sq, rq)retrieves every objectsi ∈ S, such that d(si, sq)≤rq. An example is: “Select the proteins
that are similar to the protein P by up to 5 purine bases”, which is represented asRq(P,5);
• k-Nearest Neighbor query -kN N q: given a query center object sq ∈ S and an integer value k ≥ 1,
the querykN N q(sq, k)retrieves thekobjects inS
that have the smallest distance from the query ob-jectsq, according to the distance function d(). An
example is: “Select the 3 protein most similar to the proteinP”, wherek=3, which is represented as kN N q(P,3).
This paper presents a new dynamic MAM called DBM-tree (Density-Based Metric tree), which can min-imize the overlap of nodes storing objects in high-density regions relaxing the height-balance of the structure. Therefore, the height of a DBM-tree is larger in higher-density regions, in order to keep a compromise between the number of disk accesses required to breadth-search various subtrees and to depth-searching one subtree. As the experiments will show, the DBM-tree presents better performance to answer similarity queries than the rigidly balanced trees. This article also presents an algorithm to optimize DBM-trees, called Shrink, which improves the performance of these structures reorganizing the elements among the tree nodes.
The experiments performed over synthetic and real datasets show that the DBM-tree outperforms the tradi-tional MAM, such as the Slim-tree and the M-tree. The
DBM-tree is, in average, 50% faster than these traditional balanced MAM, reducing up to 66% the number of disk accesses and up to 72% the number of distance calcula-tions required to answer similarity queries. The Shrink algorithm, helps to achieve improvements of up to 40% in number of disk accesses to answer range andk-nearest neighbor queries. Moreover, the DBM-tree is scalable, exhibiting linear behavior in the total processing time, the number of disk accesses and the number of distance cal-culations regarding the number of indexed elements.
A preliminary version of this paper was presented at SBBD 2004 [20]. Here, we show a new split algorithm for the DBM-tree. Additionally, this paper shows an ac-curate cost function for the DBM-tree using only informa-tion easily derivable from the tree, thus providing a cost function that does not depend upon a constant tree-height. A cost function is fundamental to enable the DBM-tree to be employed in real DBMS. Every tree-based AM used in existing DBMS uses the height of the tree as the main pa-rameter to optimize a query plan. As the DBM-tree does not have a reference height, every existing theory about query plan optimizations are knocked out when using a DBM-tree. Therefore, the cost function presented in this paper is a fundamental requirement to enable using DBM-trees in a real DBMS.
The remainder of this paper is structured as follows: Section 2 presents the basic concepts and Section 3 sum-marizes the related works. The new metric access method DBM-tree is presented in Section 4. Section 5 describes the experiments performed and the results obtained. Fi-nally, Section 6 gives the conclusions of this paper and suggests future works.
2. Basic Concepts
Access Methods(AM) are used by DBMS to improve performance on retrieval operations. The use of meaning-ful properties from the objects indexed is fundamental to achieve the improvements. Using properties of the data domain, it is possible to discard large subsets of data with-out comparing every stored object with the query object. For example, consider the case of numeric data, where the total ordering property holds: this property allows divid-ing the stored numbers in two sets: those that are larger and those that are smaller than or equal to the query ref-erence number. Hence, the fastest way to perform the search is maintaining the numbers sorted. Thus, when a search for a given number is required, comparing this number with a stored one enables discarding further com-parisons with the part of the data where the number cannot be in.
node, determining which subtrees need to be traversed, recursively repeating this process for each subtree that is able to store answers.
Notice that whenever the total ordering property ap-plies, only a subtree at each tree level can hold the an-swer. If the data domain has only a partial ordering prop-erty, then it is possible that more than one subtree need to be analyzed in each level. As numeric domains pos-sess the total ordering property, the trees indexing num-bers requires the access of only one node in each level of the structure. On the other hand, trees storing spatial coordinates, which have only a partial ordering property, require searches in more than one subtree in each level of the structure. This effect is known as covering, or overlap-ping between subtrees, and occurs for example in R-trees [12].
Hierarchical structures can be classified as (height-)balanced or unbalanced. In the balanced structures, the height of every subtree is the same, or at most changes by a fixed amount.
The nodes of an AM used in a DBMS are stored in disk using fixed size registers. Storing the nodes in disk is essential to warrant data persistence and to allow handling any number of objects. However, as disk accesses are slow, it is important to keep the number of disk accesses required to answer queries small.
Traditional DBMS build indexes only on data holding the total ordering property, so if a tree grows deeper, more disk accesses are required to traverse it. Therefore it is im-portant to keep every tree the shallowest possible. When a tree is allowed to grow unbalanced, it is possible that it degenerates completely, making it useless. Therefore, only balanced trees have been widely used in traditional DBMS.
A metric tree divides a dataset into regions and chooses objects called representatives or centers to rep-resent each region. Each node stores the reprep-resentatives, the objects in the covered region, and their distances to the representatives. As the stored objects can be repre-sentatives in other nodes, this enables the structure to be organized hierarchically, resulting in a tree. When a query is performed, the query object is first compared with the representatives of the root node. The triangular inequality is then used to prune subtrees, avoiding distance calcula-tions between the query object and objects or subtrees in the pruned subtrees. Distance calculations between com-plex objects can have a high computational cost. There-fore, to achieve good performance in metric access meth-ods, it is vital to minimize also the number of distance calculations in query operations.
Metric access methods exhibits the node overlapping effect, so the number of disk accesses depends both on the height of the tree and on the amount of overlapping. In this case, it is not worthwhile reducing the number of lev-els at the expense of increasing the overlapping. Indeed, reducing the number of subtrees that cannot be pruned at each node access can be more important than keep the
tree balanced. As more node accesses also requires more distance calculations, increasing the pruning ability of a MAM becomes even more important. However, no pub-lished access method took this fact into account so far.
The DBM-tree presented in this paper is a dynamic MAM that relax the usual rule that imposes a rigid height-balancing policy, therefore trading a controlled amount of unbalancing at denser regions of the dataset for a reduced overlap between subtrees. As our experiments show, this tradeoff allows an overall increase in performance when answering similarity queries.
3. Related Works
Plenty of Spatial Access Methods (SAM) were pro-posed for multidimensional data. A comprehensive sur-vey showing the evolution of SAM and their main con-cepts can be found in [11]. However, the majority of them cannot index data in metric domains, and suffer from the dimensionality curse, being efficient to index only low-dimensional datasets.
An unbalanced R-tree called CUR-tree (Cost-Based Unbalanced R-tree) was proposed in [16] to optimize query executions. It uses promotion and demotion to move data objects and subtrees around the tree taking into account a given query distribution and a cost model for their execution. The tree is shallower where the most fre-quent queries are posed, but it needs to be reorganized ev-ery time a quev-ery is executed. This technique works only in SAM, making it infeasible to MAM.
Considering cost models, a great deal of work were also published regarding SAM [17]. However they rely on data distribution in the space and other spatial properties, what turns them infeasible for MAM.
The techniques of recursive partitioning of data in metric domains proposed by Burkhard and Keller [5] were the starting point for the development of MAM. The first technique divides the dataset choosing one represen-tative for each subset, grouping the remaining elements according to their distances to the representatives. The second technique divides the original set in a fixed num-ber of subsets, selecting one representative for each sub-set. Each representative and the biggest distance from the representative to all elements in the subset are stored in the structure to improve nearest-neighbor queries.
similarity queries than the VP-tree. The GH-tree (Gener-alized Hyper-plane tree) [19] is another method that re-cursively partitions the dataset in two groups, selecting two representatives and associating the remaining objects to the nearest representative.
The GNAT (Geometric Near-Neighbor Access tree) [4] can be viewed as a refinement of the second tech-nique presented in [5]. It stores the distances between pairs of representatives, and the biggest distance between each stored object to each representative. The tree uses these data to prune distance calculations using the trian-gular inequality.
All MAM for metric datasets discussed so far are static, in the sense that the data structure is built at once using the full dataset, and new insertions are not allowed afterward. Furthermore, they only attempt to reduce the number of distance calculations, paying no attention on disk accesses. The M-tree [9] was the first MAM to over-come this deficiency. The M-tree is a height-balanced tree based on the second technique of [5], with the data ele-ments stored in leaf nodes.
A cost model based only in the distance distributions of the dataset and information of the M-tree nodes is pro-vided in [8].
The Slim-Tree [15] is an evolution from the M-Tree, embodying the first published method to reduce the amount of node overlapping, called theSlim-Down.
The use of multiple representatives called, “omni-foci”, was proposed in [10] to generate a coordinate sys-tem of the objects in the dataset. The coordinates can be indexed using any SAM, ISAM (Indexed Sequential Access Method), or even sequential scanning, generating a family of MAM called the “Omni-family”. Two good surveys on MAM can be found in [7] and [13].
The MAM described so far build height-balanced trees aiming to minimize the tree height at the expense of little flexibility to reduce node overlap. The DBM-tree proposed in this paper is the first MAM which keep a tradeoff between breadth-searching and depth-searching to allows trading height-balancing with overlap reduction, to achieve better overall search performance.
4. The MAM DBM-tree
The DBM-tree is a dynamic MAM that grows bottom-up. The objects of the dataset are grouped into fixed size disk pages, each page corresponding to a tree node. An object can be stored at any level of the tree. Its main in-tent is to organize the objects in a hierarchical structure using a representative object as the center of each mini-mum bounding region that covers the objects in a subtree. An object can be stored in a node if the covering radius of the representative covers it.
Unlike the Slim-tree and the M-tree, there is only one type of node in the DBM-tree. There are no distinctions between leaf and index nodes. Each node has a
capac-ity to hold up toC entries, and it stores a fieldCef f to
count how many entries si are effectively stored in that
node. An entry can be either a single object or a sub-tree. A node can have subtree entries, single object en-tries, or both. Single objects cannot be covered by any of the subtrees stored in the same node. Each node has one of its entries elected to be a representative. If a subtree is elected, the representative is the center of the root node of the subtree. The representative of a node is copied to its immediate parent node, unless it is already the root node. Entries storing subtrees have: one representative objectsi
that is the representative of thei-th subtree, the distance between the node representative and the representative of the subtreed(srep, si), the linkP tripointing to the node
storing that subtree and the covering radius of the subtree Ri. Entries storing single objects have: the single object sj, the identifier of this objectOIdjand the distance
be-tween the object representative and the objectd(srep, sj).
This structure can be represented as:
Node[Cef f, array [1..Cef f] of|< si,d(srep, si),Ptri, Ri>or< sj,OIdj,d(srep, sj)>|]
In this structure, the entrysiwhosed(srep, si) = 0holds
the representative objectsrep.
4.1. Building the DBM-tree
The DBM-tree is a dynamic structure, allowing to in-sert new objects at any time after its creation. When the DBM-tree is asked to insert a new object, it searches the structure for one node qualified to store it. A qualifying node is one with at least one subtree that covers the new object. TheInsert()algorithm is shown as Algorithm 1. It starts searching in the root node and proceeds searching recursively for a node that qualifies to store the new ob-ject. The insertion of the new object can occur at any level of the structure. In each node, the Insert() algorithm uses theChooseSubtree()algorithm (line 1), which re-turns the subtree that better qualifies to have the new ob-ject stored. If there is no subtree that qualifies, the new object is inserted in the current node (line 9). The DBM-tree provides two policies for the ChooseSubtree() al-gorithm:
• Minimum distance that covers the new object (minDist): among the subtrees that cover the new object, choose the one that has the smallest distance between the representative and the new object. If there is not an entry that qualifies to insert the new object, it is inserted in the current node;
Algorithm 1Insert()
Require: P trt: pointer to the subtree where the new objectsnwill be
inserted.
sn: the object to be inserted.
Ensure: Insert objectsnin theP trtsubtree.
1: ChooseSubtree(P trt, sn)
2: ifThere is a subtree that qualifiesthen
3: Insert(P tri, sn)
4: ifThere is a promotionthen
5: Update the new representatives and their information. 6: Insert the object set not covered for node split in the current
node.
7: forEach entrysinow covered by the updatedo
8: Demote entrysi.
9: else ifThere is space in current nodeP trtto insertsnthenInsert
the new objectsnin nodeP trt.
10: elseSplitN ode(P trt, sn)
The policy chosen by the ChooseSubtree() algo-rithm has a high impact on the resulting tree. TheminDist policy tends to build trees with smaller covering radii, but the trees can grow higher than the trees built with the minGDistpolicy. TheminGDistpolicy tends to produce shallower trees than those produced with theminDist pol-icy, but with higher overlap between the subtrees.
If the node chosen by theInsert()algorithm has no free space to store the new object, then all the existing en-tries together with the new object taken as a single object must be redistributed between one or two nodes, depend-ing on the redistribution option set in theSplitN ode()
algorithm (line 10). TheSplitN ode()algorithm deletes the nodeP trtand remove its representative from its
par-ent node. Its former par-entries are then redistributed between one or two new nodes, and the representatives of the new nodes together with the set of entries of the former node P trtnot covered by the new nodes are promoted and
in-serted in the parent node (line 6). Notice that the set of entries of the former node that are not covered by any new node can be empty. The DBM-tree has three op-tions to choose the representatives of the new nodes in theSplitN ode()algorithm:
• Minimum of the largest radii (minMax): this op-tion distributes the entries into at most two nodes, allowing a possibly null set of entries not covered by these two nodes. To select the representatives of each new node, each pair of entries is considered as can-didate. For each pair, this option tries to insert each remaining entry into the node having the represen-tative closest to it. The chosen represenrepresen-tatives will be those generating the pair of radii whose largest radius is the smallest among all possible pairs. The computational complexity of the algorithm execut-ing this option isO(C3
), whereC is the number of entries to be distribute between the nodes;
• Minimum radii sum(minSum): this option is sim-ilar to theminMax, but the two representatives se-lected is the pair with the smallest sum of the two covering radii;
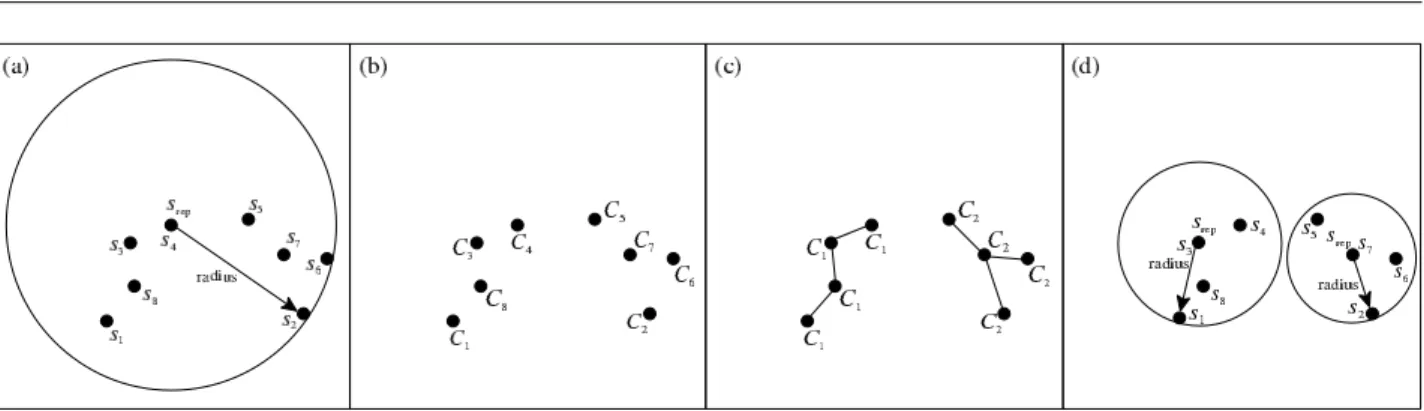
• 2-Clusters: this option tries to build at most two groups. These groups were built choosing objects that minimizes the distances inside each group, or-ganizing them as a minimal spanning tree. This op-tion is detailed as Algorithm 2. The first step of this algorithm is the creation of C groups, each one of only one entry. The second step is joining each group with its nearest group. This step finishes when only 2 groups remain (line 2). The next step checks if there is a group with only one object then it will be inserted in the upper level (line 4). A representative object is chosen (line 5) for each remaining group, and nodes are created to store their objects (line 6). The representatives and all their information are pro-moted to the next upper level. Figure 1 illustrates this approach applied to a bi-dimensional vector space. The node to be split is presented in Figure 1(a). Af-ter building the Cgroups (Figure 1(b)), the groups are joined to form 2 groups (Figure 1(c)). Figure 1(d) presets the two resulting nodes after the split by the2-Clustersapproach.
The minimum node occupation is set when the struc-ture is created, and this value must be between one ob-ject and at most half of the node capacity C. If the ChooseSubT ree policy is set tominGDist then all the Centries must be distributed between the two new nodes created by theSplitN ode()algorithm. After defining the representative of each new node, the remaining entries are inserted in the node with the closest representative. After distributing every entry, if one of the two nodes stores only the representative, then this node is destroyed and its sole entry is inserted in its parent node as a single ob-ject. Based on the experiments and in the literature [9], splits leading to an unequal number of entries in the nodes can be better than splits with equal number of entries in each node, because it tends to minimize overlap between nodes.
If theChooseSubT reepolicy is set to minDist and the minimum occupation is set to a value lower than half of the node capacity, then each node is first filled with this minimum number of entries. After this, the remaining entries will be inserted into the node only if its covering radius does not increase the overlapping regions between the two. The rest of the entries, that were not inserted into the two nodes, are inserted in the parent node.
Algorithm 22-Clusters()
Require: Centries to be redistributed in nodes.
Ensure: A representative set (RepSet) and a entry set to be inserted in the upper level (PromoSet).
1: BuildCgroups.
2: Try to join, one by one, theCgroups, until only 2 groups remain. 3: foreach group that have unique entries.do
4: Insert the unique entries inPromoSet. 5: end for
Figure 1. Exemplifying a node split using the2-Clusters()algorithm: (a) before the split, (b) formingCgroups with unique nodes, (c) 2 final groups, and (d) the final nodes created with the chosen representatives.
Splittings promote the representative to the parent node, which in turn can cause other splittings. After the split propagation in Algorithm 1 (promotion - line 4) or the update of the representative radii (line 5), it can oc-cur that former uncovered single object entries are now covered by the updated subtree. In this case each of these entries is removed from the current node and reinserted into the subtree that covers it (demotion in lines 7 and 8).
4.2. Similarity Queries in the DBM-tree
The DBM-tree can answer the two main types of simi-larity queries: Range query (Rq) andk-Nearest Neighbor query (kN N q). Their algorithms are similar to those of the Slim-tree and the M-tree.
TheRq()algorithm for the DBM-tree is described as Algorithm 3. It receives as input parameters a tree node P trt, the query center sq and the query radiusrq. All
entries in P trt are checked against the search condition
(line 2). The triangular inequality allows pruning subtrees and single objects that do not pertain to the region defined by the query. The entries that cannot be pruned in this way have their distance to the query object (line 3) calculated. Each entry covered by the query (line 4) is now processed. If it is a subtree, it will be recursively analyzed by the Rqalgorithm (line 5). If the entry is an object, then it is added to the answer set (line 6). The end of the process returns the answer set including every object that satisfies the query criteria.
Algorithm 3Rq()
Require: P trttree to be perform the search, the query objectsqand
the query radiusrq.
Ensure: Answer setAnswerSetwith all objects satisfying the query conditions.
1: forEachsi∈P trt do
2: if|d(srep, sq)−d(srep, si)| ≤rq+Rithen
3: Calculatedist=d(si, sq)
4: ifdist≤rq+Rithen
5: ifsiis a subtreethenRq(P tri, sq, rq)
6: elseAnswerSet.Add(si).
7: end if
8: end if
9: end for
ThekN N q()algorithm, described as Algorithm 4, is similar to Rq(), but it requires a dynamic radiusrk to
perform the pruning. In the beginning of the process, this radius is set to a value that covers all the indexed objects (line 1). It is adjusted when the answer set is first filled withkobjects, or when the answer set is changed there-after (line 12). Another difference is that there is a pri-ority queue to hold the not yet checked subtrees from the nodes. Entries are checked processing the single objects first (line 4 to 12) and then the subtrees (line 13 to 18). Among the subtrees, those closer to the query object that intersect the query region are checked first (line 3). When an object closer than thekalready found is located (line 8), it substitutes the previous farthest one (line 11) and the dynamic radius is adjusted (diminished) to tight fur-ther pruning (line 12).
4.3. TheShrink()optimization Algorithm
A special algorithm to optimize loaded DBM-trees was created, called Shrink(). This algorithm aims at shrinking the nodes by exchanging entries between nodes to reduce the amount of overlapping between subtrees. Reducing overlap improves the structure, which results in a decreased number of distance calculations, total pro-cessing time and number of disk accesses required to an-swer bothRqandkN N qqueries. During the exchanging of entries between nodes, some nodes can retain just one entry, so they are promoted and the empty node is deleted from the structure, further improving the performance of the search operations.
TheShrink()algorithm can be called at any time dur-ing the evolution of a tree, as for example, after the inser-tion of many new objects. This algorithm is described as Algorithm 5.
The algorithm is applied in every node of a DBM-tree. The input parameter is the pointerP trtto the subtree to
Algorithm 4kN N q()()
Require: root nodeP trroot, the query objectsqand number of
ob-jectsk.
Ensure: Answer set with all objects satisfying the query conditions. 1: rk=∞
2: P riorityQueue.Add(P trroot,0)
3: while((N ode=P riorityQueue.F irst())<=rk)do
4: foreachsi∈N odedo
5: ifsiis a single objectthen
6: if|d(srep, sq)−d(srep, si)| ≤rkthen
7: Calculatedist=d(si, sq)
8: ifdist≤rkthen
9: AnswerSet.Add(si).
10: ifAnswerSet.Elements()≥kthen
11: AnswerSet.Cut(k).
12: rk=AnswerSet.M axDistance().
13: end if
14: end if
15: end if
16: end if
17: end for
18: foreachsi∈N odedo
19: ifsiis a subtreethen
20: if|d(srep, sq)−d(srep, si)| ≤rk+Rithen
21: Calculatedist=d(si, sq)
22: ifdist≤rk+Rithen
23: P riorityQueue.Add(si, dist).
24: end if
25: end if
26: end if
27: end for
28: end while
assures that no cyclic exchanges can lead to a dead loop. It was experimentally verified that a larger number of ex-changes does not improve the results. For each entrysain
nodeP trt(line 2), the farthest entry from the node
repre-sentative is set asi(line 3). Then search another entrysb
inP trtthat can store the entryi(line 5). If such a node
exists, remove ifromsa and reinsert it in nodesb (line
6). If the exchange makes nodesa empty, it is deleted,
as well as its entry in nodeP trt(line 7). If this does not
generate an empty node, it is only needed to update the reduced covering radius of entrysain nodeP trt(line 8).
This process is recursively applied over all nodes of the tree (line 9 and 10). After every entry inP trthas been
verified, the nodes holding only one entry are deleted and its single entry replaces the node inP trt(line 11).
4.4. A Cost Model for DBM-tree
Cost models for search operations in trees usually rely on the tree height. Such cost models does not apply for the DBM-tree. However, an AM requires a cost model in or-der to be used in a DBMS. Therefore, we developed a cost model for the DBM-tree, based on statistics of each tree node. The proposed approach does not rely on the data distribution, but rather on the distance distribution among objects. The cost model developed assumes that the ex-pected probabilityP()of a nodeP trtto be accessed is
equal to the probability of the node radiusRP trt plus the
query radiusrq be greater or equal to the distance of the
node representative srepof P trt to the query objectsq.
The probability of P trt to be accessed can therefore be
Algorithm 5Shrink() Require: P trttree to optimize.
Ensure: P trttree optimized.
1: whileThe number of exchanges does not exceed 3 times the num-ber of entries inP trtnode or no exchanges occurred the previous
iterationdo
2: forEach subtree entrysain nodeP trtdo
3: Set entryifromsaas the farthest from thesarepresentative.
4: forEach entrysbdistinct fromsainP trtdo
5: ifThe entryiofsais covered by nodesband this node
has enough space to storeithen
6: Remove the entryifromsaand reinsert it insb.
7: end if
8: end for
9: ifnodesais emptythendelete nodesaand delete the entry
safromP trt.
10: elseUpdate the radius of entrysainP trt.
11: end for
12: end while
13: forEachsasubtree in nodeP trtdo
14: Shrink(sa).
15: ifnodesahas only one entrythenDelete nodesaand update
the entrysainP trt.
16: end for
expressed as:
P(P trt) =P(RP trt+rq ≥d(srep, sq)) (1)
We assume that every object has a distribution of dis-tances to the other objects in the dataset, in average, sim-ilar to the distribution of the other objects. Thus, For-mula (1) can be approximated by a normalized histogram Hist()of the distance distribution instead of computing the distance of the query object to the node representative. Therefore
P(P trt)≈Hist(RP trt+rq) (2)
whereHist()is an equi-width histogram of the distances among pairs of objects of the dataset.
The histogram can be computed calculating the av-erage number of distances falling at the range defined at each histogram bin, for every object in the dataset, or only for a small unbiased sample of the dataset. Thereafter, to calculate the expected number of disk accesses (DA) for anyRq, it is sufficient to sum the above probabilities over allNnodes of a DBM-tree, as:
DA(Rq(sq, rq)) = N
X
i=1
Hist(RP tri+rq) (3)
The cost to keep the histogram is low and requires a small amount of main memory to maintain the histogram. Moreover, if it is calculated over a fixed size sample of the database, it is linear on the database size, making it scalable for the database size.
datasets, with varying properties that affects the behav-ior of a MAM. Among these properties are the embed-ded dimensionality of the dataset, the dataset size and the distribution of the data in the metric space. Table 1 presents some illustrative datasets used to evaluate the DBM-tree performance. The dataset name is indicated with its total number of objects (# Objs.), the embed-ding dimensionality of the dataset (E), the page size in KBytes (Pg), and the composition and source description of each dataset. The multidimensional datasets uses the Euclidean distanceL2, and theMedHistodataset uses the metric-histogramMhistodistance [18].
The DBtree was compared with Slim-tree and M-tree, that are the most known and used dynamics MAM. The Slim-tree and the M-tree were configured using their best recommended setup. They are: minDist for the ChooseSubtre()algorithm, minMax for the split algo-rithm and the minimal occupation set to 25% of node ca-pacity. The results for the Slim-tree were measured after the execution of theSlim−Down()optimization algo-rithm.
We tested the DBM-tree considering four distinct con-figurations, to evaluate its available options. The tested configurations are the following:
• DBM-MM:minDistfor theChooseSubtree() algo-rithm, minMaxfor theSplitN ode()algorithm and minimal occupation set to 30% of node capacity;
• DBM-MS: equal toDBM-MM, except using the op-tionminSumfor theSplitN ode()algorithm;
• DBM-GMM:minGDistforChooseSubtree(), min-MaxforSplitN ode();
• DBM-2CL: minGDist for ChooseSubtree(), 2-ClustersforSplitN ode().
All measurements were performed after the execution of theShrink()algorithm.
The computer used for the experiments was an Intel Pentium III 800MHz processor with 512 MB of RAM and 80 GB of disk space, running the Linux operating system. The DBM-tree, the Slim-tree and the M-tree MAM were implemented using the C++ language into the Arbore-tum MAM library (www.gbdi.icmc.usp.br/arboreArbore-tum), all with the same code optimization, to obtain a fair compar-ison.
From each dataset it was extracted 500 objects to be used as query centers. They were chosen randomly from the dataset, and half of them (250) were removed from the dataset before creating the trees. The other half were copied to the query set, but maintained in the set of ob-jects inserted in the trees. Hence, half of the query set belongs to the indexed dataset by the MAM and the other half does not, allowing to evaluate queries with centers indexed or not. However, as the query centers are in fact objects of the original dataset, the set of queries closely
follows the queries expected to be posed by a real appli-cation. Each dataset was used to build one tree of each type, creating a total of thirty trees. Each tree was built in-serting one object at a time, counting the average number of distance calculations, the average number of disk ac-cesses and measuring the total building time (in seconds). In the graphs showing results from the query evaluations, each point corresponds to performing 500 queries with the same parameters but varying query centers. The num-berkfor thekN N qqueries varied from 2 to 20 for each measurement, and the radius varied from 0.01% to 10% of the largest distance between pairs of objects in the dataset, because they are the most meaningful range of radii asked when performing similarity queries. TheRqgraphics are inlogscale for the radius abscissa, to emphasize the most relevant part of the graph.
5.1. Evaluating the tree building process
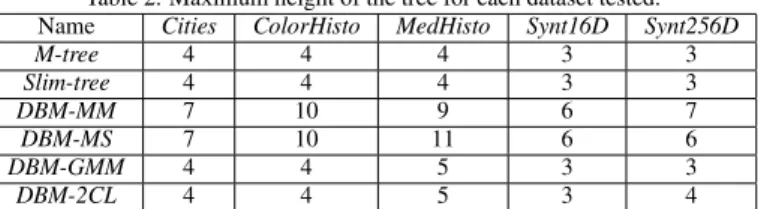
The building time and the maximum height were mea-sured for every tree. The building time of the 6 trees were similar for each dataset. It is interesting to compare the maximum height of the various DBM-tree options and the balanced trees, so they are summarized in Table 2.
The maximum height for theDBM-MMand the DBM-MS trees were bigger than the balanced trees in every dataset. The biggest difference was in the ColorHisto, with achieved a height of 10 levels as compared to only 4 levels for the Slim-tree and the M-tree. However, as the other experiments show, this higher height does not in-creases the number of disk accesses. In fact, those DBM-trees did, in average, less disk accesses than the Slim-tree and M-tree, as is shown in the next subsection.
It is worth to note that, although theDBM-GMMtrees do not force the height-balance, the maximum height in these trees were equal or very close to those of the Slim-tree and the M-Slim-tree. This fact is an interesting result that corroborates our claim that the height-balance is not as important for MAM as it is for the overlap-free structures.
Table 1. Description of the synthetic and real-world datasets used in the experiments. Name # Objs. E Pg Description
Cities 5,507 2 1 Geographical coordinates of the Brazilian cities (www.ibge.gov.br).
ColorHisto 68,040 32 8 Color image histograms from the KDD repository of the University of California at Irvine (http://kdd.ics.uci.edu). The metric returns the distance between two objects in a 32-d Euclidean space.
MedHisto 4,247 - 4 Metric histograms of medical gray-level images. This dataset is adimensional and was generated at GBDI-ICMC-USP. For more details on this
dataset and the metric used see [18].
Synt16D 10,000 16 8 Synthetic clustered datasets consisting of 16-dimensional vectors normally-distributed (withσ=0.1) in 10 clusters over the unit hypercube. The process to generate this dataset is described in [9].
Synt256D 20,000 256 128 Similar toSynt16D, but it is with 20 clusters (withσ=0.001) in a 256-dhypercube.
Table 2. Maximum height of the tree for each dataset tested.
Name Cities ColorHisto MedHisto Synt16D Synt256D
M-tree 4 4 4 3 3
Slim-tree 4 4 4 3 3
DBM-MM 7 10 9 6 7
DBM-MS 7 10 11 6 6
DBM-GMM 4 4 5 3 3
DBM-2CL 4 4 5 3 4
5.2. Performance of query execution
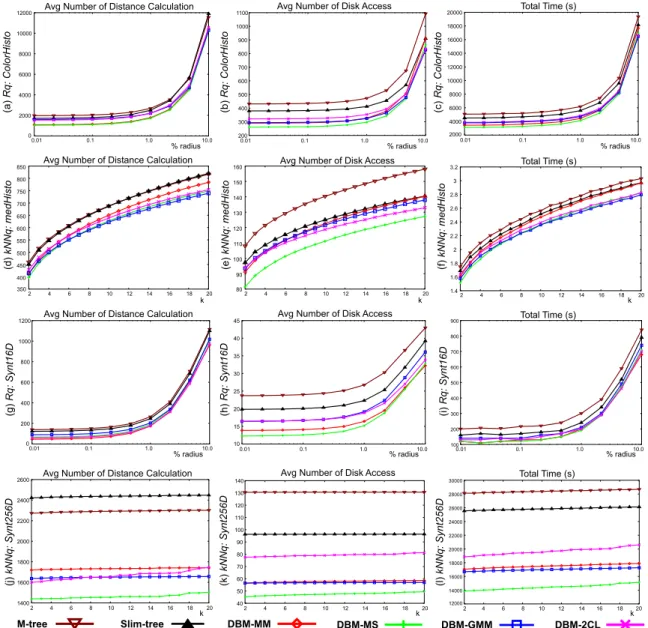
We present the results obtained comparing the DBM-tree with the best setup of the Slim-DBM-tree and the M-DBM-tree. In this paper we present the results from four meaningful datasets (ColorHisto,MedHisto,Synt16DandSynt256D), which are or high-dimensional or non-dimensional (met-ric) datasets, and gives a fair sample of what happened. The main motivation in these experiments is evaluating the DBM-tree performance with its best competitors with respect to the 2 main similarity query types: rangeRqand k-nearest neighborskN N q.
Figure 4 shows the measurements to answerRq and kN N q on these 4 datasets. The graphs on the first col-umn (Figures 4(a), (d), (g) and (j)) show the average num-ber of distance calculations. It is possible to note in the graphs that every DBM-tree executed in average a smaller number of distance calculations than Slim-tree and M-tree. Among all, theDBM-MS presented the best result for almost every dataset. No DBM-tree executed more distance calculations than the Slim-tree or the M-tree, for any dataset. The graphs also show that the DBM-tree re-duces the average number of distance calculations up to 67% forRq(graph (g)) and up to 37% forkN N q(graph (j)), when compared to the Slim-tree. When compared to the M-tree, the DBM-tree reduced up to 72% forRq (graph (g)) and up to 41% forkN N q(graph (j)).
The graphs of the second column (Figures 4(b), (e), (h) and (k)) show the average number of disk accesses for bothRq andkN N qqueries. In every measurement the DBM-trees clearly outperformed the Slim-tree and the M-tree, with respect to the number of disk accesses. The graphs show that the DBM-tree reduces the average num-ber of disk accesses up to 43% for Rq (graph (h)) and up to 53% forkN N q(graph (k)), when compared to the
Slim-tree. It is important to note that the Slim-tree is the MAM that in general requires the lowest number of disk accesses between every previous published MAM. These measurements were taken after the execution of the Slim−Down()algorithm of the Slim-tree. When com-pared to the M-tree, the gain is even larger, increasing to up to 54% forRq(graph (h)) and up to 66% forkN N q (graph (k)).
The results are better when the dimensionality and the number of clusters of the datasets increase (as shown for the Synt16D andSynt256D datasets). The main reason is that traditional MAM produces high overlapping areas with these datasets due both to the high dimension and the need to fit the objects in the inter-cluster regions together with the objects in the clusters. The DBM-tree achieves a very good performance in high dimensional datasets and in datasets with non-uniform distribution (a common sit-uation in real world datasets).
An important observation is that the immediate result of reducing the overlap between nodes is a reduced num-ber of distance calculations. However, the numnum-ber of disk accesses in a MAM is also related to the overlapping be-tween subtrees. An immediate consequence of this fact is that decreasing the overlap reduces both the number of distance calculations and of disk accesses, to answer both types of similarity queries. These two benefits sums up to reduce the total processing time of queries.
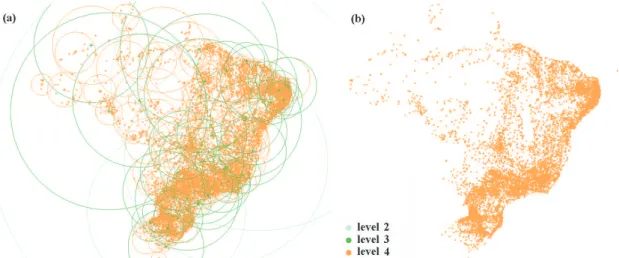
Figure 2. Visualization of theDBM-MMstructure for theCitiesdataset. (a) with the covering radius of the nodes; and (b) only the objects. It is possible to verify that the structure is deeper (darker objects) in high-density regions, and shallower (lighter objects) in low-density regions.
Figure 3. Visualization of theSlim-treestructure for theCitiesdataset. (a) with the covering radius of the nodes; and (b) only the objects. It is possible to verify that the structure has the same level in high-density regions and in low-density regions (level 4).
of distance calculations and the number of disk accesses. The graphs show that the DBM-tree is up to 44% faster to answerRqandkN N q(graphs (i) and (l)) than Slim-tree. When compared to the M-tree, the reducion in total query time is even larger, with the DBM-tree being up to 50% faster forRqandkN N qqueries (graphs (i) and (l)).
5.3. Experiments regarding theShrink()Algorithm The experiments to evaluate the improvement achieved by theShrink()algorithm were performed on the four DBM-trees over all datasets shown in Table 1. As the results of all the datasets were similar, in Figure 5 we show only the results for the number of disk ac-cesses with theColorHisto(Figures 5(a) forRq and (b) for kN N q) and Synt256D dataset (Figures 5(c) forRq and (d) forkN N q).
Figure 5 compares the query performance before and
after the execution of theShrink()algorithm for DBM-MM,DBM-MS,DBM-GMMandDBM-2CLfor bothRq andkN N q. Every graph shows that theShrink() algo-rithm improves the final trees. The most expressive result occurs in theDBM-GMMindexing theSynt256D, which achieved up to 40% lesser disk accesses forkN N q and Rqas compared with the same structure not optimized.
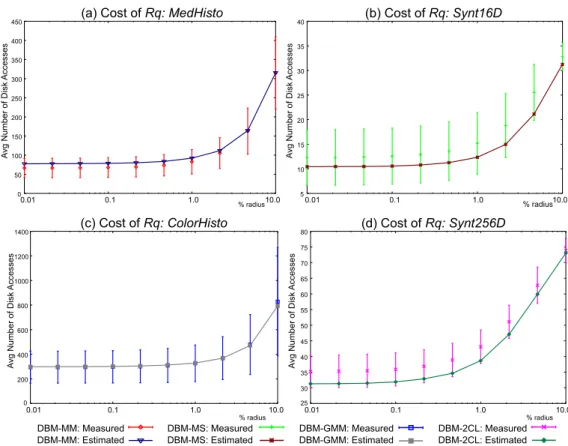
5.4. Cost of Disk Accesses in the DBM-tree
This experiment evaluates the cost model to estimate the number of disk accesses of query operations. Only 10% of the dataset objects were employed to build the histogramsHist, as a larger number of objects slightly improves the estimation.
Figure 5. Average number of disk accesses to perform RqandkN N q queries in the DBM-tree before and after the execution of theShrink()algorithm: (a)RqonColorHisto, (b)kN N qonColorHisto, (c)RqonSynt256D, (d)kN N q onSynt256D.
for theDBM-MMonMedHistoFigure 6(a),DBM-MSon Synt16DFigure 6(b), DBM-GMMonColorHistoFigure 6(c) andDBM-2CLonSynt256Ddataset Figure 6(d), as the others are similar. The real measurements are the av-erage of 500 queries as before, and the error bars indi-cate the standard deviation of each measure. It can be seen that the proposed formula is very accurate, showing errors within 1% of the real measurement for the DBM-GMM, and within 20% for theDBM-MS. The estimations is always within the range of the standard deviation.
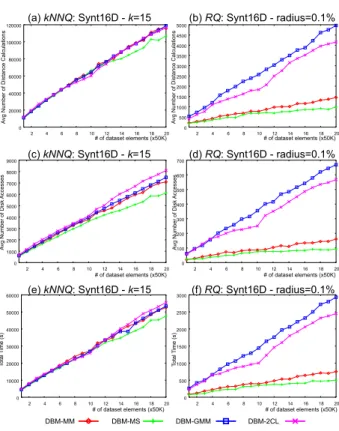
5.5. Scalability of the DBM-tree
This experiment evaluated the behavior of the DBM-tree with respect to the number of elements stored in the dataset. For the experiment, we generated 20 datasets similar to the Synt16D, each one with 50,000 elements. We inserted all 20 datasets in the same tree, totaling 1,000,000 elements. After inserting each dataset we run theShrink()algorithm and asked the same sets of 500 similarity queries for each point in the graph, as before. The behavior was equivalent for different values ofkand radius, thus we present only the results fork=15 and ra-dius=0.1%.
Figure 7 presents the behavior of the four DBM-tree considering the average number of distance calculations forkN N q(a) and forRq(b), the average number of disk
accesses forkN N q(c) and forRq(d), and the total pro-cessing time forkN N q (e) and forRq (f). As it can be seen, the DBM-trees exhibit linear behavior as the num-ber of indexed elements, what makes the method adequate to index very large datasets, in any of its configurations.
6. Conclusions and Future Works
Figure 6. Comparation of the real and the estimated number of disk accesses forRqin the (a)MedHistodataset using a DBM-MMtree, (b)Synt16Dusing aDBM-MS, (c)ColorHistousing aDBM-GMMand (d)Synt256Dusing aDBM-2CL.
their nodes.
The experiments performed over synthetic and real datasets showed that theDBM-treeoutperforms the main balanced structures existing so far: the Slim-tree and the M-tree. In average, it is up to 50% faster than the tra-ditional MAM and reduces the number of required dis-tance calculations in up to 72% when answering similar-ity queries. The DBM-tree spends fewer disk accesses than the the Slim-tree, that until now was the most effi-cient MAM with respect to disk access. The DBM-tree requires up to 66% fewer disk accesses than the balanced trees. After applying theShrink()algorithm, the perfor-mance achieves improvements up to 40% for range and k-nearest neighbor queries considering disk accesses. It was also shown that the DBM-tree scales up very well with respect to the number of indexed elements, present-ing linear behavior, which makes it well-suited to very large datasets.
Among the future works, we intend to develop a bulk-loading algorithm for the DBM-tree. As the construction possibilities of the DBM-tree is larger than those of the balanced structures, a bulk-loading algorithm can employ strategies that can achieve better performance than is pos-sible in other trees. Other future work is to develop an object-deletion algorithm that can really remove objects from the tree. All existing rigidly balanced MAM such as the Slim-tree and the M-tree, cannot effectively delete ob-jects being used as representatives, so they are just marked
as removed, without releasing the space occupied. More-over, they remain being used in the comparisons required in the search operations. The organizational structure of the DBM-tree enables the effective deletion of objects, making it a completely dynamic MAM.
References
[1] Ricardo A. Baeza-Yates, Walter Cunto, Udi Man-ber, and Sun Wu. Proximity matching using fixed-queries trees. In5th Annual Symposium on Com-binatorial Pattern Matching (CPM), volume 807 of LNCS, pages 198–212, Asilomar, USA, 1994. Springer Verlag.
[2] Tolga Bozkaya and Meral zsoyoglu. Distance-based indexing for high-dimensional metric spaces. In Proceedings of the ACM International Conference on Management of Data (SIGMOD), pages 357– 368, 1997.
[3] Tolga Bozkaya and Meral zsoyoglu. Indexing large metric spaces for similarity search queries. ACM Transactions on Database Systems (TODS), 24(3):361–404, sep 1999.
Confer-Figure 7. Scalability of DBM-tree regarding the dataset size executing kN N q queries ((a), (c) and (e)) andRq queries ((b), (d) and (f)), measuring the average number of distance calculations ((a) and (b)), the average number of disk accesses ((c) and (d)) and the total processing time ((e) and (f)). The indexed dataset was theSynt16Dwith 1,000,000 objects.
ence on Very Large Data Bases (VLDB), pages 574– 584, Zurich, Switzerland, 1995. Morgan Kaufmann.
[5] W. A. Burkhard and R. M. Keller. Some approaches to best-match file searching.Communications of the ACM, 16(4):230–236, apr 1973.
[6] Fabio J. T. Chino, Marcos R. Vieira, Agma J. M. Traina, and Caetano Traina Jr. Mamview: A visual tool for exploring and understanding metric access methods. InProceedings of the 20th Annual ACM Symposium on Applied Computing (SAC), page 6p, Santa Fe, New Mexico, USA, 2005. ACM Press.
[7] Edgar Chvez, Gonzalo Navarro, Ricardo Baeza-Yates, and Jos Luis Marroqun. Searching in met-ric spaces. ACM Computing Surveys (CSUR), 33(3):273–321, sep 2001.
[8] P. Ciaccia, M. Patella, and P. Zezula. A cost model for similarity queries in metric spaces. InACM Sym-posium on Principles of Database Systems (PODS), pages 59–68, 1998.
[9] Paolo Ciaccia, Marco Patella, and Pavel Zezula. M-tree: An efficient access method for similarity
search in metric spaces. In Proceedings of In-ternational Conference on Very Large Data Bases (VLDB), pages 426–435, Athens, Greece, 1997. Morgan Kaufmann.
[10] Roberto F. Santos Filho, Agma J. M. Traina, Cae-tano Traina Jr., and Christos Faloutsos. Similar-ity search without tears: The OMNI family of all-purpose access methods. In IEEE International Conference on Data Engineering (ICDE), pages 623–630, Heidelberg, Germany, 2001.
[11] Volker Gaede and Oliver Gnther. Multidimensional access methods. ACM Computing Surveys (CSUR), 30(2):170–231, 1998.
[12] A. Guttman. R-tree : A dynamic index structure for spatial searching. InACM International Confer-ence on Data Management (SIGMOD), pages 47– 57, Boston, USA, 1984.
[13] Gisli R. Hjaltason and Hanan Samet. Index-driven similarity search in metric spaces. ACM Transac-tions on Database Systems (TODS), 28(4):517–580, dec 2003.
[14] Caetano Traina Jr., Agma J. M. Traina, Christos Faloutsos, and Bernhard Seeger. Fast indexing and visualization of metric datasets using slim-trees. IEEE Transactions on Knowledge and Data Engi-neering (TKDE), 14(2):244–260, 2002.
[15] Caetano Traina Jr., Agma J. M. Traina, Bernhard Seeger, and Christos Faloutsos. Slim-trees: High performance metric trees minimizing overlap be-tween nodes. In International Conference on Ex-tending Database Technology (EDBT), volume 1777 ofLNCS, pages 51–65, Konstanz, Germany, 2000. Springer.
[16] K. A. Ross, I. Sitzmann, and P. J. Stuckey. Cost-based unbalanced R-trees. InIEEE International Conference on Scientific and Statistical Database Management (SSDBM), pages 203–212, 2001.
[17] Y. Theodoridis, E. Stefanakis, and T. K. Sellis. Ef-ficient cost models for spatial queries using R-trees. IEEE Transactions on Knowledge and Data Engi-neering (TKDE), 12(1):19–32, 2000.
[18] Agma J. M. Traina, Caetano Traina Jr., Josiane M. Bueno, and Paulo M. de A. Marques. The met-ric histogram: A new and efficient approach for content-based image retrieval. InSixth IFIP Work-ing Conference on Visual Database Systems (VDB), Brisbane, Australia, 2002.
[20] Marcos R. Vieira, Caetano Traina Jr., Fabio J. T. Chino, and Agma J. M. Traina. DBM-tree: A dy-namic metric access method sensitive to local den-sity data. InXIX Brazilian Symposium on Databases (SBBD), pages 163–177, Bras´ılia, Brazil, 2004.