Cross-cultural adaptation to Portuguese of tools for assessing
the nutritional status of patients on dialysis
Authors
Renata Lemos Fetter1 Fernanda Guedes Bigogno1 Fernanda Galvão Pasculli de Oliveira1
Carla Maria Avesani1
1 Institute of Nutrition. State University of Rio de Janeiro.
Submitted on: 01/30/2014. Approved on: 02/26/2014.
Correspondence to: Carla Maria Avesani.
State University of Rio de Janeiro. Rua São Francisco Xavier, nº 524, Sala 12025 D, 12º andar. Rio de Janeiro, RJ, Brazil.
CEP: 20550-900.
E-mail: [email protected] Tel: (21) 2334-0270, Ramal 216. Carlos Chagas Filho Foundation for Research Support of the State of Rio de Janeiro (FAPERJ) (E-26/111.653/2010 and E-26/103.209/2011).
I
NTRODUCTIONNutritional status assessment is important in the care of patients with chronic kidney disease (CKD). International treatment guides for patients with CKD as the National Kidney Foundation/ Clinical Practices Guidelines for Chronic Kidney Disease (Nutrition) (Nutrition K/DOQI),1 the European Best Practice
Guidelines in Nutrition (EBPG),2 as well
as the Nutritional Therapy Guidelines for Hemodialysis Patients of the Brazilian Society of Parenteral and Enteral Nutrition (SBNPE),3 recommend the use of objective
and subjective methods to assess nutritio-nal status, in order to obtain a more accu-rate nutritional diagnosis.
The most used objective methods to assess the nutritional status of CKD patients in clinical practice include an-thropometry, bioelectrical impedance, handgrip strength, feed intake data and laboratorial tests.1-3 With respect
to the combined methods for assessing nutritional status, Subjective Global Assessment (SGA) and the Malnutrition and Inflammation Score (MIS) are the most commonly used subjective instru-ments in this group of patients.4
SGA is considered an instrument that encompasses subjective and objective aspects of the physical and clinical his-tory of the patient and can be applied by any properly trained health care profes-sional.4 This tool is recommended by the
Nutrition-K/DOQI, the EBPG and the SBNPE for the nutritional assessment of patients in dialysis.1-3 SGA was originally
developed by Detsky et al.,5 in 1984, Introduction: The 7 point subjective
global assessment (7p-SGA) and the malnutrition inflammation score (MIS) are tools commonly applied for the assessment of nutritional status in dialyzed patients. Both were developed in English and require translation to Portuguese to be applied in Brazil. The cross-cultural equivalence process ensures semantic and measurement equivalence of a translated tool. Objective: To perform the cross-cultural adaptation to Portuguese of the 7p-SGA and MIS. Methods: Semantic equivalence was performed by the back-translation method and by assessing the degree of similarity between the original instrument and that back-translated from Portuguese to English (Back-translation). The assessment of the equivalence measurement was made by evaluating the intern reliability (Cronbach's α) and interobserver reliability (two observers). One-hundred and one elderly patients on hemodialysis (HD) were included. Results: Both instruments showed a high degree of semantic similarity with results close to the maximum value (7p-SGA 96.8 ± 7.8 and MIS 99.6 ± 1.4). The intern consistency showed a Cronbach's α value for 7p-SGA of 0.72 and of 0.53 for MIS. The interobserver reproducibility of 7p-SGA was moderate (intraclass coefficient [ICC] = 0.74 [95% CI: 0.58; 0.84]), while for MIS was strong (ICC = 0.88 [95% CI: 0.81; 0.93]).
Conclusion: The 7p-SGA and MIS
translated into Portuguese can be applied for assessing the nutritional status of elderly patients on HD. Studies testing the applicability of these instruments in adult patients on HD and in peritoneal dialysis should yet be performed.
A
BSTRACTwith the aim of assessing the nutritional status of surgical patients. According to the final outcome of the instrument, nutritional status is classified as: (A) Well Nourished; (B) Mildly to Moderately Malnourished, or (C) Severely Malnourished. Since then, this instrument has been redesigned by re-searchers in diverse populations with the goal to increase its reproducibility and predictive value.6
The first SGA validation for patients on hemo-dialysis (HD) and peritoneal hemo-dialysis (PD) was per-formed by Enia et al.,7 in 1993, demonstrating that
patients with protein energy malnutrition (PEM) diagnosed by SGA had lower values of albumin, low body fat content, short arm muscle circumfe-rence and low protein intake when compared to well-nourished patients. Subsequently, a multicen-ter study involving patients on PD proposed an expansion to the nutritional status classification scale of the original SGA (A, B and C) to 7 points (SGA-7p), in which the lower the number of points, the greater the degree of malnutrition. The results showed a strong association between nutritional status deterioration and increased mortality, in which a 1-point reduction in the SGA-7p was asso-ciated with a 25% increase in mortality likelihood.8
In 2007, the SGA-7p has been validated for pa-tients on HD by Steiber et al.,9 through concurrent
validation with objective measures of nutritional status. In another study, also using the SGA-7p, it was shown that patients on dialysis (HD and PD) classified as malnourished had a higher mortality risk.10 After these studies, several others have
em-ployed SGA-7p to assess the nutritional status of patients with CKD.11-13
In 2001, Kalantar-Zadeh et al.14 modified the
original SGA and proposed a modified version called dialysis malnutrition score which subse-quently gave rise to the malnutrition inflammation score (MIS). The MIS is a tool that results in a score between 0 and 30 points, in which 70% of the issues are common to the SGA and the rest are objective components such as albumin, total iron binding capacity (TIBC) and body mass index (BMI). In MIS, the higher the score, the worse the nutritional status. In studies including HD patients, it was shown that values indicative of malnutrition were associated with increased risk of hospitalizations and mortality.14
A particularity of SGA-7p and the MIS is that, although they are widely used and having been validated for patients for HD, they are originally available in English. Thus, to use it in our country, it would be necessary to make a cultural adaptation of the instrument, including its careful translation into Portuguese. Such approach is important, since the simple translation into a foreign language can compromise the quality of the translated instrument.15
The cross-cultural term adaptation is a process that first includes the stages of translation and cul-tural adaptation of an instrument for use in ano-ther country, so that the original and translated instruments have semantic equivalence.16 This
ini-tial step is the basis for assessing the equivalence measurement, another stage of cultural adaptation, which involves evaluating the reliability and vali-dity of the translated instrument.15 Thus, the
pro-cess of cultural adaptation seeks, above all, that the translated instrument produces an effect similar to the original so that it can be used safely in another culture.
Thus, if we consider that the SGA-7p and MIS are important tools for assessing the nutritional status of patients with CKD and that they have not gone through a process of cultural adaptation, this study aims to carry out a cross-cultural adaptation of the English language into Portuguese for these two instruments.
P
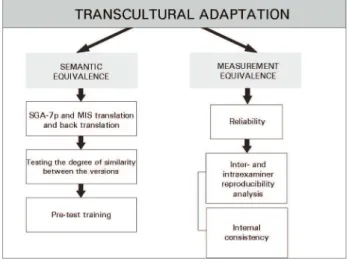
ATIENTSAND METHODSThe process of cultural adaptation was performed by means of semantic equivalence and measurement equivalence,17,18 as illustrated in Figure 1.
levels of discrete responses (unchanged, slightly altered, greatly altered and completely altered) of all the questions contained in the instruments (7 questions in the SGA-7p and 12 questions in the MIS).
After completion of this step, we conducted a pre-test with 10 elderly patients in HD in order to assess whether the translated instruments were easily understood by the examiners (dietitians) and the interviewees (patients). There was no difficulty in applying the tools in Portuguese by both parties.
To implement the instruments we used a three-session training. The first session consisted of a theoretical training on the questions of clinical assessment and physical examination. Later there was a practical training in which the dietitian examiners watched the dietitian responsible for training applying the instrument to five patients who were part of the sample from another research protocol, also conducted with elderly patients on HD. In the third session, the trainees applied the instruments under the supervision of a trainer dietitian. This training was conducted over a period of a week at the Interdisciplinary Nutritional Status Assessment Laboratory of (LIAN) of the Institute of Nutrition (INU) of the UERJ. The steps of semantic equivalence of the process are illustrated in Figure 2.
MEASUREMENTEQUIVALENCE
Was assessed the measurement equivalence by measuring the reliability of the instruments translated into Portuguese. A measure of reliability is based on the internal consistency and inter-and intraexaminer reproducibility. In the present study, the interexaminer reproducibility was carried out by two dietitians who applied the SGA-7p and MIS instruments on the same day independently in 54 patients. We did not assess the intraexaminer reliability in this study.
ANTHROPOMETRICMEASUREMENTS
Body weight (kg; electronic scale, Filizola®, up to 150
kg) and height (m; stadiometer attached to the electronic scale) were evaluated as described by Lohman et al.20
after the HD session. We calculated the BMI (current weight in kilograms divided by their height in meters squared) using the cutoff points proposed by the World Health Organization (WHO).21
Figure 1. Transcultural adaptation process by semantic and measurement equivalence.
SEMANTICEQUIVALENCE
The first phase of the process was the translation of the SGA-7p and the MIS from English into Portuguese using the back-translation method.18
Therefore, two native Portuguese speaking dieti-tians who were also fluent in English (CMA and MAK) independently translated the SGA-7p and the MIS from English into Portuguese. The origi-nal SGA-7p and MIS models were available for re-view on the subject.4 Subsequently, the two versions
translated into Portuguese of each instrument we-re analyzed by two other dietitians (RFL and JC) and they generated a Portuguese synthesis of ea-ch instrument. In the second phase, the summary version in Portuguese was retranslated into English by a native bilingual Brazilian who was an English teacher (RB). In the third phase, we tested the de-gree of similarity of the versions in which a native English speaking dietitian (AS) compared the original English version with the back-translated version of the Portuguese into English. For this, we used a specific form to assess aspects of semantic equivalence based on the referential (denotative) and general (connotative) meaning of the words. For referential meaning, we used visual analogue scales (VAS)19 as response option. In this scale, the
LABORATORYANALYSIS
We dosed: Serum urea, albumin (bromocresol green colorimetric method) and TIBC. For albumin, we used the normal range > 3.8 g/dL, as proposed by Fouque et al.22 To calculate urea Kt/V we used the
Daugirdas II23 equation from the midweek dialysis.
Urea Kt/V values > 1.2 were considered indicative of good efficiency dialysis.24
STATISTICALANALYSIS
The data are presented as mean ± standard deviation or median and interquartile limits depending on the distribution of the variable. The variable distribution was tested by the Kurtosis test. For me-asurement equivalence, we employed the reliability testing that assessed SGA-7p and MIS internal consistency and interexaminer reliability. For inter-nal consistency assessment we used the α Cronbach coefficient following Nunnally & Bernstein25
deci-sion criteria, in which it considers a coefficient value of α ≥ 0.70 and the α Cronbach coefficient values were considered adequate as we eliminated each item from the instruments. The percentage value of increasing or decreasing the α coefficient vis-à-vis the removal of each item from the instrument had to be substantial (> 10%).26 The interexaminer
reliability was evaluated by the intraclass correlation (ICC), following the decision criteria established by Shrout27: ≤ 0.1: absent; > 0.1-0.4: weak; > 0.4-0.6:
mild; > 0.6-0.8: moderate; > 0.8-1.0: strong. Statistical tests were performed using the SPSS version 18.0 for Windows (SPSS, Inc., Chicago, USA). Values of p < 0.05 were considered significant.
R
ESULTS101 patients in HD were evaluated, 75.2% (n = 76) were males aged 70.8 ± 7.0 years with HD dura-tion of 2.3 (1.0, 5.3) years. Regarding comorbidities, hypertension (70.2%, n = 71) and diabetes mellitus
(29%, n = 29) were the most frequent. The average BMI was 25.5 ± 4.9 kg/m2, indicating overweight, and
53.5% (n = 54) had a BMI < 25 kg/m2; 33.7% (n = 34)
BMI ≥ 25 kg/m2 and < 30 kg/m2 and 12.8% (n = 13)
BMI ≥ 30 kg/m2. Regarding laboratory parameters,
there was a good dialysis adequacy (Kt/V = 1.5 ± 0.43) and reduced plasma albumin (3.7 ± 0.4 g/dL). Figure 3 describes the distribution of scores obtained by SGA-7p and MIS. There was a higher patient concentration in the range of 5 to 6 points for SGA-7p and from 6 to 8 and 11 points to MIS.
SEMANTICEQUIVALENCE
The results from the Portuguese version (translated) of the instruments SGA-7p and MIS are depicted on Charts 1 and 2.
The degree of similarity test between the original instrument in English and the one translated back into English showed a high degree of similarity of the referential meaning for both SGA-7p and the MIS, since the value obtained was close to the maximum score of 100 points (SGA-7p = 96.8 ± 7.8 points and MIS = 99.6 ± 1.4 points). As to the general meaning similarity, we noticed that of the seven questions contained in the instrument, six were found to be unchanged and only one was slightly altered. For the MIS, all the 12 questions of the instrument were considered unchanged.
MEASUREMENTEQUIVALENCE
RELIABILITY
As described on Table 1, we calculated the Cronbach
α coefficient values for the SGA-7p and the MIS of the entire instrument, as well as the coefficient when
excluding each item alone from the instrument. We also calculated the item-total correlation, which measures the degree of association of the item with the total scale. The Cronbach’s α coefficient was obtained from the use of the SGA-7p and MIS in the 101 patients included in the study.
With respect to the SGA-7p, the Cronbach’s
α coefficient was satisfactory. The α coefficient estimates showed a slight improvement in the result upon excluding one item alone from the body weight history. The Cronbach’s α percentage change upon excluding one of the items was within the expected values (Table 1).
For MIS, the total Cronbach α coefficient value was below the satisfactory value. The α coefficient estimates upon excluding one item from the scale showed better results with the removal of the items: change in body weight and gastrointestinal symptoms. The Cronbach’s α percentage of change as we excluded one of the items came to be outside the expected range (> 10% or < 10%) for items: change in body weight, functional capacity, physical examination of body fat and muscle mass (Table 1).
With respect to interexaminer reproducibility (Table 2) for the SGA-7p, the ICC was indicative of moderate reproducibility and, for MIS the ICC was indicative of a strong reproducibility. With respect to the reproducibility values assessed for each item of the instruments, we noticed that on the SGA-7p, items with interexaminer moderate to strong reproducibility were body weight history, gastrointestinal symptoms, functional capacity, comorbidity and physical exam of body fat. For MIS they were: body weight change, gastrointestinal symptoms, comorbidities and functional capacity, which showed moderate to strong interexaminer reproducibility. We did not assess the interexaminer
reproducibility of the MIS objective items (BMI, albumin and TIBIC), since these are not subject to interexaminer variability.
D
ISCUSSIONThis study refers to the cultural adaptation from English into Portuguese of two methods used for assessing nutritional status, SGA-7p and MIS. These methods have been widely used in CKD patients on HD, both in clinical practice and in clinical and epidemiological trials.9-12,28-30 In Brazil, these
instruments have been used in a smaller scale, possibly due to the lack of validation of these translations into Portuguese. Thus, the relevance of this study in pre-senting results that contribute to clinical practice and research regarding the evaluation of nutritional status in patients with CKD.
The Portuguese versions of the SGA-7p and the MIS presented in this paper were obtained by the back-translation method, which ensures the semantic quality of the translated instrument.16-18
As shown, both SGA-7p and MIS were semantically equivalent, having presented a high degree of similarity vis-à-vis the total and referential meanings between the original version and the one back-translated into English. Other studies in the general population which underwent back-translation were considered well translated with degree of similarity rates matching those found in our study.31,32 Thus, the translated instruments
presented hereby are suitable for use in Brazil. In our study, we noticed that the Portuguese version of the SGA-7p and MIS showed different internal consistencies. The SGA-7p obtained a Cronbach α coefficient greater than that of the MIS, indicative of adequate internal consistency (α > 0.70). Moreover, on the SGA-7p the assessment of the association between the outcomes of each item composing the instrument with the end result denoted homogeneity of items. This finding is confirmed by the reduced value of the percentage of change in total α by excluding some item (< 10%). In other words, there was no item with greater importance than others to the overall result of SGA-7p. As for the MIS, the Cronbach α did not indicate satisfactory internal consistency (α < 0.70). Indeed, the individual removal of some items from the instrument distanced significantly
α
CHART 1 FINALSUMMARIZEDPORTUGUESEVERSIONOFTHE 7-POINTSUBJECTIVEGLOBALASSESSMENT (SGA-7P)
Subjective Global Assessment - 7 points
Patient: Date:
HISTORY
Score: 1 to 7
WEIGHT/WEIGHT CHANGE
1. Previous weight (kg) ______ (dry weight from 6 months ago)
Current weight (kg) ______ (dry weight today)
Weight loss/last 6 months ______ (%)/_____ (Kg): loss since the beginning or the last SGA.
2. Weight change in the past 2 weeks:
_____ No change _____ Increase _____ Reduction
FOOD INTAKE
No change (adequate): ____ No change (inadequate) ___
1. Change: reduced intake: ___ protein: ___ kcal: ___ time observed ___
Liquid only: ___ Liquid hypocaloric: ___ Fasting: ___
GASTROINTESTINAL SYMPTOMS
Symptoms Frequency Duration
___ None _________ _________
___ Anorexia _________ _________
___ Nausea _________ _________
___ Vomit _________ _________
___ Diarrhea _________ _________
Frequency: Never, daily, 2 to 3x/week; 1 to 2 x/week
Duration: > 2 weeks/< 2 weeks
FUNCTIONAL CAPACITY
Description Duration
____ No changes _________
____ With changes _________
____ Difficulty walking _________
____ Difficulty in performing activities (those "normal" to the patient) _________
____ Light activity _________
____ Seating down/lying in bed with little or no activity _________
____ Improved to perform activities _________
DISEASES AND COMORBIDITIES ASSOCIATED WITH THE NUTRITIONAL NEEDS
Main diagnosis: _______________________ Comorbidities: _____________________
Requirement: Normal: ____ Increased: ____ Reduced: ____
Acute metabolic stress: None: ____ Low: ____ Moderate: ____ High: ____
PHYSICAL EXAM
___ Reduction in subcutaneous fat (triceps, biceps, chest, under the eyes)
All areas: ___ Some areas: ___
___ Muscle reduction (Temporal regions, clavicles, scapulae, ribs, quadriceps, calves, knee and interosseous)
All areas: ___ Some areas: ___
___ Edema (associated with malnutrition/use this item to assess weight changes)
General score
Very mild risk for malnourished to well-nourished = 6 to 7 for most of the categories or with continuous or significant categories.
Mild to moderate malnutrition = 3, 4 or 5. Without clear sighs of severe malnutrition or normal nutritional status.
CHART 2 FINALSUMMARIZEDVERSIONINPORTUGUESEOFTHEMALNUTRITIONANDINFLAMMATIONSCORE (MIS)
MALNUTRITION AND INFLAMMATION SCORE
(A) Patient’s medical history:
1. Dry weight change (after HD session) in the past 3 to 6 months
0 1 2 3
No reduction in dry weight or < 0.5 kg weight reduction.
Weight reduction (≥ 0.5 kg, but < 1kg).
Weight reduction > 1kg buts < 5%.
Weight reduction > 5%.
2. Food intake
0 1 2 3
Good appetite and no worsening in feeding pattern.
Solid diet intake, but with sub-optimal food intake.
Moderate reduction in food intake, moving on to liquid diet only.
Fasting or hypocaloric liquid diet.
3. Gastrointestinal symptoms
0 1 2 3
No symptoms with good appetite.
Mild symptoms, little appetite or occasional nausea.
Occasional vomit with moderate GI symptoms.
Frequent diarrhea or vomits or severe anorexia.
4. Functional capacity
0 1 2 3
Normal functional capacity or with improvement. Feels well.
Occasional difficulty to walk or frequently feeling tired.
Difficulty to perform activities which the patient performs without help (e.g. using the bathroom).
Confined to bed or the chair, with little or no physical activity.
5. Comorbidity, including the number of years in dialysis
0 1 2 3
In dialysis for less than 1 year, and feeling well.
In dialysis for 1 to 4 years, or with mild comorbidities, excluding MC*.
In dialysis > 4 years, or with moderate comorbidities (including MC*).
Any multiple severe comorbidity, severe, with 2 or more MC*.
(B) Physical exam (according to SGA criterion)
6.Reduced body fat reserve or reduction in subcutaneous fat (triceps, biceps, chest and under the eyes).
0 1 2 3
Normal (no change) Mild Moderate Severe
7. Signs of reduced muscle mass (temporal region, clavicle, ribs, quadriceps, knee, interosseous).
0 1 2 3
Normal (no change) Mild Moderate Severe
8. Body Mass Index (BMI)
0 1 2 3
BMI ≥ 20 kg/m2 BMI: 18-19.99 kg/m2 BMI: 16-17.99 kg/m2 BMI < 16.00 kg/m2
9. Serum albumin
0 1 2 3
Albumin ≥ 4.0 g/dL Albumin: 3.5 to 3.9 g/dL Albumin: 3.0 to 3.4 g/dL Albumin: < 3.0 g/dL
10. Total iron biding capacity (TIBC) or Transferrin**
0 1 2 3
TIBC ≥ 250 mg/dL TIBC: 200 a 249 mg/dL TIBC: 150 a 199 mg/dL TIBC < 150 mg/dL
Total score = adding up the 10 components above (0-30):
consistency between the SGA-7p and the MIS may be due to the way with which the final score of each instrument is given. In the SGA-7p, the final score results from the value that prevails on all items, so that there is greater examiner involvement in the final score. In the MIS, the final score comes from the sum of scores from each item, thus reducing examiner participation. Furthermore, in the SGA-7p all items including the final score may be worth from 1 to 7 points, whereas in the MIS, each item can vary from 0 to 3 and the final results vary between 0 and 30. This wider score range may also have contributed to the worse MIS internal consistency. However, we cannot say whether this finding is due to the translation of the instruments
or a characteristic of those instruments, since the original SGA-7p and MIS studies do not describe internal consistency data.9-14
Regarding the interexaminer reproducibility, we noticed a moderate reproducibility for the SGA-7p. This result was similar to that found in other studies involving patients with CKD.9,33 However, a study
carried out including cancer patients in our country, assessed SGA’s intraexaminer reproducibility gene-rated by the patient. The authors reported a high reproducibility (kappa test 0.78, p < 0.001).34 For
MIS, interexaminer reproducibility was strong, a re-sult contrary to that of another study including pa-tients on HD, which found moderate interexaminer reproducibility (kappa 0.68, CI 0.52-0.72).35 Since
the SGA-7p operates in a more subjective decision mode than the MIS, the best reproducibility found in the MIS could arise from the same scoring format.
TABLE 1 INTERNALCONSISTENCYOFTHE 7-POINT
SUBJECTIVEGLOBALASSESSMENTAND
MALNUTRITIONINFLAMMATIONSCORE (N = 101)
Instrument item A d (%)
Total SGA-7p 0.72a
Body weight history 0.73b 2.1
Body weight change 0.71b -1.1
Food intake 0.67b -6.7
Gastrointestinal symptoms 0.69b -4.2
Functional capacity 0.65b -8.8
Comorbidities 0.70b -2.2
Physical exam: Fat 0.68b -5.2
Muscle mass 0.66b -8.1
Total MIS 0.53a
Body weight change 0.59b 11.74c
Food intake 0.51b -2.84
Gastrointestinal symptoms 0.55b 3.97
Functional capacity 0.46b -12.5c
Comorbidities 0.53b 1.13
Physical exam: Fat 0.41b -23.1c
Muscle mass 0.41b -22.0c
Body mass index 0.52b -1.7
Albumin 0.50b -5.3
TIBC 0.48b -8.7
SGA-7p: 7-point Subjective Global Assessment; MIS: Malnutrition Inflammation Score; TIBC: Total Iron Binding Capacity. α Cronbach Coefficient; a Total α questionnaire coefficient; bα coefficient estimate upon excluding the total score item; d: Percentage of change to the total α upon excluding the item (Positive sign: percentage increases; Negative sign: reduce percentage); c Total α change percentage upon excluding the item (> 10%).
TABLE 2 SEVEN-POINTSUBJECTIVEGLOBALASSESSMENT
ANDMALNUTRITIONINFLAMMATIONSCORE
INTEREXAMINERREPRODUCIBILITYANALYSIS.
Interexaminer reproducibilitya (n = 54)
Total SGA-7p 0.74 (95% IC: 0.58 a 0.84)
SGA-7p item
Body weight history 0.87 (95% IC: 0.79 a 0.92)
Body weight change 0.49 (95% IC: 0.26 a 0.67)
Food intake 0.50 (95% IC: 0.26 a 0.67)
Gastrointestinal symptoms 0.82 (95% IC: 0.70 a 0.89)
Functional capacity 0.82 (95% IC: 0.71 a 0.89)
Comorbidities 0.62 (95% IC: 0.43 a 0.76)
Physical exam: Fat 0.60 (95% IC: 0.39 a 0.74)
Muscle mass 0.54 (95% IC: 0.32 a 0.70)
Total MIS 0.88 (95% IC: 0.81 a 0.93)
MIS item
Body weight change 0.80 (95% IC: 0.68 a 0.88)
Food intake 0.37(95% IC: 0.11 a 0.60)
Gastrointestinal symptoms 0.66 (95% IC: 0.48 a 0.79)
Functional capacity 0.81 (95% IC: 0.69 a 0.88)
Comorbidities 0.90 (95% IC: 0.83 a 0.94)
Physical exam: Fat 0.58 (95% IC: 0.37 a 0.73)
Muscle mass 0.41 (95% IC: 0.17 a 0.61)
A limitation of our study is the fact that it involved only elderly patients (> 60 years), not representing the general population in HD. On the other hand, the semantic equivalence of the AGS-7p and MIS translation process is independent of the age range studied. The internal consistency results, which were evaluated in elderly on HD, deserves to be further investigated both in the group of elderly patients on PD, as well as in adults in both dialysis modalities. However, it is expected that the results obtained in elderly recur in adults.
C
ONCLUSIONIn conclusion, the SGA-7p and MIS translated into Portuguese can be used in elderly patients on HD. We still need other studies that test the applicability of these versions translated into Portuguese in a group of patients with different ages and on PD.
A
CKNOWLEDGMENTThe authors thank Juliana Cordeiro Dias Rodrigues and Fernando Lamarca for having actively contributed in the data collection process for this study; and Ana Lúcia Pereira, for her support in contacting patients in one of the dialysis clinic where the study was developed.
R
EFERENCES1. Clinical practice guidelines for nutrition in chronic renal failure. K/DOQI, National Kidney Foundation. Am J Kidney Dis 2000;35:S1-140.
2. Fouque D, Vennegoor M, ter Wee P, Wanner C, Basci A, Canaud B, et al. EBPG guideline on nutrition. Nephrol Dial Transplant 2007;22:ii45-87. DOI: http://dx.doi.org/10.1093/ ndt/gfm020
3. Martins C, Cuppari L, Avesani C, Gusmão MG. Terapia Nutricional para Pacientes em Hemodiálise Crônica. In: Projeto Diretrizes da AMB/SBNPE/Nutrologia. São Paulo: Associação Médica Brasileira; 2011.p.1-10.
4. Steiber AL, Kalantar-Zadeh K, Secker D, McCarthy M, Sehgal A, McCann L. Subjective Global Assessment in chronic kidney disease: a review. J Ren Nutr 2004;14:191-200. DOI: http:// dx.doi.org/10.1016/S1051-2276(04)00139-6
5. Detsky AS, Baker JP, Mendelson RA, Wolman SL, Wesson DE, Jeejeebhoy KN. Evaluating the accuracy of nutritional assessment techniques applied to hospitalized patients: methodology and comparisons. JPEN J Parenter Enteral Nutr 1984;8:153-9. DOI: http://dx.doi.org/10.1177/0148607184008002153 6. Barbosa-Silva MCG, Barros AJD. Avaliação nutricional
subjetiva: Parte 2 - Revisão de suas adaptações e utiliza-ções nas diversas especialidades clínicas. Arq Gastroenterol 2002;39:248-52.
7. Enia G, Sicuso C, Alati G, Zoccali C. Subjective global assessment of nutrition in dialysis patients. Nephrol Dial Transplant 1993;8:1094-8.
8. Adequacy of dialysis and nutrition in continuous peritoneal dialysis: association with clinical outcomes. Canada-USA (CANUSA) Peritoneal Dialysis Study Group. J Am Soc Nephrol 1996;7:198-207.
9. Steiber A, Leon JB, Secker D, McCarthy M, McCann L, Serra M, et al. Multicenter study of the validity and reliability of subjective global assessment in the hemodialysis population. J Ren Nutr 2007;17:336-42. DOI: http://dx.doi.org/10.1053/j. jrn.2007.05.004
10. de Mutsert R, Grootendorst DC, Boeschoten EW, Brandts H, van Manen JG, Krediet RT, et al. Subjective global assessment of nutritional status is strongly associated with mortality in chronic dialysis patients. Am J Clin Nutr 2009;89:787-93. PMID: 19144733 DOI: http://dx.doi.org/10.3945/ ajcn.2008.26970
11. Vero LM, Byham-Gray L, Parrott JS, Steiber AL. Use of the subjective global assessment to predict health-related quality of life in chronic kidney disease stage 5 patients on maintenance hemodialysis. J Ren Nutr 2013;23:141-7. DOI: http://dx.doi. org/10.1053/j.jrn.2012.03.003
12. Tsai HJ, Tsai AC, Hung SY, Chang MY. Comparing the predictive ability of population-specific Mini-Nutritional Assessment with Subjective Global Assessment for Taiwanese patients with hemodialysis: a cross-sectional study. Int J Nurs Stud 2011;48:326-32. PMID: 20817182 DOI: http://dx.doi. org/10.1016/j.ijnurstu.2010.07.015
13. de Mutsert R, Grootendorst DC, Indemans F, Boeschoten EW, Krediet RT, Dekker FW; Netherlands Cooperative Study on the Adequacy of Dialysis-II Study Group. Association between serum albumin and mortality in dialysis patients is partly explained by inflammation, and not by malnutrition. J Ren Nutr 2009;19:127-35. DOI: http://dx.doi.org/10.1053/j. jrn.2008.08.003
14. Kalantar-Zadeh K, Kopple JD, Block G, Humphreys MH. A malnutrition-inflammation score is correlated with morbidity and mortality in maintenance hemodialysis patients. Am J Kidney Dis 2001;38:1251-63. PMID: 11728958 DOI: http:// dx.doi.org/10.1053/ajkd.2001.29222
15. Reichenheim ME, Moraes CL. Operationalizing the cross-cultural adaptation of epidemiological measurement instruments. Rev Saude Publica 2007;41:665-73.
16. Beaton DE, Bombardier C, Guillemin F, Ferraz MB. Guidelines for the process of cross-cultural adaptation of self-report measures. Spine (Phila Pa 1976) 2000;25:3186-91. DOI: http:// dx.doi.org/10.1097/00007632-200012150-00014
17. Herdman M, Fox-Rushby J, Badia X. A model of equivalence in the cultural adaptation of HRQoL instruments: the universalist approach. Qual Life Res 1998;7:323-35.
18. Hilton A, Skrutkowski M. Translating instruments into other languages: development and testing processes. Cancer Nurs 2002;25:1-7. DOI: http://dx.doi.org/10.1097/00002820-200202000-00001
19. Streiner DL, Nornan GR. Health measurement scales. A practical guide to their development and use. 3rd ed. New York:
Oxford University Press; 2003.
20. Lohman TG. Advances in body composition assessment. Champaign: Human Kinetics; 1992.
21. Obesity: preventing and managing the global epidemic. Report of a WHO consultation. World Health Organ Tech Rep Ser 2000;894:i-xii. PMID: 11234459
22. Fouque D, Kalantar-Zadeh K, Kopple J, Cano N, Chauveau P, Cuppari L, et al. A proposed nomenclature and diagnostic criteria for protein-energy wasting in acute and chronic kidney disease. Kidney Int 2008;73:391-8. DOI: http://dx.doi. org/10.1038/sj.ki.5002585
24. NKF-K/DOQI: NKF-K/DOQI Clinical Practice Guidelines and Clinical Practice Recommendations for 2006 Updates: Hemodialysis Adequacy, Peritoneal Dialysis Adequacy and Vascular Access. Am J Kidney Dis 2006;48:S1-321.
25. Nunnally J, Bernstein I. Psychometric theory. 3rd ed. New York:
McGraw-Hill; 1994.
26. Reichenheim ME, Moraes CL. Qualidade dos instrumentos epidemiológicos. In: Almeida-Filho N, Barreto M. Epidemiologia e Saúde - Fundamentos, métodos e aplicações. Rio de Janeiro: Guanabara Koogan; 2011.p.150-64.
27. Shrout PE. Measurement reliability and agreement in psychiatry. Stat Methods Med Res 1998;7:301-17.
28. Yamada K, Furuya R, Takita T, Maruyama Y, Yamaguchi Y, Ohkawa S, et al. Simplified nutritional screening tools for patients on maintenance hemodialysis. Am J Clin Nutr 2008;87:106-13. PMID: 18175743
29. Jones CH, Wolfenden RC, Wells LM. Is subjective global assessment a reliable measure of nutritional status in hemodialysis? J Ren Nutr 2004;14:26-30.
30. Rambod M, Bross R, Zitterkoph J, Benner D, Pithia J, Colman S, et al. Association of Malnutrition-Inflammation Score with quality of life and mortality in hemodialysis patients: a 5-year prospective cohort study. Am J Kidney Dis 2009;53:298-309. DOI: http://dx.doi.org/10.1053/j.ajkd.2008.09.018
31. Moraes CL, Reichenheim ME. Cross-cultural measurement equivalence of the Revised Conflict Tactics Scales (CTS2) Portuguese version used to identify violence within couples. Cad Saude Publica 2002;18:783-96. DOI: http://dx.doi. org/10.1590/S0102-311X2002000300027
32. Duarte PS, Miyazaki MC, Ciconelli RM, Sesso R. Translation and cultural adaptation of the quality of life assessment instrument for chronic renal patients (KDQOL-SF). Rev Assoc Med Bras 2003;49:375-81. PMID: 14963588 DOI: http://dx.doi.org/10.1590/S0104-42302003000400027 33. Visser M, van den Heuvel E, Deurenberg P. Prediction
equations for the estimation of body composition in the elderly using anthropometric data. Br J Nutr 1994;71:823-33. DOI: http://dx.doi.org/10.1079/BJN19940189 34. Duarte Bonini Campos JA, Dias do Prado C. Cross-cultural
adaptation of the Portuguese version of the Patient-Genera-ted Subjective Global Assessment. Nutr Hosp 2012;27:583-9.