Authors
Marcos Kubrusly1 Cláudia Maria Costa de Oliveira1
Daniela Costa de Oliveira Santos2 Rosa Salani Mota2 Maria Luiza Pereira2
1Faculdade de Medicina
Christus.
2Universidade Federal do
Ceará – UFC.
Submitted on: 06/17/2011 Approved on: 11/21/2011
Correspondence to:
Cláudia Maria Costa de Oliveira
Rua Professor Jacinto Botelho 500, Bairro Guararapes Fortaleza – CE – Brazil Zip code 60810-050 E-mail: claudiadrl@gmail. com
This study was undertaken at the Ceará State
University – UECE and UFC – Fortaleza – CE – Brazil.
The authors report no conlict of interest.
R
ESUMOIntrodução: A albumina pré-diálise pode ter sua utilidade questionada na avaliação do estado proteico devido ao efeito dilu-cional nesse período. Objetivos: Avaliar se a albumina sérica dosada no período pós-diálise (pós-HD) seria um melhor marcador do estado nutricional e do risco de mortalidade, comparada à albumina pré-diálise. Métodos: Investigou-se a cor-relação entre a albumina pré- e pós-HD e: o índice de massa corpórea (IMC), a adequação da circunferência muscular do braço (CMB) e da prega tricipital (PCT) ao percentil 50 (P50), proteína C-reativa ultrassensível (hs-PCR), o ângulo de fase (PA), o PNA (equivalente proteico do aparecimento de nitrogênio), o índice de adequação da diálise (Kt/V) e o estado de hidratação (correlação de Pearson). A con-cordância no diagnóstico do estado nutri-cional segundo a albumina pré- e pós-HD e o PA foi testada pelo coeficiente Kappa (K) (Bland-Altman). Resultados: Foram incluídos 58 pacientes em hemodiálise (HD) (30 do sexo feminino, com idade média de 49 anos). O IMC, o PA e a hs-PCR apresentaram correlação significa-tiva com a albumina pré- e pós-HD, en-quanto a adequação da CMB ao P50 e o PNA o fizeram apenas com a albumina pós-HD. A concordância no diagnóstico de desnutrição, segundo o PA < 5 e albu-mina pré- e pós-HD < 3,2 g/dL foi regular (K = 0,432). Quando o ponto de corte da albumina para desnutrição foi de 3,7 g/dL (desnutrição leve ou risco de desnutrição), os diagnósticos foram concordantes so-mente no período pós-HD (K = 0,544).
Conclusão: A albumina pós-diálise parece ser um melhor marcador do estado nutri-cional e de risco de mortalidade nos casos de desnutrição leve ou risco de desnutrição
A
BSTRACTIntroduction: Pre-dialysis albumin is likely to be falsely low due to a dilution effect, making its usefulness in assessing protein status questionable. Objectives:
The purpose of this study was to assess whether post-dialysis albumin would be a better marker of malnutrition and risk of mortality, when compared to pre-dialysis albumin. Methods: We evaluated the cor-relation between pre- and post-dialysis albumin and the following parameters: body mass index (BMI), adequacy of muscle arm circumference (MAC) and tri-cipital skinfold (TS) to the 50th percentile
(P50), C-reactive protein (CRP), phase angle (PA), protein equivalent of nitro-gen appearance (PNA), the Kt/V index of dialysis adequacy, and the hydration status (Pearson`s correlation coefficient). Agreement in the nutritional status accord-ing to pre- and post-dialysis (post-HD) al-bumin and PA was estimated according to the Kappa (K) coefficient (Bland-Altman).
Results: A total of 58 haemodialysis (HD) patients were included in this study (30 female; mean age: 49 years). BMI, PA and CRP had a significant correlation with pre- and post-HD albumin, while MAC and PNA correlated only with post-HD albumin. Agreement in the diagnosis of malnutrition according to PA < 5 and pre- and post-HD albumin < 3.2 g/dL was regular (K = 0.432). When using an albu-min cut-off value of 3.7 g/dL for malnu-trition (mild malnumalnu-trition or risk of mal-nutrition), the diagnosis was concordant only in the post-HD period (K = 0.544).
Conclusions: Post-dialysis albumin levels may be a better marker of protein status and mortality risk in cases of mild mal-nutrition or risk of malmal-nutrition and in patients with low/medium mortality risk.
Comparative analysis of pre- and post-dialysis albumin
levels as indicators of nutritional and morbidity and
mortality risk in hemodialysis patients
Análise comparativa entre a albumina pré- e pós-dialise como
I
NTRODUCTIONProtein-energy malnutrition is common in patients on hemodialysis (HD) and has several causes.1,2 Although
there is agreement on the advisability of periodically assessing the nutritional status of HD patients, there is no single method considered the gold standard for this purpose.
Albumin is the most commonly used biochemi-cal marker,3 as it is easy to measure and it is
associ-ated with clinical events in this population.4 Several
studies have shown a strong correlation between low albumin levels and increased morbidity and mortality.5-8
Fluid overload is a non-nutritional cause of hemodilution-related hypoalbuminemia.9 Because
blood for albumin determination is collected during the pre-dialytic period, when most patients have fluid retention, the consequent hemodilution may lead to erroneous diagnosis and management, something that has already been shown to affect hematocrit and he-moglobin determinations.10
Several authors have suggested that the pre-HD albumin level be used as a marker of the hydration status, and not of the nutritional status, even ques-tioning whether the nutritional status and mortality risk would be better assessed with the post-HD albu-min level.9,11
The purpose of this study was to analyze the interference of the fluid overload state (modi-fiable factor) with the albumin-based assess-ment of the nutritional status and mortality risk stratification.
M
ETHODSWe included 58 patients with end-stage chronic kid-ney disease (ESCKD), on HD in a single center of Fortaleza – CE – Brazil. The following were exclu-sion criteria: age under 18 years; less that 3 months on HD; active neoplastic disorder; amputated limb; stroke sequelae; dependence on a wheelchair; impos-sibility to have weight and height measured; refusal to sign the informed consent.
In this cross-sectional study, all the patients un-derwent: laboratory work-up, anthropometric assess-ment and electrical bioimpedance.
LABORATORYVARIABLES
Fasting serum albumin was measured before and af-ter HD, with bromocresol red12 (normal > 3.7 g/dL).
Clinical interpretation of the albumin values was based on the ESRD, Clinical Performance Measures Project classification:13 < 3.2 g/dL – malnutrition;
< 3.4 g/dL - hypoalbuminemia; < 3.7 g/dL – malnutri-tion risk. As for morbidity and mortality, we used Lowrie & Lew`s classification:5 high-risk: albumin
< 3.2; medium-risk: albumin 3.2–3.7; low-risk: al-bumin > 3.7. In order to use serum alal-bumin values equivalent to those of the aforementioned classifi-cation, we subtracted 0.3 g/dL from the values ob-tained with bromocresol red, once the method used by Lowrie and Lew5 was bromocresol green.
High-sensitivity C-reactive protein (hs-CRP) was measured before HD, with turbidimetry14 (normal
< 3 mg/L).
HD adequacy was assessed with the dialysis ad-equacy index (Kt/V)15 and the protein equivalent of
nitrogen appearance (PNA) was used to obtain an in-direct estimate of protein intake.16
ANTHROPOMETRICVARIABLES
The anthropometric indices used were: height, pre- and post-HD weight, body mass index (BMI), tri-cipital skinfold (TS), mid-arm circumference (MAC), arm muscle circumference (AMC)17 and percentage of
adequacy of the TS and AMC to the 50th percentile
(P50).18
The anthropometric measurements were ob-tained after the dialysis session, with the patient`s dry weight, in the contralateral limb to the one with the arteriovenous fistula, with a Lange caliper and a flex-ible metric tape.
The anthropometric measurements were entered into the Nutwin19 nutrition support software, version e nas situações de médio a baixo risco de mortalidade. O estado de hiper-hidratação pré-diálise pode repre-sentar um fator de confusão na interpretação clínica da albumina.
Palavras-chave: Albumina sérica. Estado nutricional. Diálise renal.
Pre-dialysis fluid overload may be a confounding fac-tor when evaluating albumin levels.
1.5, for calculation of the adequacy of the TS and AMC to the P50.
ELECTRICAL BIOIMPEDANCE
Bioimpedance (BIA) was measured thirty minutes after the end of HD, with a monofrequency BIA analyzer (RJL Systems®, Clinton Township, Michigan, USA).
Resistance and reactance were directly measured, and the phase angle (PA) was calculated from these two measurements (arc tangent of reactance/resistance x 180 degrees/π).17 The patients with a PA < 5 were
considered to have malnutrition. 20
STATISTICAL ANALYSIS
While the variables with a normal distribution were compared with Student`s t test, those with an ab-normal distribution were compared with Mann-Whitney`s test.
Pearson`s correlation coefficient was calculated to assess the linear correlation between the parametric variables investigated, and McNemar`s test to assess the correlation between the diagnoses of malnutrition and absence of malnutrition.
Agreement between the methods was assessed through Kappa (K) coefficient, with Altman`s inter-pretation: K < 0.20: poor agreement; 0.21 ≤ K ≤ 0.40: regular agreement; 0.41 ≤ K ≤ 0.60: moderate agree-ment; 0.61 ≤ K ≤ 0.80: good agreement and K > 0.80: very good agreement.
The SPSS (Incorporation Statistical Package for the Social Science for Windows Student version) software, version 14.0, was used for the statistical analysis.
R
ESULTSCHARACTERISTICS OFTHESTUDYPOPULATION
58 patients were evaluated (51.7% female; mean age 49.2 years). The demographic, anthropometric, labo-ratory and BIA characteristics are shown in Table 1.
EFFECTOFTHE HYDRATIONSTATUS ONTHESERUM
ALBUMINLEVELS
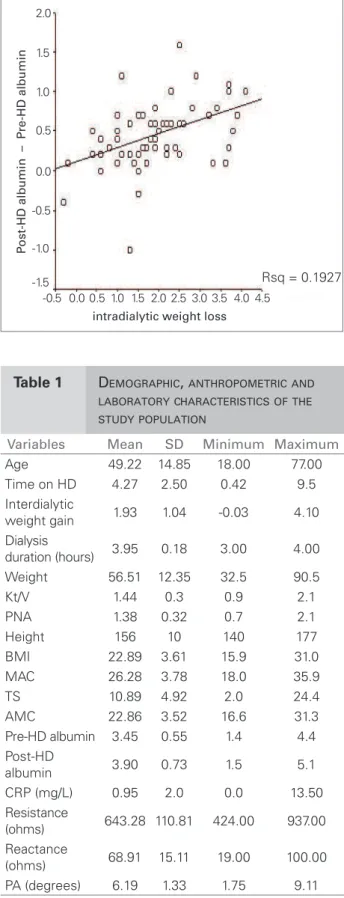
There was a significant increase of the post-HD serum albumin (3.9 ± 0.73 g/dL) in relation to pre-HD levels (3.4 ± 0.55 g/dL). This increase positively correlated with intradialytic weight loss (r = 0.44, p < 0.001) (Figure 1). This correlation was similarly observed when patients with CRP > 3 mg/L were excluded from analysis (r = 0.50, p < 0.01).
Table 1 DEMOGRAPHIC, ANTHROPOMETRICAND LABORATORYCHARACTERISTICSOFTHE STUDYPOPULATION
Variables Mean SD Minimum Maximum
Age 49.22 14.85 18.00 77.00 Time on HD 4.27 2.50 0.42 9.5 Interdialytic
weight gain 1.93 1.04 -0.03 4.10 Dialysis
duration (hours) 3.95 0.18 3.00 4.00 Weight 56.51 12.35 32.5 90.5 Kt/V 1.44 0.3 0.9 2.1 PNA 1.38 0.32 0.7 2.1 Height 156 10 140 177 BMI 22.89 3.61 15.9 31.0 MAC 26.28 3.78 18.0 35.9 TS 10.89 4.92 2.0 24.4 AMC 22.86 3.52 16.6 31.3 Pre-HD albumin 3.45 0.55 1.4 4.4 Post-HD
albumin 3.90 0.73 1.5 5.1 CRP (mg/L) 0.95 2.0 0.0 13.50 Resistance
(ohms) 643.28 110.81 424.00 937.00 Reactance
(ohms) 68.91 15.11 19.00 100.00 PA (degrees) 6.19 1.33 1.75 9.11
SD: standard deviation; HD: hemodialysis; Kt/V: dialysis
adequacy index; PNA: protein equivalent of nitrogen appearance; BMI: body mass index; MAC: mid-arm circumference; TS: tricipital skinfold; AMC: arm muscle circumference; CRP: C-reactive protein; PA: phase angle.
intradialytic weight loss
P
ost-HD albumin – P
re-HD albumin
Rsq = 0.1927
-0.5 -1.5 -1.0 -0.5 0.0 0.5 1.0 1.5 2.0
0.0 0.5 1.0 1.5 2.0 2.5 3.0 3.5 4.0 4.5
20 (34.5%) patients had pre-HD hypoalbumin-emia (< 3.4 g/dL). After fluid status correction with HD, this number fell to 9 patients (15.5%) (Figure 2).
As for malnutrition risk (albumin < 3.7 g/dL) there was a reduction in the number of patients affected, from 55.2% pre-HD to 25.9% post-HD (Figure 3).
CORRELATION BETWEEN CRP AND PRE-HD AND
POST-HD SERUMALBUMIN
We observed a 46.6% prevalence rate of patients with CRP > 3 mg/L, with only 17.3% of these pa-tients with a clinically apparent infection.
CRP negatively correlated with serum albumin, both pre-HD (r = -0.40, p = 0.003) and post-HD (r = -0.30, p = 0.04).
CORRELATION BETWEENPRE-HD AND POST-HD
SERUMALBUMINANDTHE STUDYVARIABLES
There was a significant correlation between pre-HD and post-HD albumin and BMI, BP and reactance. There was a marginally significant correlation be-tween pre-HD albumin and adequacy of the AMC to the P50 and the PNA, and a significant correlation between post-HD albumin and AMC adequacy to the P50 and the PNA (Table 2).
ASSESSMENTOFTHENUTRITIONAL STATUS AND
MORTALITYRISKACCORDINGTO PRE-HD AND POST
-HD ALBUMIN
In order to analyze the prevalence of high risk of mortality according to pre-HD and post-HD albu-min, we compared albumin < 3.2 g/dL and PA < 5. The prevalence of high risk of morbidity and mor-tality according to the two parameters did not dif-fer (MacNemar`s test), there being regular to good agreement of the diagnosis of high risk of morbidity and mortality at the pre-HD and post-HD periods ( (K = 0.432; p = 0.001 for pre-HD and e K = 0.473; p < 0.001 for post-HD) (Table 3).
For analysis of the prevalence of patients at risk of malnutrition according to pre-HD and post-HD al-bumin, we compared albumin < 3.7 g/dL and PA < 5. There was poor agreement of the diagnosis of mal-nutrition risk and different malmal-nutrition prevalences, according to the two markers used (38.6% and 1.8%) (Table 4). Yet, after fluid overload correction (post-HD), there was regular to good agreement of the di-agnosis of malnutrition risk, there being no different malnutrition prevalence between the two markers used (Table 4).
Table 2 CORRELATIONBETWEENPRE-HD ANDPOST-HD ALBUMINANDTHE NUTRITIONALSTATUSMARKERSOFTHE STUDYPOPULATION
n
Pre-HD albumin
Post-HD albumin
r p r p
BMI 58 0.293 0.025 0.296 0.024 Adequacy of
TS to P50 58 0.136 0.309 0.154 0.249 Adequacy of
AMC to P50 58 0.242 0.067 0.311 0.017 PA 57 0.588 0.000 0.600 0.013
Reactance 57 0.403 0.002 0.500 0.001 Kt/V 57 -0.113 0.402 -0.055 0.683
PNA 57 0.260 0.051 0.348 0.008
HD: hemodialysis; BMI:body mass index; TS: tricipítal skinfold; P: percentile; AMC: arm muscle circumference; PA: phase angle; Kt/V: dialysis adequacy index; PNA: protein equivalent of nitrogen appearance.
Albumin < 3.4 g/dL
P
ercentage
Pre-dialysis 34.5% (n = 20)
15.5% (n = 9)
-10% 10% 20% 30% 40% 50% 60%
0%
Post-dialysis
Figure 2. Prevalence of pre-HD and post-HD hypoalbuminemia in the study population.
Figure 3. Prevaence of patients at risk of malnutrition (serum albumin < 3.7 g/dL) at pre-HD and post-HD, in the study population.
Albumin < 3.4 g/dL
P
ercentage
Pre-dialysis 0%
40% 60% 80%
20%
Post-dialysis 55.2%
(n = 32)
Table 3 PREVALENCEOFHIGHRISKOFMORBIDITY ANDMORTALITYACCORDINGTOTHE PHASEANGLE < 5 ANDPRE-HD AND POST-HD ALBUMIN < 3.2 G/DL, INTHE STUDYPOPULATION
Phase angle Pre-HD albumin
≥ 3.2 < 3.2 ≥ 5 n (% of total) 43 (75.4) 4 (7) < 5 n (% of total) 5 (8.8) 5 (8.8)
MacNemar: p = 1.000 K = 0.432 p = 0.001
Phase angle Post-HD albumin
≥ 3.2 < 3.2 ≥ 5 n (% of total) 44 (77.2) 3 (5.3) < 5 n (% of total) 5 (8.8) 5 (8.8)
MacNemar: p = 0.727 K = 0.473 p < 0.001
HD: hemodialysis; K: Kappa index.
Table 4 PREVALENCEOFPATIENTSATRISKOF MALNUTRITION, DETERMINEDBYAPHASE ANGLE < 5 ANDPRE-HD ANDPOST-HD ALBUMIN < 3.7 G/DL
Phase angle Pre-HD albumin
≥ 3.7 < 3.7 ≥ 5 n (% of total) 25 (43.9) 22 (38.6) < 5 n (% of total) 01 (1.8) 09 (15.8)
MacNemar: p = 0.001
Kappa index: K = 0.236 p = 0.013
Phase angle Post-HD albumin
≥ 3.7 < 3.7 ≥ 5 n (% of total) 40 (70.2) 07 (12.3) < 5 n (% of total) 02 (3.5) 08 (14)
MacNemar: p = 0.18
Kappa index: K = 0.544 p < 0.001
HD: hemodialysis.
D
ISCUSSIONSeveral factors, hemodilution included, contribute to the hypoalbuminemia of patients on dialysis. 9,21
Correlation between the albumin levels and hydration status of HD patients has been investigated.
In this study, post-HD albumin increased in 93.1% of the patients. This increase was clearly related to in-tradialytic fluid loss, 1.93 kg on average, as was dem-onstrated through the significant correlation between the pre-HD and post-HD difference of the albumin values and weight.
Colin et al.21 also reported a significant
corre-lation between increased serum albumin and the change of the extracellular volume (assessed with electrical BIA). Dumler22 demonstrated a
signifi-cant increase of the extracellular volume in a group of patients with albumin < 3.5 g/dL, in relation to the group with higher albumin levels.
There were 18.8% and 29.3% reductions of the number of post-HD patients with hypoalbuminemia and at risk of malnutrition, respectively. Likewise, Wapensky et al.,11 demonstrated a post-HD 33.3%
reduction in the number of hypoalbuminemic pa-tients, in comparison with pre-HD. Other authors have pointed to the role of albumin as a marker of a fluid overload status.23
Recent studies have indicated that several HD patients have a concomitant inflammatory state, associated with increased serum levels of positive acute-phase proteins (CRP among them) and de-creased levels of negative acute-phase proteins (al-bumin, transferrin and pre-albumin)24,25 Therefore,
pre-HD albumin reduction could reflect an inflam-matory state, besides fluid overload.
The prevalence of increased CRP in dialysis pa-tients or CKD papa-tients ranges from 32 to 65%,26,27
having been detected in 46.6% of our patients. After exclusion of those with a clinically apparent infection, there remained 29.3% with an increased CRP. CRP elevation in the absence of a clinically apparent in-fection may be explained by several factors, such as reduced cytokine renal clearance, occult infections, atherosclerosis itself, complement activation, expo-sure to dialyzate endotoxins, heart failure and cath-eter use.28,29
In accordance with literature data,30 we observed
a significantly negative correlation between pre-HD and post-HD CRP and albumin. These data suggest that the hydration status does not interfere with the ratio of the two inflammation acute-phase proteins. The association of CRP with low albumin levels can-not be always considered a cause-effect relationship. Kaysen et al.31 have recently demonstrated that
in-creased CRP levels during one month did not predict reduced albumin levels in the subsequent month.
The hydration status might interfere with the clinical interpretation of pre-HD albumin, leading to inadequate therapeutic decisions. The post-HD albumin level may be a better marker of clinical outcomes and nutritional status of HD patients. Although the Kidney Disease Outcomes Quality Initiative (K/DOQI) guidelines recommend pre-HD measurement of albumin levels,33 there is no
justi-fication for the choice of this particular moment. Therefore, hemodilution-related hypoalbuminemia is not commonly considered in clinical practice. Definition of the ideal period for albumin determi-nation in HD patients is highly relevant in clinical practice, as albumin levels are used to predict mor-tality risk.8,34,35
Lowrie and Lew5 showed that the low pre-HD
serum albumin levels were associated with an in-creased likelihood of death and suggested that the established relationship between hypoalbuminemia and mortality would be mainly due to protein-en-ergy malnutrition. However, it is almost impossible to separate the effects of poor protein intake from other non-nutritional factors, that is, interdialytic weight gain and inflammation.36
We detected an important change in the rate of middle and low-risk mortality patients when post-HD albumin was used, with a 32.7% reduction in the number of medium-risk patients and a 34.4% increase in the number of low-risk patients, com-pared with the pre-HD assessment. Likewise, Duton
et al.,37 in a cross-sectional study of 86 HD patients,
demonstrated a post-HD 28% reduction in the num-ber of medium-risk patients and a 29% increase in the number of low-risk patients.
For the high mortality risk group (albumin < 3.2 g/dL), we detected just a 1.7% reduction on the post-HD assessment. Duton et al.37 also described a
similar (2%) reduction in this group. These results suggest that the hydration status does not change the initial stratification (pre-HD) of high-risk patients, compared to their post-HD status. In order to test this assumption, the authors assessed whether the high mortality risk according to albumin compared with another predictor of mortality (PA), pre-HD and post-HD, through MacNemar`s test and K index.
The PA was chosen because it was proved to be an independent mortality predictor for dialysis patients,38-40
PA calculation suffers little operator-dependent vari-ability, is less affected by volume alterations and does not depend on the predictive equations of BIA pro-grams, developed in healthy individuals with stable volemia.41
The prevalence of high mortality risk patients did not differ between the methods (albumin and PA) at pre-HD and post-HD (MacNemar`s test), and there was regular to good agreement in the diagnosis of high mortality risk between them (K index).
Santos et al. argued that exclusion of the he-modilution effect observed post-HD would prob-ably result in a more accurate assessment of the nutritional status only in borderline cases of albu-min-based malnutrition diagnoses. 42 Strengthening
this supposition, when we compared two nutri-tional markers, albumin < 3.7 g/dL (patients with mild malnutrition or at nutritional risk) and PA < 5, we observed that, exclusively post-HD, the prevalence of malnutrition did not differ between the markers, there being regular to good agree-ment in malnutrition diagnoses between the meth-ods. However, when we used the albumin cut-off point < 3.2 g/dL (indicative of malnutrition), the prevalence of malnutrition did not differ between the markers, there being a regular to good agree-ment of malnutrition diagnoses between the meth-ods, pre-HD and post-HD.
Albumin values indicative of high mortality risk (< 3.2 g/dL) are not exclusively secondary to hemodi-lution, a fact that would explain the small interfer-ence of the hydration status, as discussed above, in the risk stratification of this group. Dilution-caused albumin reduction is partly compensated by hyper-volemia-stimulated increased albumin synthesis.43,44
Other factors, such as protein-energy malnutrition and/or inflammation, may be responsible for the hypoalbuminemia, the hydration status not being enough to mask a diagnosis of malnutrition.
Kaysen and Don44 reported that hypervolemia is
an important factor in the pathogenesis of malnutri-tion, also being an independent cardiovascular risk factor in HD patients. Other authors have recently demonstrated that fluid overload is implicated in the mortality of these patients, by increasing fibrino-gen synthesis, reducing protein-energy intake and directly suppressing appetite through tumor necro-sis factor (TNF). Increased TNF would result from bacterial and/or endotoxin translocation caused by edema of the intestinal wall. Furthermore, hyperv-olemia would have a role in the pathogenesis of left ventricular overload and hypertension.43
nutritional status of HD patients.45 However, we
found no significant correlation between the pHD and post-pHD serum albumin and the Kt/V, re-sults that were similar to those of Wapenskey et al.11
Laville and Fouque45 described the inconsistency of
the Kt/V as a parameter for nutritional assessment. A French study of seven thousand dialysis patients found a 36% prevalence of malnutrition with serum albumin < 3.5 g/dL, but with Kt/V of 1.36 ± 0.36.46
As for the PNA, there was a significant correla-tion only with post-HD albumin, which might sug-gest that hemodilution masks the correlation be-tween serum albumin, albumin synthesis and protein intake, indirectly expressed by PNA.47 However, it
should be noted that PNA is an indicator of the acute nutritional status, reflecting only recent nitrogen in-take.23 In spite of the limitations of PNA use, the
K/DOQI guidelines recommend PNA as a valid and useful method to estimate protein intake, although it should not be used in isolation for the assessment of the nutritional status.33
We also analyzed the correlations between pre- and post-HD albumin and the following nutritional parameters: BMI and adequacy of AMC and TS to the P50. We observed a significant correlation be-tween AMC adequacy to P50 and post-HD albumin, which might suggest that post-HD albumin would be a better option to assess the muscle mass of these patients. As for the BMI, there was a significant cor-relation with pre- and post-HD albumin. The mean 1.93 kg weight loss was not sufficient to unveil a difference in the correlation between BMI and the al-bumin measured at the two time-points. Limitations in the use of TS in HD patients might explain the lack of significant correlation between albumin and TS adequacy to P50.48 Dutton et al.37 showed a
sig-nificant correlation between albumin and TS only at post-HD (r = 0.31, p < 0.01), and indicated post-HD albumin as the best nutritional marker.
Our results make us question whether post-HD serum albumin is indeed a better marker of the nu-tritional status, as previously suggested.11,37
In spite of the results discussed above, the best moment for measuring serum albumin remains un-defined, as there is no gold-standard for the assess-ment of the nutritional status and the responses to nutritional interventions, against which serum albu-min can be compared.33,49
To date, there is not enough knowledge to affirm that an increased post-HD albumin would have a long-term positive impact on the morbidity and mor-tality of dialysis patients. Furthermore, there are no
studies comparing patients maintained in sustained normovolemia and those on conventional dialysis, in order to determine the role of hypervolemia in the mortality of these patients. However, recent studies have pointed to lower cardiovascular risk and lower mortality of patients undergoing daily or nocturnal dialysis, compared to conventional dialysis, three times a week.50
C
ONCLUSIONSThis study suggests that albumin-based assessment of the nutritional status and mortality risk can be different when post-HD albumin is measured, due to correction of the hydration status, chiefly when there is mild malnutrition and medium and low mortality risk. Because of the limitations of our study, cross-sectional design and limited number of patients, fur-ther longitudinal studies involving larger number of patients are necessary.
R
EFERENCES1. Cano N. Nutrition de l`hémodialysé Chronique. Nutrition Clinique et Métabolisme 2004;18:7-10. 2. Agzen H, Schor N. Nutrição na insuficiência renal
crônica. In: Ajzen H, Schor N. Guias de medicina ambulatorial e hospitalar. Nefrologia. Escola Paulista de Medicina. 2a ed. São Paulo: Manole; 2002. p. 261-87.
3. Yeun JY, Kaysen GA. Factores influencing serum albumin in dialysis patients. Am J Kidney Dis. 198;32(Suppl):S118-25.
4. Cabral PC, Diniz AS, Arruda IKG. Avaliação nutricional de pacientes em hemodiálise. Nutr Rev 2005;18: 29-40.
5. Lowrie EG, Lew NL. Death risk in hemodialysis patients: the predictive value of commonly measured variables and an evaluation of death rate differences between facilities. Am J Kidney Dis 1990;15: 458-82.
6. Mazairac AHA, Wit GA, Grooteman MPC, et al. A composite score of protein-energy nutritional status predicts mortality in hemodialysis patients no better than its individual components. Nephrol Dial Transplant 2011;26:1962-7.
7. Fung F, Sherrard DJ, Gillen DL, et al. Increased risk for cardiovascular mortality among malnourished end-stage renal disease patients. Am J Kidney Dis 2002;40: 307-14.
8. Herselman M, Esau N, Kruger JM, et al. Relationship between serum protein and mortality in adults on long-term hemodialysis: exhaustive review and meta-analysis. Nutrition 2010;26:10-32.
9. Jones CH, Akaba HC, Davi C, et al. The relationship between serum albumin and hydration status in hemodialysis patients. J Ren Nutr 2002;12:209-12. 10. Movilli E, Pertica N, Camerini C, et al. Pre-dialysis versus
11. Wapensky T, Alexander SR, Sarwal M. Post-dialysis albumin: a better nutrition marker in pediatric hemodialysis patients? J Ren Nutr 2004;14:45-51. 12. Tietz NW. Fundamentals of Clinical Chemistry.
Analysis, methods, pathophysiology and interpretation. Philadelphia: W. B Saunders Company; 1987. p. 328-30.
13. ESRD Clinical Performance Measures Project: 2002 Annual Report. Am J Kidney Dis 2003;42(Suppl): 1-96.
14. Correia LCL, Lima JC, Gerstenblith G, et al. Correlação entre as medidas de proteína C-reativa pelos métodos de nefelometria e turbidimetria em pacientes com angina instável ou infarto agudo do miocárdio sem supradesnível do segmento ST. Arq Bras Cardiol 2003;81:129-132.
15. Daugirdas JT. Rapid methods for estimating Kt/V: three formulas compared. ASAIO J 1990;36:M362.
16. Daugirdas JT. Simplified equations for monitoring Kt/V, PCRn, eK/V and ePCRn. Adv Chronic Kidney Dis 1995;2:295-304.
17. Heymsfield SB, Mcmanus C, Smith J, et al.
Anthropometric measuring of muscle mass: revised equations for calculating bone-free arm muscle area. Am J Clin Nutr 1982;36:680-90.
18. Frisancho AR. New norms of upper limb fat and muscle areas assessment of nutritional status. Am J Clin Nutr 1981;34:2540-54.
19. Nutwin: programa de apoio à nutrição. [CD-ROM]. Versão 1.5. São Paulo: Departamento de Informática em Saúde da Universidade Federal de São Paulo; 2004 20. Barbosa-Silva MCG, Barros AJD, Post CLA, et al. Can
bioelectrical impedance analysis identify malnutrition in preoperative nutrition assessment? Nutrition 2003;19:422-6.
21. Colin HJ, Akbani H, David C, et al. The relationship betweem serum albumin and hydratation status in haemodialysis patients. J Ren Nutr 2002;12:209-12. 22. Dumler F. Hypoalbuminemia is a marker of
overhydration in chronic maintenance patients on dialysis. ASAIO J 2003;49:282-6.
23. Steinman TI. Serum albumin: its significance in patients with ESRD. Semin Dial 2000;13:404-8.
24. Don BR, Kaysen G. Serum albumin: relationship to inflammation and nutrition. Semin Dial 2004;17: 432-7.
25. Kaysen GA, Dubin JA, Muller HG, et al. The acute phase response varies with time and predicts serum albumin levels in haemodialysis patients. The HEMO Study Group. Kidney Int 2000;58:346-52.
26. Faintuch J, Morais AAC, Silva MAT, et al. Nutritional profile and inflammatory status of haemodialysis patients. Ren Fail 2006;28:295-301.
27. Nascimento MM, Pecoits-Filho R, Qureshi AR, et al.
The prognostic impact of flutuating levels of C-reactive protein in brazilian haemodialysis patients: a prospective study. Nephrol Dial Transplant 2004;19:2803-9. 28. Danielski M, Ikizler TA, Mcmonagle E, et al. Linkage
of hypoalbuminemia, inflammation, and oxidative stress in patients receiving maintenance haemodialysis therapy. Am J Kidney Dis 2003;42:711-22.
29. Lacson E, Levin NW. C-reactive protein and end: stage renal disease. Semin Dial 2004;17:438-48.
30. Kaysen GA, Chertow GM, Adhikarla R, et al.
Inflammation and dietary protein intake exert competing effects on serum albumin and creatinine in haemodialysis patients. Kidney Int 2001;60:333-40. 31. Kaysen GA, Dubin JA, Muller HG, et al. Relationships
among inflammation nutrition and physiologic mechanisms establishing albumin levels in haemodialysis patients. Kidney Int 2002;61:2240-9.
32. Jones CH. Serum albumin: a marker of fluid overload in dialysis patients? [editorial]. J Ren Nutr 2001;11: 59-61.
33. Combe C, Mccullough KP, Asano Y, et al. Kidney Disease Outcomes Quality Initiative (K/DOQI) and the Dialysis Outcomes and Practice Patterns Study (DOPPS): nutrition guidelines, indicators and practices. Am J Kidney Dis 2004;44(Suppl):S39-S46.
34. Fung F, Sherrard DJ, Gillen DL, et al. Increased risk for cardiovascular mortality among malnourished end-stage renal disease patients. Am J Kidney Dis 2002;40: 307-14.
35. Foley RN, Parfrey PS, Harnett JD, et al.
Hypoalbuminemia, cardiac morbidity and mortality in end-stage renal disease. J Am Soc Nephrol 1996;7: 728-36.
36. Stenvinkel P, Heimburger O, Paultre F, et al. Strong association between malnutrition, inflammation and atherosclerosis in chronic renal failure. Kidney Int 1999;55:1899-911.
37. Dutton J, Campbell H, Tanner J, et al. Pre-dialysis albumin is a poor indicator of nutritional status in stable chronic haemodialysis patients. J Ren Care 1999;25:36-7.
38. Ikizler TA, Wingard Rl, Harvell J, et al. Association of morbidity with markers of nutrition and inflammation in chronic haemodialysis patients: a prospective study. Kidney Int 1999;55:1945-51.
39. Chertow GM, Jacobs D, Lazarus JM, et al. Phase angle predicts survival in haemodialysis patients. J Ren Nutr 1997;7:204-7.
40. Mushnick R, Fein PA, Mittman N, et al. Relationship of bioelectrical impedance parameters to nutrition and survival in peritoneal dialysis patients. Kidney Int 2003;64(Suppl):S53-6.
41. Pupim LCB, Ribeiro CB, Kent P, et al. Atualização em diálise: uso da bioimpedância elétrica em pacientes em diálise. J Bras Nefrol 2000;22:249-56.
42. Santos NSJ, Draibe SA, Kamimura MA, et al. Is serum albumin a marker of nutritional status in haemodialysis patients without evidence of inflammation? Artif Organs 2003;2:681-6.
43. Cheng L, Tang W; Wang T. Strong association between volume status and nutritional status in peritoneal dialysis Patients. Am J Kidney Dis 2005;45: 891-902.
44. Kaysen GA, Don BR. Factors that affect albumin concentration in dialysis patients and their relationship to vascular disease. Kidney Int 2003;63(Suppl): S94-S97.
45. Laville M, Fouque D. Nutritional aspects in haemodialysis. Kidney Int 2003;58(Suppl):S133-S39.
in Dialysis (FSGND). Nephrol Dial Transplant 1999;14:1679-86.
47. Kaysen AG, Davis CA. Why measure serum albumin levels? J Ren Nutr 2002;12:148-50.
48. Bossola M, Muscaritoli M, Tazza L, et al. Malnutrition in haemodialysis patients: what therapy? Am J Kidney Dis 2005;46:371-86.
49. Blumenkrantz MJ, Kopple JD, Gutman RA,
et al. Methods for assessing nutritional status of patients in renal failure. Am J Clin Nutr 1980;33: 1567-85.