Primeira submissão em 15/07/10
Última submissão em 13/08/10
Aceito para publicação em 13/08/10
Publicado em 20/12/10
Rat brain polyamines: an analytical method validation
Poliaminas no cérebro do rato: validação de método analítico
Valdomiro de Freitas Sampaio1; Gilberto J. Padovan2; Julio Sérgio Marchini3; Luiz Marcellino de Oliveira4; Sebastião Sousa Almeida5;
The validation of the analytical technique for the determination of polyamines in cerebral tissue using HPLC based on o-phthalaldehyde post-column derivatization is described. The polyamines were separated in a LiChrospher100 RP18 column. Elution gradient was formed with two mobile phases: A (sodium acetate 0.1 M + sodium octanesulphonate 0.01 M, pH = 4.5) and B (sodium acetate 0.2 M + sodium octanesulphonate 0.01 M)/acetonitrile (10:3), pH = 4.5) in a 1.2 ml/min low rate. The derivative eluent was monitored by luorescence (excitation, 345 nm; emission, 455 nm). Besides excellent linearity (putrescine, r = 0.9816; spermidine, r = 0.9920; spermine, r = 0.9901), the technique demonstrated intra and inter-day precision (≤ 20%) as well as recovery (spermidine = 92.56%; spermine = 84.47%). Quantiication limits were 0.22 pM for putrescine, 76.44 pM for spermidine and 51.44 pM for spermine. The method demonstrated to be robust, simple and highly reproducible for polyamine determination in tissues.
abstract
key words Validation
Analytical technique
HPLC
Polyamines
resumo
A validação técnica analítica para determinação de poliaminas em tecido cerebral utilizando cromotograia líquida de alta eiciência (HPLC) e derivação pós-coluna com o-ftaldialdeído é descrita. A separação das poliaminas deu-se em coluna LiChrospher 100 RP18. O gradiente de eluição foi formado por duas fases móveis A (acetato de sódio 0,1M + octanossulfonato de sódio 0,01 M) e B (acetato de sódio 0,2 M + octanossulfonato de sódio 0,01 M)/acetonitrila (10:3), luxo de 1,2 ml/min. O eluente foi monitorado por luorescência (excitação, 345 nm; emissão, 455 nm). Além da excelente linearidade (putrescina, r = 0,9816; espermidina, r = 0,9920; espermina, r = 0,9901), a técnica demonstrou adequada precisão intra e interdia (≤ 20%) e recuperação (espermidina = 92,56%; espermina = 84,47%). Os limites de quantiicação foram 0,22 pM para putrescina, 76,44 pM para espermidina e 51,44 pM para espermina. O método demonstrou ser consistente, simples e altamente reprodutível para a determinação proposta.unitermos
Validação
Técnica analítica
HPLC
Poliaminas
1. Doutor em Ciências pela Faculdade de Filosoia, Ciências e Letras de Ribeirão Preto da Universidade de São Paulo (USP); médico ginecologista/obstetra.
2. Químico do Laboratório de Espectrometria de Massa da Divisão de Nutrição do Departamento de Clínica Médica da Faculdade de Medicina de Ribeirão Preto (FMRP) da USP. 3. Professor titular da USP; bolsista de Produtividade em Pesquisa 1A; orientador de mestrado e doutorado.
Introduction
The polyamines are low molecular weight aliphatic cations occurring in all living organisms(15). The biogenic polyamines evaluated in this study are putrescine (H2N(CH2)4NH2), spermidine (H2N(CH2)3NH(CH2)4NH2) and spermine (H2N(CH2)3NH(CH2)4NH(CH2)3NH2). Putrescine is synthesized in mammals from L-ornithine in a catalyzed reaction by ornithine decarboxylase, an enzyme limiting from the polyamine synthesis. Putrescine and S-adenosylmethionine are substrates for the spermidine synthesis, which is the precursor of spermine.
Among the various physiologic functions of the polyamines, we can categorize its performance as a second messenger, nutrient, metabolic regulator, growth factor, anti-oxidant, DNA, RNA and membrane stabilizer(17).
The cells developed mechanisms in order to assure the rigorous regulation of the intracellular polyamine levels through biosynthesis processes, degradation and transportation inside the organism(12). Insuficient polyamines levels result in a deficit growth and, in some cases, cellular death, including apoptosis. The uncontrolled elevation of the polyamines can lead to cellular transformation and tumor genesis(11).
The objective of the present study was to validate a modiied version of the polyamine determination as described by Löser et al.(10) using reverse phase ion-pair high performance liquid chromatography (HPLC), followed by o-phtalaldehyde post column derivatization and luorescence detection.
Methods
Animals
In these experiments, male Wistar (Rattus norvegicus) rats from the animal colony of Ribeirão Preto Campus, University of São Paulo were used. The animals were maintained on a 12:12-h light/dark cycle (lights on at 6:00 am) with room temperature kept at 23-25o C, and with free access to water and food. The experiments were performed in compliance with the recommendations of the Brazilian Society of Neuroscience and Behavior (SBNeC), which is based on the US National Institutes of Health Guide for Care and Use of Laboratory Animals.
Apparatus and chromatographic conditions
In the quantitative determination of polyamines in cerebral tissue, a chromatograph from Shimadzu
Corporation – model LC-10AD was used, equipped with two Shimadzu LC-10AD high pressure pumps, a Shimadzu CBM-10A gradient mixture unit, a Shimadzu SIL-10A auto-sampler and a Shimadzu CTO-10A oven to keep the column at 37 ± 1oC. A LiChrospher 100 RP 18 column was used
for the polyamine separation, containing octadecilsilane (C18), with 120 × 4.0 mm i.d. and 5µm particle diameter. The column gradient flow was kept at 1.2 ml/min. A low pressure pump from Milton Roy Company with a 0.45 ml/min low was used to accomplish the o-phtalaldehyde (OPA) post-column derivatization. The column eluent and OPA derivatizing agent were mixed in a T connection and, after passing through a polypropylene coil (1 m x 0.5 mm i.d.), as described by Seiler et al.(13), were maintained in a water bath at 54 ± 1oC, controlled by a thermostat. After reaction, the eluent-reagent mixture went through a Shimadzu RF535 luorescence detector, with excitation and emission wavelengths of 345 nm and 455 nm, respectively.
Reagents
The following polyamine standards were acquired: putrescine (1.4-diaminobutane) 99% Sigma D13208 with a molecular weight of 88.15 MW, spermidine (free base spermidine Sigma S2626 with a 145.25 MW), spermine (free base spermine Sigma S3256 with a 202.34 MW) and the internal standard (1,7-diaminoheptane Sigma 32990 with a 130.23 MW). The octanesulfonic sodium (1-octanesulfonic sodium acid Vetec Brasil with a 234.29 MW), the ophthalaldehyde (ophthaldialdeyde Acros with a 134.13 MW) and the Brij35 detergent (Acros with a 1198 MW) were categorized as a pure level to HPCL. The percloric acid at 70% (Cinética Química, Brazil), the acetonitrile (J. T. Baker), the PA sodium acetate (Merck), the potassium hydroxide, ethanol, 2-mercaptoethanol, PA acetic acid (Vetec Brasil) and the PA boric acid (Vetec Brasil) were analytical. MILLEX-GS ilters with 13 mm diameter and 0.22 µm pore from Millipore (JBR13GP05) were acquired. The water used was from the usage of the Milli-Q (Millipore) system. For the protein dosage, the Coomassie blue binding method(2) was implemented, using the Dye Reagent Concentrate (BIO-RAD Protein Assay) and bovine albumin (PIERCE Protein assay reagents).
Solutions
octanesulfonate (4.69 g) to 2,000 ml Milli-Q water, having the pH adjusted to 4.5 by the addition of acetic acid.
• Buffer B: 0.2 M sodium acetate and 0.01 M sodium octanesulfonate solution was obtained by the addition of sodium acetate (32.81 g) and sodium octanesulfonate (4.69 g) to 2,000 ml Milli-Q water, having the pH adjusted to 4.5 by the addition of acetic acid. To an aliquot of this solution we add acetonitrile in a 10:3 (v/v) proportion in order to create Buffer B. Both buffers (A and B), were iltered, after agitation, through a cellulose (or nylon) organic phase ilter with 0.45 µm pore and 47 mm diameter.
• Boric acid solution: obtained after addition of boric acid (12.34 g) and potassium hydroxide at 25% (25 ml) to 1,000 ml Milli-Q water, having the pH adjusted to 10.4 with addition of potassium hydroxide at 50%
• OPA-methanol solution: obtained after adding OPA (400 mg) to methanol (5 ml).
• OPA-2-mercaptoetanol derivatizing reagent solution: obtained after adding the boric acid solution (227.3 ml), 30% BRIJ35 (6.82 ml), 2-mercaptoethanol (4.55 ml) and the OPA-methanol solution (11.36 ml). The derivatizing reagent must be kept in a dark lask protected from light and pressurized under constant low helium low.
• 0.2 M percloric acid solution (PCA): obtained after addition of 70% PCA (4.31 ml) (MW = 100.46, density = 1.664 g/ml) to 250 ml distilled water. • Internal standard solution: obtained after adding
1.7 diaminoheptane (0.039 mg) to buffer A (10 ml), which gives a 300 nmol/ml concentration. • Polyamines Standards Mixture (PSM) for
the standards curves and calibration runs, being made of:
√ 13,822 nM internal standard 1.7 diaminoheptane solutions (160 µl): obtained after adding 1.7 diaminoheptane (0.09 mg) to buffer A (50 ml). √ 846.3 nM 1.4 diaminobutane (putrescine)
solution (40 µl): obtained after adding 1.4 diaminobutane (0.000373 mg) to buffer A (5 ml).
√ 63.7 µM N-(3-aminopropil)-1.4 diaminobutane (spermidine) solution (30 µl): obtained after
adding spermidine (0.23131 mg) to buffer A (25 ml).
√ 32,122 nM N,N´-Bis(3-aminopropil)-1.4 diaminobutane (spermine) solution (8 µl): obtained after adding spermine (0.03250 mg) to buffer A (5 ml).
√ Buffer A (5,000 µl).
The inal PSM content concentrations are: putrescine (6.77 nM), internal standard (44.22 nM), spermidine (76.44 nM) and spermine (51.40 nM).
Elution gradient
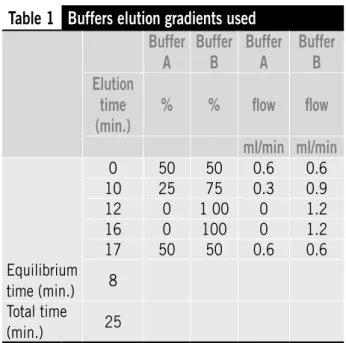
The elution gradient described in Table 1 was used in the HPLC analysis. The column lux was 1.2 ml/min, with a 17 minutes elution run time, followed by a 8 minutes equilibration time, summing up to 25 minutes total analysis time.
Table 1
Buffers elution gradients used
Buffer
A
Buffer
B
Buffer
A
Buffer
B
Elution
time
(min.)
%
%
low
low
ml/min ml/min
0 50 50 0.6 0.6
10 25 75 0.3 0.9
12 0 1 00 0 1.2
16 0 100 0 1.2
17 50 50 0.6 0.6
Equilibrium time (min.) 8 Total time (min.) 25
Sample extraction procedure
The extraction procedure was conducted according to Löser et al.(10). After weighting, the samples were frozen to -70ºC, being reported that under this condition, we can wait up to six months for further analysis(6).
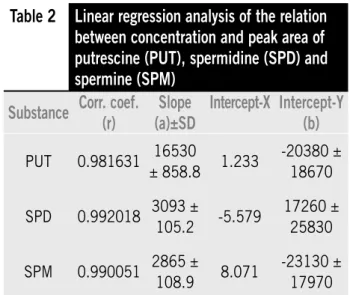
analysis. Therefore, analytical curves were built starting from the solution obtained from the addition of the PSM (200 µl) to Buffer A (200 µl) with triplicate analysis of 10, 20, 30, 40 and 50 µl injected solution. The linear regression analysis for the relation between the injected concentration and the detector response for putrescine (PUT), spermidine (SPD) and spermine (SPM) as well as correlation coeficients and linearity equations are shown below in Table 2.
Precision
The precision, defined as the agreement pattern between the results of individual tests when the procedure is applied to multiple aliquots of a homogenized sample, was accomplished through the evaluation of the repeatability, or intra-assay or intra-day, precision, and the intermediate, or inter-assay or inter-day, precision(14). Three male Wistar rat brains were submitted to the same extraction procedure described above, each brain supplying a homogenized solution. Fifteen samples from each homogenized solution where analyzed in quintuplicate (n = 5) for intra-day assay and triplicate (n = 15) for inter-day assay.
In the precision and recovery studies there were no results regarding putrescine, which concentration in the used samples was below the detection limit. The intra and inter day coeficients obtained in the method precision are summarized in Tables 3 and 4 and are according to what was expected (≤ 20%)(1).
Recovery
For the polyamines recovery analysis, a whole rat brain was used. Fifteen samples of an homogein sample posterior protein quantiication. The internal standard (1.7
diaminoheptane, 300 nM/ml) solution (50 µl) and 70% 0.2 M PCA (700 µl) were added to the homogenate. The mixture was then centrifuged at 3200 g for 5 minutes and the supernatant was iltered by a Millex (0.22 µm) ilter and 20 µL were injected into the HPLC.
The PSM, routinely used in calibrations to obtain the analytical curve, which used to be done before the sample analysis, contained, in the 20 µl injected into the HPLC, 27.08 picomoles of putrescine, 176.92 picomoles of the internal standard (1.7-diaminoheptane), 305.76 picomoles of spermidine and 205.6 picomoles of spermine.
Technical analysis validation
The technical analysis validation, confirming its applicability to the intentioned purpose, was accomplished based on the following parameters: linearity, detection and quantiication limits, precision and recovery, following the FDA(1) and ICH(8) recommendations.
Results and discussions
Chromatographic methodology
In Figure, the chromatogram shows the retention times of putrescine (about 6 minutes), internal standard (11 minutes), spermidine (14 minutes) and spermine (16 minutes) during the sample analysis from the cerebral tissue of the rat.
Linearity
The linearity of the polyamines responses was examined to ensure that the procedure can provide quantitative
Figure – Chromatogram of the cerebral tissue of the rats showing the retention peaks for putrescine (5), internal standard (6), spermidine (9) and spermine (10).
mV
100
50
0
mir 20 15
5 10
0
PUT
SPD
10
SPM
I.S.
5 6
7 8
9
1 3
4
2 12
11
Table 2
Linear regression analysis of the relation
between concentration and peak area of
putrescine (PUT), spermidine (SPD) and
spermine (SPM)
Substance
Corr. coef.
(r)
Slope
(a)±SD
Intercept-X Intercept-Y
(b)
PUT 0.981631 16530
± 858.8 1.233
-20380 ± 18670
SPD 0.992018 3093 ±
105.2 -5.579
17260 ± 25830
SPM 0.990051 2865 ±
108.9 8.071
obtained from the extraction procedure described above were analyzed in triplicate, with and without addition of known quantities of polyamine standards: 92.56% and
84.47% were the recovery percentage for spermidine and spermine, respectively.
Method modiication for putrescine detection
The largest HPLC injection volume, from 20 µL to 30 µL, elevating from 1.5 times the solute mass, did not successfully result in detection of putrescine in the samples. After that, in an attempt to detect putrescine, we concentrated the samples in a way that the injected mass quintuplicated. Therefore, the original saline dilution proposed by Löser et al.(10) was reduced from 1:20 to 1:10 and the PCA volume from the original proportion of 2.8:1 (homogenate volume /PCA volume) to 1.2:1. The additional internal standard volume remained in the same original 1/5 proportion of the homogenate volume. Consequently, for a homogenate volume of 250 µl, for instance, we added 50 µl of the internal standard, a procedure we maintained, and 300 µl of PCA. Finally, to elevate 5 times the injected mass, we injected 30µL into the HPLC. These alterations in the method succeeded in the putrescine detection.
Detection and quantiication limits
The detection limits for each polyamine were calculated considering a 2:1 signal/noise level. Following this criteria,
Table 4
Precision calculation of 3 days (
n
= 15)
showing the average (picomoles), the
standard deviation (SD), the standard
mean error (SME) and the coeficient of
variation (CV) of the measures
Intra-day precision
SPD
SPM
ANIMAL 1
Mean 267.4 101.7
SD 29.4 19.73
SME 8.16 6.24
CV 10.99% 19.4%
ANIMAL 2
Mean 249.1 102
SD 24.52 16.71
SME 6.33 4.31
CV 9.84% 16.37%
ANIMAL 3
Mean 252.60 73.44
SD 36.89 10.47
SME 9.53 3.7
CV 14.6% 14.26%
Table 3
Intra-day precision in quintuplicate showing mean (picomoles), standard deviation (SD), standard
mean error (SME) and coeficient of variation (CV) of the measures
Intra-day precision
SPD
SPM
Days
1
2
3
Days
1
2
3
Mean 287.8 291.5 236.7
ANIMAL 1
Mean 126.2 115.7 83.19
SD 3.234 11.45 5.38 SD 24.14 3.884 6.073
SME 1.867 6.612 2.477 SME 13.94 2.746 3.037
CV 1.12% 3.93% 2.34% CV 19.13% 3.36% 7.3%
Days
1
2
3
Days
1
2
3
Mean 229.2 268.2 254.6
ANIMAL 2
Mean 84.21 117.8 104.1
SD 5.739 22.53 15.02 SD 4.759 10.41 11.54
SME 2.869 10.08 6.718 SME 2.128 4.655 5.161
CV 2.5% 8.4% 5.9% CV 5.65% 8.84% 11.08%
Days
1
2
3
Days
1
2
3
Mean 277.4 243.4 218.3
ANIMAL 3
Mean 69.96 163.5 39.01
SD 25.44 8.075 2.814 SD 11.57 20.09 0.891
SME 11.38 4.038 1.625 SME 5.176 11.6 0.4455
the detection limits obtained resulted in 0.11 picomoles for putrescine, 27.56 picomoles for spermidine and 20.69 picomoles for spermine.
For the quantification limit, the lowest analit concentration that provides an answer which could be accurately quantified resulted in 0.22 picomoles for putrescine, 76.44 picomoles for spermidine and 51.40 picomoles for spermine, considering a 10:1 signal/noise relation.
Conclusion
The highly sensitive and reproducible chromatographic method developed by Löser et al.(10), used in this study as well as in others(9, 16, 18), proved to be adequate to the proposed polyamine analysis.
Under the chromatographic extraction conditions of the tissue polyamines used according to the reference description, putrescine was not detected for its concentration being below the detection methods reproduced by us. The measures for sample concentration elevated 5 times the inal mass injected into the HPLC and putrescine became detectable and quantiiable in the samples. The different properties of the stationary phase of the columns used in this study (LiChrospher) and by Löser et al. (NovaPak),
such as particle and pore size, surface area, carbon load, greater silanol groups exposition, with consecutive greater hydrophobicity and polarity, can identify and explain the difference in eficiency for basic compounds between the columns(3). Gennaro et al.(5), in a study about different
chromatographic C18 columns adequacy for the ionic interaction transference method in the HPLC, comparing the ruggedness in the transference of methods between ive different commercial products, with silica 5 µm stationary phases (RP-18), concluded that the critical parameter to be considered in column change between methods is the mobile phase pH, which must be strictly controlled for performance maintenance. With the LiChrospher column,
the minimum pH deviations up to ± 2.5% in the mobile phase are tolerated(5), which we considered in the present study. Löser et al.(9) reported the usage of a 1:10 inal dilution for sample concentration.
The polyamines concentration in tissues can be expressed in nanomoles per tissue gram and the normalization in milligrams of protein shows similar results, also noted by Deignan et al.(4). The spermidine/spermine ratio has been used as a more reliable measure for the spermidine formation during the polyamine inter-conversion cycle(13). Hixson et al.(7) reported that the ratio spermidine/spermine is the less susceptible indicator to measure mistakes because it does not depend on a second measure for normalization, like the weight or protein content of the samples.
Acknowledgements
The authors express gratefulness to Prof. Dr. Pierina Sueli Bonato, from the Phisics and Chemistry Department of the Farmaceutical Sciences Faculty of Ribeirão Preto (USP), for her valuable orientation on the polyamines chromatographic method validation.
References
1. BIOANALYTICAL Method Validation, Guidance for Industry, Center for Drug Evaluation and Research (CDER), 2001. Available in: <http://www.fda.gov/cder/ guidance/4252fnl.pdf>.
2. BRADFORD, M. M. A rapid and sensitive method for the quantitation of microgram quantities of protein
utilizing the principle of protein-dye binding. Analytical
Biochemistry, v. 72, p. 248-54, 1976.
3. COMPARISION guide to C18 reversed phase HPLC columns. Available in: <http://ACE-PLC.com/assets/downloads/ ACE_Comparision_Guide_2006.pdf>.
4. DEIGNAN, J. L. et al. Polyamine homeostasis in arginase
knockout mice. Am J Physiol Cell Physiol, v. 293,
p. C1296-C1301, 2007.
5. GENNARO, M. C.; ANGELINO, S.; GIANOTTI, V. Suitability of different C18 silica-based stationary phases for the
transferability of an ion-interaction HPLC method.
Analysis, v. 27, p. 742-8, 1999.
6. HALLINE, A. G.; DUDEJA, P. K.; BRASITUS, T. A. 1 , 2 - D i m e t h y l h y d r a z i n e - i n d u c e d a l t e r a t i o n s in N1-acetylspermidine levels and spermidine N1-acetyltransferase acivity in rat colonic mucosa.
Cancer Research, v. 49, p. 633-8, 1989.
7. HIXSON, L. J. et al. Sources of variability in estimating
ornithine decarboxylase activity and polyamine contents
in human colorectal mucosa. Cancer Epidemiology,
Biomarkers & Prevention, v. 3, p. 317-23, 1994. 8. INTERNATIONAL Conference on Harmonization,
9. LÖSER, C. et al. Dietary polyamines are essential luminal growth factors for small intestinal and colonic mucosal
growth and development. Gut, v. 44, p. 12-6,
1999.
10. LÖSER, C.; WUNDERLICH, U.; FÖLSCH, U. R. Reversed-phase liquid chromatographic separation and simultaneous luorimetric detection of polyamines and theirs monoacetyl derivatives in human and animal urine, serum and tissue samples: an improved, rapid
and sensitive method for routine application. Journal of
Chromatography, v. 430, p. 249-62, 1988.
11. PEGG, A. E. Polyamine metabolism and its importance in neoplastic growth and as a target for chemotherapy.
Cancer Research, v. 48, p. 759-74, 1988.
12. SEILER, N. Catabolism of polyamines. Amino Acids, v. 26,
p. 217-33. 2004.
13. SEILER, N.; BOLKENIUS, F. Polyamine reutilization and
turnover in brain. Neurochem Res, v. 10, p. 529-44,
1985.
14. SNYDER, L. R.; KIRKLAND, J. J.; GLAJCH, J. L. Completing
the method: validation and transfer in Practical HPLC method development. 2. ed. USA: John Wiley & Sons, Inc., 1997. p. 687-713.
15. TABOR C. W.; TABOR, H. Polyamines. Annu Rev Biochem,
v. 53, p. 749-90, 1984.
16. TIBERIO, L.; MAIER, J. A. M.; SCHIAFFONATI, L. Down-regulation of c-myc expression by phorbol ester protects CEM T leukaemia cells from starvation-induced apoptosis: role of ornithine decarboxylase
and polyamines. Cell Death and Differentiation, v. 8,
p. 967-76, 2001.
17. WALLACE, H. M. The physiological role of the polyamines.
European Journal of Clinical Investigation, v. 30, p. 1-3, 2000.
18. WALTERS, J. D. et al. An inhibitor of polyamine biosynthesis
impairs human polymorphonuclear leukocyte priming
by tumor necrosis factor alpha. J Leukoc Biol, v. 57,
p. 282-6, 1995.
Mailing adress
Valdomiro de Freitas Sampaio Av. Guilhermina Cunha Coelho, 350, casa 18D – City Ribeirão