*Correspondence: S. Altınöz. Hacettepe University, Faculty of Phar -macy, Department of Analytical Chemistry. 06100 - Ankara- Turkey. E-mail: [email protected]
A
vol. 49, n. 2, apr./jun., 2013
RP-HPLC method development and validation for estimation of
rivaroxaban in pharmaceutical dosage forms
Mustafa Çelebier, Tuba Reçber, Engin Koçak, Sacide Altınöz
*Department of Analytical Chemistry, Faculty of Pharmacy, Hacettepe University, Turkey
Rivaroxaban, an anti-clotting medication, acts at a crucial point in the blood-clotting process and stops the formation of blood clots. In this study, RP-HPLC method was developed for the determination of rivaroxaban in tablets (Xarelto® (10 mg)). Phenomenex Luna 5 µm C18 100 Å LC Column (250 x 4.6 mm)
was used at 40 oC. Isocratic elution was performed with ACN:Water (55:45 v/v) mixture. The low rate was 1.2 mL min-1 and UV detection was at 249 nm. Internal standard (Caffeine) and rivaroxaban were eluted within 2.21 and 3.37 minutes, respectively. The developed method was validated according to the ICH guidelines and found to be linear within the range 0.005 - 40.0 µg mL-1. The method was accurate, precise, robust and rapid. Thus, it was applied successfully for the quality control assay of rivaroxaban in tablet dosage form.
Uniterms: HPLC. Rivaroxaban. Validation. System suitability. Stability-indicating. Pharmaceutical dosage form.
Rivaroxabana, fármaco anticoagulante, atua em um ponto crucial no processo de coagulação do sangue e impede a formação de coágulos sanguíneos. Neste estudo, desenvolveu-se método de RP-HPLC para a determinação de rivaroxabana em comprimidos (Xarelto ® (10 mg)). Utilizou-se coluna LC (250 x 4,6 mm) Phenomenex Luna C18 5 µm 100 Å a 40 oC. Realizou-se eluição isocrática com ACN:
água (55:45 v/v). O luxo foi de 1,2 mL min-1 e a detecção de UV foi a 249 nm. Padrão interno (cafeína) e rivaroxabana eluíram em 2,21 e 3,37 minutos, respectivamente. O método desenvolvido foi validado de acordo com as diretrizes do ICH e mostrou-se linear na faixa 0,005-40,0 mg mL-1. O método foi exato, preciso, robusto e rápido. Assim, foi aplicado com êxito para o ensaio de controle de qualidade da Rivaroxabana na forma de comprimidos.
Unitermos: HPLC. Rivaroxabana. Validação. Adequação do sistema. Indicador de estabilidade. Forma farmacêutica.
INTRODUCTION
Anticoagulants are given to prevent the blood from clotting or prevent to existing clots from getting larger. Clots can block the blood flow to the heart muscle or block the blood low to the brain. These cause a heart attack or a stroke. Rivaroxaban (RIV), an oral oxazolidinone-based anticoagulant, is a potent, selective direct inhibitor of factor Xa that is used in the prevention of venous thromboembolism in adult patients after total hip replacement or total knee replacement surgery. RIV
FIGURE 1 - Chemical structure of rivaroxaban.
(Figure 1) is a small molecule (molecular mass: 436 g
mol-1) that is almost insoluble in water and exhibits high
plasma protein binding (92–95%) in humans, with serum albumin being the main binding component.
as a result of RIV binding with high selectivity to the S1
and S4 pockets of the serine endopeptidase (Duggan et
al., 2009). Inhibition of factor Xa interrupts the intrinsic
and extrinsic pathway of the blood coagulation cascade, inhibiting both thrombin formation and development of thrombi. RIV does not inhibit thrombin (activated Factor II), and has no effects on platelets have been demonstrated
(Pezborn et al., 2007; Terry et al., 2009). The RIV was
approved for marketing by Health Canada and European Commission in 2008. In the literature, there is an HPLC-MS method for the determination of RIV in human plasma for pharmacokinetic studies (Rohde, 2008). However, there is no method reported for the quantiication of RIV in pharmaceutical dosage forms. It is well known that quality control is an important task in the pharmaceutical industry. The term quality control refers to the sum of all procedures undertaken to ensure the identity and purity of a particular pharmaceutical (WHO, 2010). Quality control measurements include stability testing of the drug formulation, dissolution testing and analysis of raw materials and synthesis products. A pharmaceutical company usually has to measure a large number of quality control samples and HPLC is a unique technique for the analysis of wide variety of samples (Dong, 2005). In this study, it was aimed to develop an accurate, precise, robust, rapid and selective HPLC method for determination of RIV in tablet dosage forms. The stability of RIV was evaluated and also a forced degradation procedure was applied under stress conditions like high temperature, acidic-alkali conditions, and irradiation with UV light. The developed method was fully validated according to the ICH (ICH, 2005) guidelines and observed that it was capable of determining RIV in the presence of forced degradation products. Therefore, it could be concluded that this method could be proposed for the quality control process of RIV in pharmaceutical industry.
MATERIAL AND METHODS
Chemicals and reagents
RIV working standard was supplied from Refik Saydam Hıfzısıhha National Public Health Agency. The
tested pharmaceutical formulations (Xarelto® 10 mg,
(approved in Canada, 2008) were procured from Bayer Turkey. Acetonitrile (ACN) was analytical grade and purchased from Merck.
Apparatus and Chromatographic conditions
HPLC analyses were performed on a Shimadzu UFLC
system. Separations were carried on a Phenomenex Luna 5 µm C18 100 Å LC Column (250 x 4.6 mm). The
column temperature was set at 40 oC and the low rate was
1.2 mL min-1 while using isocratic elution with ACN:Water
(55:45 v/v) mixture. Injection volume was 5 μL and UV detection was performed at 249 nm. Peak identity was conirmed by retention time comparison.
Preparation of standard solution
The standard stock solution of RIV (1000 µg mL-1)
was prepared in ACN:Water (80:20 v/v) mixture. The working standard solutions (5.0, 10.0, 20.0, 25.0, 30.0,
35.0 and 40 µg mL-1) were prepared by diluting the stock
solution in the mobile phase solution. The stock solution
was kept at +4 oC where it is stable at least one month.
Standard solutions were daily prepared by diluting the stock solution with mobile phase solution.
Preparation of sample solution
Ten tablets were weighed to get the average weight and grounded. An amount of powder equivalent to 10 mg of RIV was transferred to a 100 mL volumetric lask and added 70 mL of diluent (ACN:Water (80:20 v/v)) and sonicated for 30 min. The volume was made up with
solvent to obtain a solution containing 100 μg mL-1 RIV.
An aliquot was then removed and centrifuged at 5000 rpm for 10 min. The solution was filtered using 0.45 μm membrane ilter paper and diluted with mobile phase to
20 μg mL-1 before injected to the HPLC system.
Preparation of analytical placebo solution
Common inactive ingredients such microcrystalline cellulose (10%, 500 mg), anhydrous dibasic calciumphosphate (83%, 4150 mg), croscarmellose sodium (5%, 250 mg), colloidal silicon dioxide (%1, 50 mg), and magnesium stearate (%1, 50 mg) were weighed according to the ratios in a common tablet formulation to achieve 5 g of bulk. Then, approximately 1 g of this bulk was used to prepare the analytical placebo solutions by applying the same procedure on preparation of tablet solutions. Synthetic tablet solutions were prepared by adding known amounts of RIV standard solutions to the analytical placebo solutions.
Forced Degradation
High Temperature
to 1000 µL by adding water. The concentration of RIV
was 100 µg mL-1 in the inal solution. Then the solution
was transferred to a centrifuge tube and kept in a water bath for 2 h at 80 °C. The solution was cooled to room temperature (25 ± 5 °C), and then it was diluted with
mobile phase to 20 µg mL-1 and injected into the HPLC
system.
Acid and alkali hydrolysis
100 µL of RIV standard stock solution was diluted to 1000 µL by adding 0.1 N hydrochloric acid, or 0.1 N sodium hydroxide. The concentration of RIV was
100 µg mL-1 in the inal solution. Then the solution was
transferred to a centrifuge tube and kept in a water bath
for 2 h at 40 oC. These solutions were cooled at room
temperature (25 ± 5 °C), after they were neutralized with suitable amount of hydrochloric acid or sodium hydroxide. The solutions were diluted with mobile phase
to 20 µg mL-1 and injected into the HPLC system.
Irradiation with ultraviolet light
100 µL of RIV standard stock solution was diluted to 1000 µL by adding water. The concentration of RIV
was 100 µg mL-1 in the inal solution. The solution was
exposed to UV light (254 nm) combined with tungsten lamp for 24 hours at room temperature. The solution was
then diluted with mobile phase to 20 µg mL-1 and injected
into the HPLC system.
Stability studies
The purpose of stability testing is to provide evidence on how the quality of drug product varies with time under the inluence of a variety of environmental factors such as temperature, humidity, and light. The standard stock
solution of RIV (1000 µg mL-1) prepared in ACN:Water
(80:20 v/v) was divided into two volumetric lasks (5 mL). These volumetric flasks were prevented from daylight and the irst one was kept at room temperature, while the
second one was kept at 4 oC inside the refrigerator. The
stability of RIV at room temperature was evaluated in
short term period (24 h), while the stability at 4 oC was
evaluated for 72 h (short-term) and 1 month (long-term). The solutions were then diluted with mobile phase to
20 µg mL-1 and injected into the HPLC system.
RESULTS AND DISCUSSION
For developing and validating an HPLC method, the most common approach is to optimize the mobile phase composition after an appropriate column has been
selected (Synder et al., 1997). RIV is a non-hygroscopic
powder only slightly soluble in organic solvents and it is practically insoluble in water and aqueous media. According to our observation, RIV was slightly dissolved in methanol (MeOH) on the preparation of standard stock solutions process. Therefore, the solubility of RIV was tested simply in various organic solvents in the initial experiments and it was concluded that RIV was clearly soluble in acetonitrile (ACN). Thus, it was decided to use the mixture of ACN and water in different proportion on the separation of RIV through C18 column. Since caffeine could be eluted with ACN:water mixture without using any buffer and it is an easy to ind chemical for quality control laboratories, it was used as the internal standard (IS) for the experiments. A well-defined peak for caffeine was observed at 2.21 min. under the experimental conditions. Even though the column temperature is an important parameter on separation of organic compounds by HPLC, the effect of the solvent strength is usually stronger than
the effect of temperature on solute retention (Cuiru et al.,
2005). It was seen that changing the column temperature
between 30–40 oC, changed the retention time of RIV not
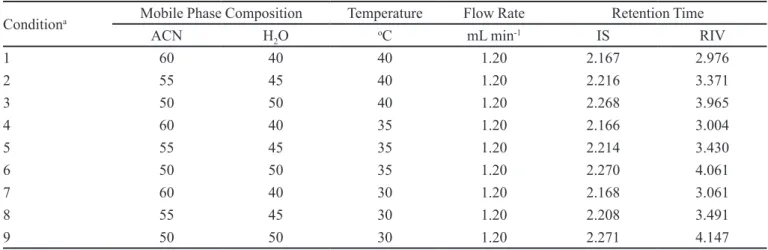
more than 5% and did not effect the retention time of IS noticeably. According to the results, it was obvious that RIV could be easily separated and analyzed less than 4 minutes in various conditions given in Table I. However, it was observed that better peaks shapes were obtained by increasing the temperature of the column. Since, the backpressure of the column was tolerable, the low rate
was kept at 1.2 mL min-1 to improve the eficiency besides
decreasing the retention time. In conclusion, it was decided
to use ACN-Water ratio as 55:45 (v/v) at 40 oC to perform
the analyses. The UV Spectrum of the RIV in mobile phase shows clearly that 249 nm is better to use in to observe the maximum absorbance while it is being prevented from interference coming from matrix components. The chromatograms of standard, tablet, analytical placebo solutions and RIV solution degraded at high temperature taken under optimum conditions are given in Figure 2.
System Suitability
TABLE I - Retention time of IS and RIV on various conditions of mobile phase composition and chromatographic column temperature
Conditiona Mobile Phase Composition Temperature Flow Rate Retention Time
ACN H2O oC mL min-1 IS RIV
1 60 40 40 1.20 2.167 2.976
2 55 45 40 1.20 2.216 3.371
3 50 50 40 1.20 2.268 3.965
4 60 40 35 1.20 2.166 3.004
5 55 45 35 1.20 2.214 3.430
6 50 50 35 1.20 2.270 4.061
7 60 40 30 1.20 2.168 3.061
8 55 45 30 1.20 2.208 3.491
9 50 50 30 1.20 2.271 4.147
aCondition 2 is selected to perform the analysis
FIGURE 2 - Representative chromatograms obtained under the optimum chromatographic conditions for RIV standard, RIV tablet, analytical placebo solutions and RIV solution degraded at high temperature.
the proposed HPLC method for routine analysis of RIV.
Method validation
The proposed method was validated as to selective, linearity range, sensitivity, precision, accuracy, robustness and ruggedness according to the ICH guideline (ICH, 2005).
Forced degradation and stability studies
TABLE II - System suitability parameters for the proposed method
RIV IS
Retention Time (min) 3.37 2.21 Capacity Factor (k’) 1.32 0.52
Eficiency (N) 7997 6369
Peak Symmetry 1.18 1.39
Resolution 8.9
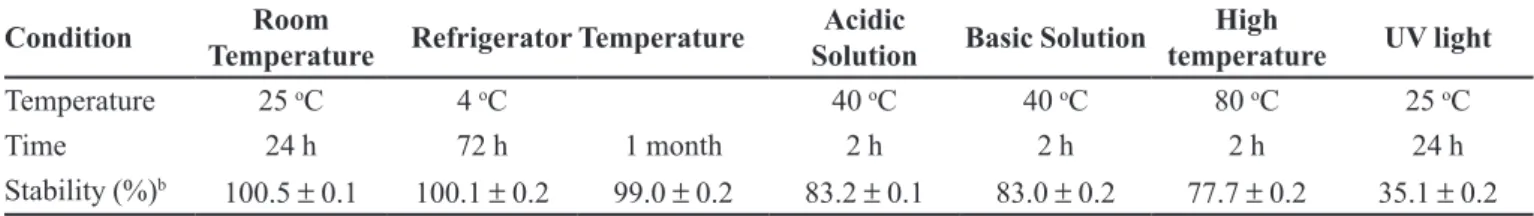
inside refrigerator. The ICH guideline entitled stability testing of drug substances and products requires the stress testing to be carried out to elucidate the inherent stability characteristics of the active substance, and provide a rapid identiication of differences that might result from changes in the manufacturing processes or source sample (ICH, 2005). The aim is to quantify the standard drug
alone and resolve its degradation products (Bakshi et al.,
2002). As described in the experimental section, different stress conditions were applied: high temperature, acid-base hydrolysis and irradiation with UV light. Under all these conditions the degradation products were observed at 1.35 min (Figure 2). The method was able to separate completely the degradation products from the intact RIV. As shown in Figure 2, it is conirmed the selectivity of the proposed method with the presence of the degradation products. Stability studies of RIV at room temperature for
24 h, 4 oC refrigeration temperature for 72 h (short-term)
and 1 month (long-term) were also investigated. Forced degradation and stability studies show that RIV was stable
at root temperature for 24 h and stable at 4 oC refrigeration
temperature at least for 1 month, but not stable in acidic and alkaline medias and also not stable in high temperature and under the UV light. The forced degradation and stability results are given in Table III.
Selectivity
Selectivity of a method refers to the extent to which it can determine particular analyte(s) in a complex
mixture without interference from other components in the mixture. Selectivity of the method was evaluated by preparing the analytical placebo sample, standard solution and sample of commercial pharmaceutical formulation. A solution of analytical placebo (containing all the tablet excipients except RIV) was prepared as given in the sample preparation procedure and injected into the HPLC system. The placebo chromatograms did not show any other peaks, thus, it was conirmed the selectivity of the method. The peak purities confirmed that the peaks on the standard solutions, tablet solutions and forced degradation solution are not interfered coming from matrix components. The retention times of peaks and peak areas were identical for the standard solutions and the tablet solutions and the method was capable of separating RIV and IS from forced degradation products. The chromatograms of standard, tablet, placebo and forcedly degraded RIV solutions were given in Figure 2.
Linearity
The linearity of an analytical procedure is its ability (within a given range) to obtain test results, which are directly proportional to the concentration (amount) of analyte in the sample. Calibration curve was constructed for RIV standards by plotting the concentrations versus peak area ratios. The graph proved that the method was
linear up to 40 µg mL-1. Eight different standard solutions
within the linear range containing 5.0, 10.0, 20.0, 25.0,
30.0, 35.0 and 40 µg mL-1 of RIV and 40 µg mL-1 of IS
were prepared and injected into the HPLC system. The linearity was evaluated by linear regression analysis and the regression equations were calculated from the calibration graphs, along with the standard deviations of the slope (Sb) and intercept (Sa) of the calibration curve (Table IV).
Sensitivity
Limit of detection (LOD) and quantiication (LOQ)
TABLE III - Recuperation (%) of RIVa after the exposition on various conditions of temperature, pH and UV light
Condition Room
Temperature Refrigerator Temperature
Acidic
Solution Basic Solution
High
temperature UV light Temperature 25 oC 4 oC 40 oC 40 oC 80 oC 25 oC
Time 24 h 72 h 1 month 2 h 2 h 2 h 24 h
Stability (%)b 100.5 ± 0.1 100.1 ± 0.2 99.0 ± 0.2 83.2 ± 0.1 83.0 ± 0.2 77.7 ± 0.2 35.1 ± 0.2 aRIV solutions were prepared as described in experimental section and prevented from daylight. bStability results are given as
are estimated from the signal-to-noise ratio. The detection limit is deined as the lowest concentration level resulting in a peak height of three times the baseline noise. The quantitation limit is deined as the lowest concentration level that provided a peak height with a signal-to-noise ratio higher than 10, with precision (RSD%) and accuracy (Bias%) within ±10%. LOD and LOQ values of HPLC
method were determined to be 0.001 and 0.005 µg mL-1,
respectively (Table IV).
Precision and Accuracy
Accuracy of the assay method was determined for both intra-day and inter-day variations using the six times analysis of the quality control samples. Three different concentrations of standard RIV solutions (within the linear range) were analyzed on six consecutive days (inter-day precision) and six times within the same day (intra-day precision). The obtained values for relative standard deviation (RSD) and Bias of intra- and inter-day studies indicated that the precision and accuracy of the method were satisfactory. The results are summarized in Table V.
Recovery
In order to know whether the excipients in the pharmaceutical formulations interfere with the analysis, the recovery tests were performed by standard addition technique. Three concentration levels were selected and known amounts of RIV standard solutions were added into the tablet solutions. The inal concentrations were within the linear range. These solutions were prepared
three times and analyzed through the developed method. Comparison of the intercepts of calibration curve
(0.0952 ± 0.007 (mean ± SE)) with standard additions
technique (0.0936 ± 0.0201 (mean ± SE)) indicates that
they were identical and there was no interference coming from matrix components. The other perspective on recovery studies was to analyze synthetic tablet solutions by the proposed method. Synthetic tablet solutions were prepared six times and analyzed by the developed method
and 97.89 ± 0.68 percent of the standard RIV were
recovered from synthetic tablet solutions.
Robustness
The robustness of an analytical procedure is a measure of its capacity to remain unaffected by small but deliberate variations in method parameters and provides an indication of its reliability during normal usage. The
variations on column temperature (± 5 oC) and ratio
of organic content in the mobile phase (± 5% on ACN
volume) did not have any signiicant effect on response. The peak area ratios were changed relatively between 99.8 – 102.4% within these small changes on mobile phase component and column temperature. The results were evaluated statistically, and there were no signiicant differences (p>0.05) within the results.
Reproducibility
Applying same procedures by two different operators showed the ruggedness of the developed method. The analysis results having no significant difference indicate that the proposed method is robust.
TABLE V - Precision and accuracy of the developed method
Added (µg mL-1)
Intra-day Inter-day
Founda
(µg mL-1) Precision b
RSD % Accuracy
c
Bias % (µg mLFound -1) Precision RSD % Accuracy Bias %
RIV 10 10.26 ± 0.13 2.15 2.56 9.80 ± 0.08 1.33 -1.98
20 20.15 ± 0.16 1.34 0.74 20.23 ± 0.35 3.01 1.16
35 35.15 ± 0.30 1.49 0.41 35.06 ± 0.11 0.52 0.16
aFound: mean ± standard error (n=6); bRSD: Relative standard deviation; Bias: [(Found - Added)/Added] x 100
TABLE IV - Linearity of RIV analyses by the developed method
Method Range (µg mL-1) Calibration Curvea Sa Sb R2 LOQ LOD
HPLC 5.0 -40.0 y = 0.0952x – 0.0330 0.0007 0.0183 0.9997 0.005 0.001
a Based on six calibration curves where y: peak area ratio and x: concentration of RIV as µg mL-1; Sa: Standard error of intercept
Application of the developed method
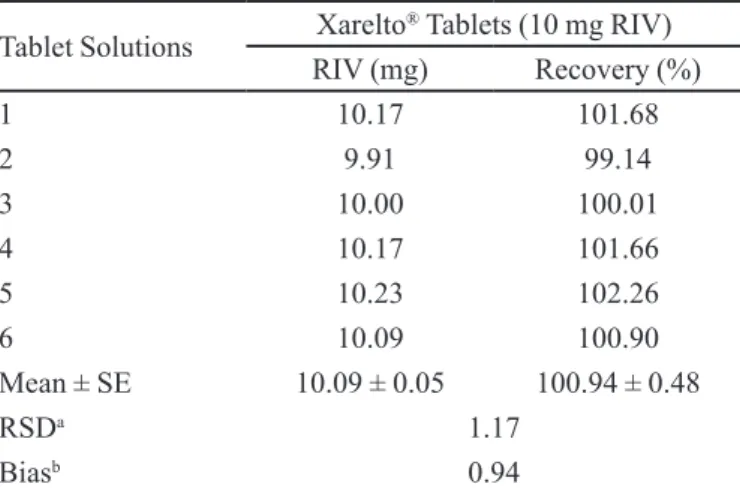
The validated method was applied for the
determination of RIV in commercially available Xarelto®
(10 mg) tablets. Figure 2 illustrates a typical type of HPLC chromatogram of tablet solution of RIV at a retention time 3.37 min with no interference of excipients present in tablets. The tablet analysis results were given in Table VI. The results of the assay (n=6) yielded 100.94% (RSD = 1.17 and SE = 0.53) of the labeled claim. These results indicate that the method is selective for the analysis RIV without interference of the excipients. The low RSD value with proper accuracy indicates the suitability of this method for the routine analysis of RIV.
CONCLUSION
In the present study, an attempt was made to develop a simple, accurate, selective and sensitive RP-HPLC method of RIV in pharmaceutical analysis. This method is the only reported method up to date for the determination of RIV in pharmaceutical dosage forms. The method was validated for selectivity, accuracy, linearity, precision (inter-day and intra-day), sensitivity, robustness and ruggedness in accordance with ICH guidelines. The results from stress testing, including separation of the degradation product and quantiication of RIV after exposure to stress conditions show the method is stability-indicating and capable of determining RIV in presence of its degradation products, which indicates the selectivity of the method. A simple mobile phase without preparation of any buffer solution or adding ion-pairing agents and a short run time are
advantageous and make this method suitable for routine analysis of large number of samples per day.
ACKNOWLEDGEMENTS
The authors are highly grateful to Bayer Türk Kimya San. Ltd. Şti., Istanbul, Turkey, for providing the drug samples.
REFERENCES
BAKSHI, M.; SINGH, S. Development of validated stability-indicating assay methods-critical review. J. Pharm. Biomed. Anal., v.28, p.1011-1140, 2002.
CUIRU, Z.; GOODALL, D.M.; WREN, S.A.C. Elevated temperature HPLC: Principles and applications to small molecules and biomolecules. LCGC Asia Pacific, v.8,
p.48-59, 2005.
DONG, M. W. Handbook of pharmaceutical analysis by HPLC.
Elsevier: United Kingdom, 2005. v.6, p.2-3
DUGGAN, S.T.; SCOTT, L.J.; PLOSKER, G.L. Rivaroxaban a review of its use for the prevention of venous thromboembolism after total hip or knee replacement surgery. Drugs, v.69, p.1829-1851, 2009.
INTERNATIONAL CONFERENCE ON HARMONIZATION (ICH). Text on validation of analytical procedure:
methodology: Q2(R1), 2005. Available at: <http://www. ich.org> Accessed on: 19 May 2012.
PERZBORN, E.; KUBITZA, D.; MISSELWITZ, F. Rivaroxaban: A novel, oral, direct factor Xa inhibitor in clinical development for the prevention and treatment of thromboembolic disorders. Hämostaseologie, v.27,
p.282-289, 2007.
ROHDE, G. Determination of rivaroxaban - a novel, oral, direct Factor Xa inhibitor - in human plasma by high-performance liquid chromatography-tandem mass spectrometry. J. Chromatogr. B., v.872, p.43-50, 2008.
SNYDER, L.R.; GLAJCH, J.L.; KIRKLAND, J.J. Practical HPLC method development. 2ed. New York: John Wiley
& Sons, 1997. Chapter 1.2
TERRY, C.; SUM, L. Rivaroxaban: an oral direct factor Xa inhibitor for the prevention of thromboembolism. Cardiol. Rev., v.17. p.192-197, 2009.
TABLE VI - Tablet analysis results
Tablet Solutions Xarelto® Tablets (10 mg RIV) RIV (mg) Recovery (%)
1 10.17 101.68
2 9.91 99.14
3 10.00 100.01
4 10.17 101.66
5 10.23 102.26
6 10.09 100.90
Mean ± SE 10.09 ± 0.05 100.94 ± 0.48
RSDa 1.17
Biasb 0.94
aRSD : Relative standard deviation; bBias : [(Found - Added)/Added]
WORLD HEALTH ORGANIZATION. WHO technical report series no. 957, WHO expert committee on speciications for pharmaceutical preparations, Forty-fourth report, 2010. Available at: <http://www.who.int/en/>. Accessed on: 19 May 2012.
Received for publication on 19th June 2012