Submitted on: 04/16/2010 Approved on: 07/09/2010
Correspondence to: Thyago Proença de Moraes Fundação Pró Renal Av. Vicente Machado 2190. Curitiba – Paraná – Brazil CEP: 80440-020
E-mail: thyagomoraes@ hotmail.com
We declare no conflict of interest
Authors
Thyago Proença de Moraes1
Sergio Gardano Elias Bucharles2
Silvia Carreira Ribeiro3
Ricardo Frumento4
Miguel Carlos Riella1
Roberto Pecoits-Filho1
1Fundação Pró Renal Brasil, Pontifícia Uni-versidade Católica do Paraná
2Instituto do Rim do Paraná
3Fundação Pró Renal Brasil
4Pontifícia Universidade Católica do Paraná
Low-calcium peritoneal dialysis solution is effective
in bringing PTH levels to the range recommended by
current guidelines in patients with PTH levels < 150 pg/dL
A
BSTRACTIntroduction/objective: Adinamic bone dis-ease (ABD) is a common finding in perito-neal dialysis (PD) and is associated with higher risk of developing cardiovascular and bone disease. Data from BRAZPD in-dicates that 3.5 mEq/L calcium PD solutions represents the majority of PD prescriptions in the country. A positive calcium balance can contribute to ABD development. Cur-rently guidelines suggest that PTH-i levels in end stage renal disease should be kept from 150-300 pg/mL. The purpose of this study is to evaluate 6 month PTH-i response after conversion to 2.5 mEq/L calcium PD solu-tion in patients with baseline PTH-i levels < 150 pg/mL. Methods: Prospective, ob-servational study of all prevalent patients (at least 90 days on therapy) on PD of a single Brazilian center from January 2008 to May 2009. Inclusion criteria (1) be in use of a PD solution with 3.5mEq/L of calcium; (2) baseline PTH leves < 150 pg/ mL. According to clinical practice patients could be switched to PD solutions with 2.5 mEq/L of calcium. Results: 35 patients (age 62 ± 17 years) were included. Of these 22 were converted to 2.5 mEq/L calcium so-lutions. Diabetic nephropathy (36%) was the main cause of renal disease followed by nephrosclerosis (25%) and glomerulo-nephritis (14%). Converted group present-ed a greater increase in PTH levels when compared with the control group (Δ194 pg/dL versus Δ 92/dL; p < 0,05). Among patients switched to low calcium solution, 41% reached the target values (PTH 150- 300 pg/mL) compared to 14% whose re-main with normal calcium solutions (p < 0.05). There were no differences between groups regarding calcium, phosphorus and alkaline phosphatase. Conclusion: In pa-tients with PTH < 150 pg/mL conversion
to low calcium solutions (2.5 mEq/L) ap-pears to be a simple and effective strategy to bring PTH levels to the range determined by current guidelines when compared with 3.5mEq/L calcium PD solutions.
Keywords: peritoneal dialysis, dialysis so-lutions, calcium, parathyroid hormone. [J Bras Nefrol 2010;32(3):272-276]©Elsevier Editora Ltda.
I
NTRODUCTIONMineral bone metabolism disorders are often observed in patients with chronic kidney disease (CKD), even at the initial stages.1 Recently, the classification has
been standardized to Chronic Kidney Disease Bone Mineral Disorders (CKD-BMD), a concept that encompasses cli-nical biochemical and bone alterations, as well as information on cardiovascular calcification.2
The adynamic bone disease (ABD) is one form of presentation of this disorder that presents a high prevalence in perito-neal dialysis (PD) and is associated with a higher risk of cardiovascular disease and fractures.3 Histologically, ABD is
charac-terized by low bone remodeling, a reduced number of osteoblasts and osteoclasts, ab-sence of aluminum deposition and normal or reduced osteoid thickness.2,4,5 The
In Brazil, according to data from the Brazilian Peritoneal Dialysis Multicenter Study (BRAZPD), the calcium solutions at 2.5 mEq/L are seldom used in daily clinical practice. The use of a solution with a calcium concentration of 3.5 mEq/L, which is predo-minant in the country, promotes a positive calcium balance in most patients, differently from what is ob-served with calcium solutions at 2.5 mEq/L.6 This
po-sitive calcium balance can determine the suppression of secretion and synthesis of PTH, contributing to a higher prevalence of dynamic bone disease in patients submitted to peritoneal dialysis.
Our hypothesis is that the decrease in the calcium concentration in the PD solutions can induce an incre-ase in serum levels of PTH-i to the range recommen-ded by the current guidelines.
O
BJECTIVESOur objective was to evaluate the response of serum levels of PTH in six months after the decrease in cal-cium concentrations of the dialysate calcal-cium in pa-tients undergoing PD.
M
ATERIAL ANDM
ETHODSThis was a prospective, observational study, carried out in a single Brazilian renal replacement therapy (RRT) center. The study population consisted of all prevalent patients (more than 90 days) undergoing PD selected during the period from January 2008 to January 2009 that met the following inclusion criteria: (1) age ol-der than 18 years; (2) serum PTH < 150 pg/mL in the month of study enrollment; (3) use of PD solution with a calcium concentration of 3.5 mEq/L for at least 30 days. The exclusion criteria were: absence of a second analysis of serum PTH six months after the basal asses-sment. The follow-up period of the last patient ended in June 2009. All patients signed the Free and Informed Consent Form, authorizing the use of their test results for scientific purposes.
All nephrologists involved in the treatment of the study patients had the power to decide, at any mo-ment, to convert or not their patients to calcium solu-tions at 2.5 mEq/L, as deemed necessary. At the end of the follow-up period, the patients were divided in two groups: a group that started and finished the treatment using a calcium solution at 3.5 mEq/L (Control) and a group that was converted to a calcium solution at 2.5 mEq/L (Intervention) during the follow-up period.
All testes were collected according to the clinic’s routine and according to the norms established by Resolução da Diretoria Colegiada #154.
STATISTICALANALYSIS
Continuous variables are presented as means ± SD. Categorical variables are presented as percentages. The Student’s t test was sued to compare means be-tween 2 distinct groups. A p value < 0.05 was consi-dered significant. Analysis of covariance was carried out with ΔPTH as dependent variable and age and time of dialysis as co-variables.
R
ESULTSDuring the recruiting period, thirty-five patients met the inclusion criteria. Of these, twenty-two were con-verted to the calcium solution at 2.5 mEq/L and thir-teen kept using the calcium solution at 3.5 mEq/L. No patients were excluded from the study. Mean age was 62 ± 17 years and diabetic nephropathy was the main underlying disease causing CKD (36%), followed by hypertensive nephrosclerosis (25%) and chronic glo-merulonephritis (14%). The comparison of demogra-phic and laboratory characteristics between the two groups is shown in Table 1.
The Control group presented a higher prevalen-ce of diabetes as the underlying disease, when com-pared to the Intervention group (54% versus 30%, NS). However, there was no statistically significant difference between diabetic and non-diabetic patients, when compared regarding age (61.4 versus 61.5 ye-ars; p = 0.99), basal PTH values (79 versus 85pg/dL; p = 0.69), calcium (9.4 versus 9.8 mg/dL; p = 0.34) and phosphorus levels (4.7 versus 4.8mg/dL; p = 0.78).
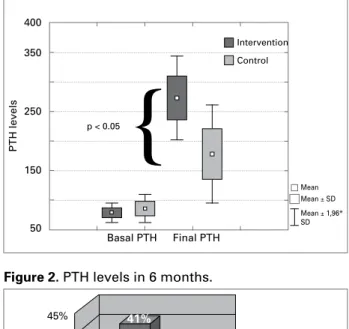
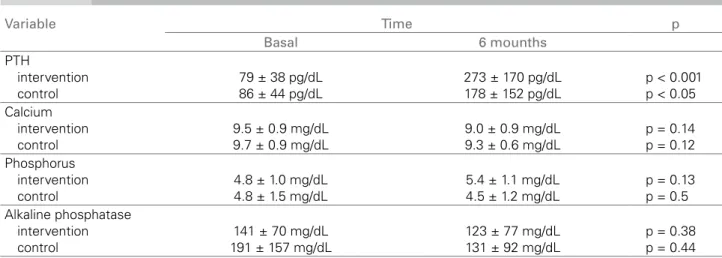
Although PTH values increased significantly in bo-th groups, bo-the increase was significantly higher in bo-the Intervention, when compared to the Control group, after six months of follow-up (ΔPTH 194 versus 92 pg/dL; p< 0.05) Figure 1. In the Intervention group, 41% of the patients reached PTH levels in six months that were within the target range recommended by the current guidelines (2 to 9 times the upper normali-ty limit or 150-500 pg/dL) versus 14% in the Control group (p < 0.05) Figure 2. There was no significant alteration in phosphorus, calcium and alkaline phos-phatase levels after the conversion to low-calcium concentration solution (Table 2).
Variable Group p
Control Intervention
Age 66 ± 1 60 ± 1 0.51
Female sex 38% 30% 0.62
Diabetes 54% 30% 0.16
Initial dose CaCO3 (mg) 1807 ± 1601 1477 ± 1577 0.55
Time of dialysis (months) 30 ± 28 17 ± 23 0.12
Basal PTH 86 ± 44 pg/mL 79 ± 38 pg/mL 0.51
Basal calcium 9.7 ± 0.9 mg/dL 9.5 ± 0.9 mg/dL 0.85
Basal phosphorus 4,8 ± 1.5 mg/dL 4.8 ± 1.0 mg/dL 0.82
Basal alkaline phosphatase 191 ± 157 mg/dL 141 ± 70 mg/dL 0.003
Table 1 COMPARISONOFTHEVARIATIONSINLABORATORYASSESSMENTSINTHEGROUPSATBASALTIMEANDAFTERSIXMONTHS
t test (independent samples): CaCO3 = Calcium Carbonate.
Figure 1. PTH values.
Figure 2. PTH levels in 6 months. basal values and after six months of PTH, calcium,
phosphorus and alkaline phosphatase.
The analysis of covariance using age and time of dialysis as possible confounding factors had estimated means of ΔPTH = 189 ± 44 for group with a calcium solution of 2.5 mEq/L and 94 ± 49 for the control group (p < 0.05).
D
ISCUSSIONThe calcium balance in peritoneal dialysis (PD) is closely related to the concentration of this ion in the dialysis solution.6 A positive calcium balance can
in-duce hypercalcemia, inhibit the secretion of PTH and stimulates the development of adynamic bone disease in patients undergoing PD.
The causes of low bone remodeling in chronic kid-ney disease (CKD) are multiple and among them are the low levels of 1.25 dihydroxyvitamin D, metabolic acidosis and calcium overload (as phosphorus chela-ting agents or offered in the dialysis bath), in addition to low levels of estrogen and progesterone, systemic inflammation and unintentional ample use of vitamin D. Three important clinical conditions associated wi-th ABD and wi-that are often observed in patients un-dergoing PD include diabetes mellitus, older age and malnutrition.7
The two main determinants of a positive calcium balance, in addition to its concentration in the dialy-sis solution, have been determined by Montenegro et al., who found an important negative correlation of the calcium balance (in patients undergoing CAPD) between the total ultrafiltration values (r = -0.7, p < 0.00001) and the serum calcium concentration (r = -0.49, p < 0.0001). Although there are a few studies in which the serum PTH levels did not increase with the use of calcium solutions at 2.5 mEq/L, most of them have shown that this is a frequent response to
the decrease in calcium concentrations in the dialysis bath.8-13 Pagliari et al., in the beginning of the 90s,
we-re among the first to verify the incwe-rease in serum levels of PTHi in 10 patients undergoing CAPD 48 hours after the dialysis solution was exchanged by a calcium solution of 2.5 mEq/L.13 Johnson et al. compared the
clinical, biochemical and radiological parameters of 45 patients randomized to solutions with diffe-rent calcium concentrations.9 PTH levels increased
350 400
250
150
50
45% 40% 35% 30% 25% 20% 15%
10% 5% 0%
Basal PTH Final PTH
Intervention
Control
p < 0.05
Mean Mean ± SD Mean ± 1,96* SD
41%
14%
p < 0.05
Intervention
Control
Variable Time p
Basal 6 mounths
PTH
intervention control
79 ± 38 pg/dL 86 ± 44 pg/dL
273 ± 170 pg/dL 178 ± 152 pg/dL
p < 0.001 p < 0.05 Calcium
intervention control
9.5 ± 0.9 mg/dL 9.7 ± 0.9 mg/dL
9.0 ± 0.9 mg/dL 9.3 ± 0.6 mg/dL
p = 0.14 p = 0.12 Phosphorus
intervention control
4.8 ± 1.0 mg/dL 4.8 ± 1.5 mg/dL
5.4 ± 1.1 mg/dL 4.5 ± 1.2 mg/dL
p = 0.13 p = 0.5 Alkaline phosphatase
intervention control
141 ± 70 mg/dL 191 ± 157 mg/dL
123 ± 77 mg/dL 131 ± 92 mg/dL
p = 0.38 p = 0.44
t test (dependent samples).
Table 2 COMPARISONOFTHEVARIATIONSINLABORATORYASSESSMENTSINTHEGROUPSATBASALTIMEANDAFTERSIXMONTHS
significantly in the first six months of follow-up, an increase that did not persist after one year, probably due to the use of calcium-based and calcitriol-based phosphorus chelating agents. The impact of the in-crease in PTH levels caused by the use of calcium solutions at 2.5 mEq/L had not been assessed until Sanchez et al. randomized 44 patients to a calcium solution at 2.5 mEq/L or 3.5 mEq/L and evaluated the bone histology of these individuals in the begin-ning of therapy and after one year of follow-up.12
Although they found a significant increase in PTH levels in the group submitted to calcium solutions at 2.5 mEql/L after 3, 6, 9 and 12 months, there was no alteration in histological pattern between the two groups. Differently, Haris et al. reported the norma-lization of bone histology in patients with adynamic bone disease after the conversion to calcium solution at 2.5 mEq/L in 16 months.8
In the present study, we evaluated the impact of the use of a calcium solution at 2,5 mEq/L on PTH values in patients undergoing DP. The two groups assessed (Intervention and Control) presented a significant in-crease in PTH levels after six months of follow-up. The increase in the PTH values in the Intervention group was higher and more significant than in the Control group. However, there is no evidence in the literature on the risk of developing hyperparathyroidism with the chronic use of calcium solutions at 2.5 mEq/L and its use must be evaluated individually for each case.
The other biochemical parameters related to mine-ral metabolism (total calcium, phosphorus and alka-line phosphatase) were not different between the two groups. No patient included in the study was using or used calcitriol or vitamin D during the follow-up
period. Similarly, there was no difference regarding the dose of phosphorus chelating agents used by the groups, both at the initial assessment and after the six-month study period.
Known confounding factors that can interfere with PTH values were assessed. Age, an independent risk factor for the development of ABD,4,11,14 did not
inter-fere with the variables of mineral metabolism in the present study. Similarly, the time of dialysis was not a factor that was significantly associated with PTH variation between the groups and in general (data not shown). Regarding the metabolism of carbohydrates, in spite of the knowledge that hyperglycemia and in-sulin deficiency can inhibit the secretion of PTH and that the products of advanced glucose degradation alter the responsiveness of osteoblasts to regulatory hormones and cytokines,15 the presence of diabetes
was not a determinant factor on PTH levels at basal time and after 6 months.
Among the several limitations of the present study, we can mention the fact that it was carried out in a single center; the sample size was small; the absen-ce of serum albumin analysis in the patients, a factor recently associated with low bone remodeling;16 the
lack of measurement of patients’ residual diuresis, of which presence is of utmost importance in phospho-rus excretion, as well as data on ultrafiltration.
In conclusion, the use of a calcium solution at 2.5 mEql/L is an effective option to increase PTH levels in patients that present levels below those recommended by the guidelines in the short term. The individuali-zation of the prescription, according to the needs and responses of each patient to the different solutions of PD remains the most sensible approach, until evidence that establishes the best approach strategy for mineral disorders in patients undergoing PD is demonstrated.
R
EFERENCES1. Levin A, Bakris GL, Molitch M et al. Prevalence of ab-normal serum vitamin D, PTH, calcium, and phospho-rus in patients with chronic kidney disease: results of the study to evaluate early kidney disease. Kidney Int 2007; 71:31-8.
2. Diretrizes brasileiras de prática clínica para o distúrbio mineral e ósseo na doença renal crônica. J Bras Nefrol 2008; 30(S2).
3. Coco M, Rush H. Increased incidence of hip fractures in dialysis patients with low serum parathyroid hor-mone. Am J Kidney Dis 2000; 36:1115-21.
4. Sherrard DJ, Hercz G, Pei Y et al. The spectrum of bone disease in end-stage renal failure: an evolving disorder. Kidney Int 1993; 43:436-42.
5. KDIGO. Kidney Int 2009; 76:S1-130.
6. Bender FH, Bernardini J, Piraino B. Calcium mass trans-fer with dialysate containing 1.25 and 1.75 mmol/L cal-cium in peritoneal dialysis patients. Am J Kidney Dis 1992; 20:367-71.
7. Andress DL. Adynamic bone in patients with chronic kidney disease. Kidney Int 2008; 73:1345-54.
8. Haris A, Sherrard DJ, Hercz G. Reversal of adynamic bone disease by lowering of dialysate calcium. Kidney Int 2006; 70:931-7.
9. Johnson DW, Rigby RJ, McIntyre HD, Brown A, Freeman J. A randomized trial comparing 1.25 mmol/l calcium dialysate to 1.75 mmol/l calcium dialysate in CAPD patients. Nephrol Dial Transplant 1996; 11:88-93.
10. Weinreich T, Passlick-Deetjen J, Ritz E. Low dialysate calcium in continuous ambulatory peritoneal dialysis: a randomized controlled multicenter trial. The Peritoneal Dialysis Multicenter Study Group. Am J Kidney Dis 1995; 25:452-60.
11. Carmen Sanchez M, Auxiliadora Bajo M et al.
Parathormone secretion in peritoneal dialysis patients with adynamic bone disease. Am J Kidney Dis 2000; 36:953-61.
12. Sanchez C, Lopez-Barea F, Sanchez-Cabezudo J et al. Low vs. standard calcium dialysate in peritoneal di-alysis: differences in treatment, biochemistry and bone histomorphometry. A randomized multicentre study. Nephrol Dial Transplant 2004; 19:1587-93.
13. Pagliari B, Baretta A, de Cristofaro V et al. Short-term effects of low-calcium dialysis solutions on calcium mass transfer, ionized calcium, and parathyroid hor-mone in CAPD patients. Perit Dial Int 1991; 11:326-9.
14. Torres A, Lorenzo V, Hernandez D et al. Bone
dis-ease in predialysis, hemodialysis, and CAPD patients: evidence of a better bone response to PTH. Kidney Int 1995; 47:1434-42.
15. Weinreich T. Prevention of renal osteodystrophy in peritoneal dialysis. Kidney Int 1998; 54:2226-33. 16. Sanchez-Gonzalez MC, Lopez-Barea F, Bajo MA,