Higher mineralized bone volume is associated
with a lower plain X-Ray vascular calcification
score in hemodialysis patients
Teresa Adragao1*, Anibal Ferreira2, Joao M. Frazao3, Ana Luisa Papoila4, Iola Pinto5, Marie-Claude Monier-Faugere6, Hartmut H. Malluche6
1Nephrology Department, Santa Cruz Hospital, Lisbon, Portugal,2Nephrology Department, Curry Cabral Hospital, Lisbon, Portugal,3Nephrology Department, S Joao Hospital, Medical School and Nephrology Research and Development Unit, University of Porto, Porto, Portugal,4CEAUL, CEDOC, Nova Medical School/FCM, New University, Lisbon, Portugal,5ISEL, CMA FCT-UNL, Lisbon, Portugal,6Division of Nephrology, Bone and Mineral Metabolism, University of Kentucky, Lexington, KY, United States of America
*tadragao@gmail.com
Abstract
Background and objectives
In dialysis patients, there is an increasing evidence that altered bone metabolism is associ-ated with cardiovascular calcifications. The main objective of this study was to analyse, in hemodialysis patients, the relationships between bone turnover, mineralization and volume, evaluated in bone biopsies, with a plain X-ray vascular calcification score.
Design, setting, participants and measurements
In a cross-sectional study, bone biopsies and evaluation of vascular calcifications were per-formed in fifty hemodialysis patients. Cancellous bone volume, mineralized bone volume, osteoid volume, activation frequency, bone formation rate/bone surface, osteoid thickness and mineralization lag time were determined by histomorphometry. Vascular calcifications were assessed by the simple vascular calcification score (SVCS) in plain X-Ray of pelvis and hands and, for comparison, by the Agatston score in Multi-Slice Computed Tomography (MSCT).
Results
SVCS3 was present in 20 patients (40%). Low and high bone turnover were present in 54% and 38% of patients, respectively. Low bone volume was present in 20% of patients. In multivariable analysis, higher age (p = 0.015) and longer hemodialysis duration (p = 0.017) were associated with SVCS3. Contrary to cancellous bone volume, the addition to this model of mineralized bone volume (OR = 0.863; 95%CI: 0.766, 0.971; p = 0.015), improved the performance of the model. For each increase of 1% in mineralized bone volume there was a 13.7% decrease in the odds of having SVCS3 (p = 0.015). An Agatston score>400 was observed in 80% of the patients with a SVCS3 versus 4% of patients with a SVCS<3, (p<0.001).
a1111111111 a1111111111 a1111111111 a1111111111 a1111111111 OPEN ACCESS
Citation:Adragao T, Ferreira A, Frazao JM, Papoila AL, Pinto I, Monier-Faugere M-C, et al. (2017) Higher mineralized bone volume is associated with a lower plain X-Ray vascular calcification score in hemodialysis patients. PLoS ONE 12(7): e0179868.
https://doi.org/10.1371/journal.pone.0179868
Editor:Pasqual Barretti, Universidade Estadual Paulista Julio de Mesquita Filho, BRAZIL
Received:January 14, 2017
Accepted:June 4, 2017
Published:July 7, 2017
Copyright:©2017 Adragao et al. This is an open access article distributed under the terms of the
Creative Commons Attribution License, which permits unrestricted use, distribution, and reproduction in any medium, provided the original author and source are credited.
Data Availability Statement:All relevant data are within the paper and its Supporting Information files.
Funding:The funding provided by Genzyme for
Conclusion
Higher mineralized bone volume was associated with a lower plain X-ray vascular calcifica-tion. This study corroborates the hypothesis of the existence of a link between bone and vessel and reinforces the clinical utility of this simple and inexpensive vascular calcification score in dialysis patients.
Introduction
Vascular calcifications are associated with cardiovascular morbidity and mortality in dialysis patients [1–4]. It has been demonstrated that vascular calcification in dialysis and non-dialysis patients is an active cellular process, similar to bone formation [5–7]. In an experimental model, high levels of phosphorus and calcium [5] are some of the factors that activate the core binding factorα-1 (Cbfa-1), which is the first step for the differentiation of vascular smooth muscle cells into osteoblasts [5]. Reduction of calcification inhibitors, such as Fetuin-A, matrix-Gla protein [8] and pyrophosphate [9,10] may be another factor associated with the development of calcification. In dialysis patients, there is increasing evidence that altered bone metabolism is associated with cardiovascular calcifications.
KDIGO has recommended in 2006 a new classification for mineral and bone disorders of chronic kidney disease that includes the presence of vascular calcifications [11]. Low bone turnover [12–14] and low bone volume [15] have been associated with vascular calcifications. Adynamic bone disease [13] and osteoporosis have been associated with progression of coro-nary calcifications [16]. An association between osteoporotic fractures, vascular calcifications and mortality has been demonstrated in dialysis patients [17]. We have developed a simple vascular calcification score (SVCS) evaluated in plain X-Ray of pelvis and hands, which is a predictor of cardiovascular mortality and cardiovascular disease in dialysis patients [3,18,19] and in CKD patients not on dialysis [20]. The main objective of this study was to evaluate, in dialysis patients, relationships between histomorphometric parameters of bone turnover, min-eralization and volume with this simple vascular calcification score. The secondary objective was to evaluate, in the same patients, the agreement between the SVCS and the Agatston score obtained by multislice computed tomography (MSCT).
Material and methods
Study design
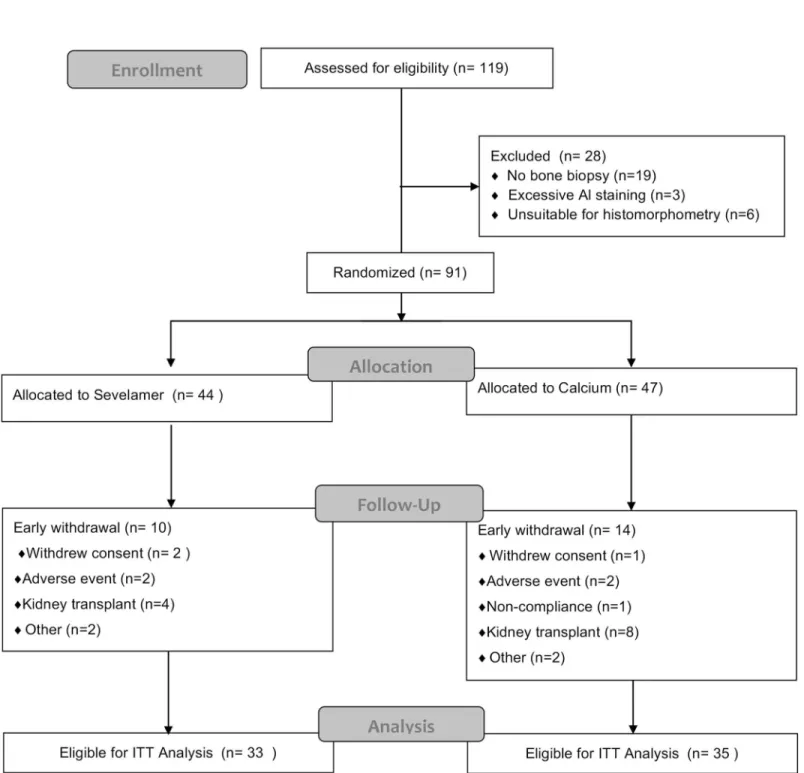
This is a cross-sectional study performed in a group of prevalent hemodialysis patients to eval-uate relationships between histomorphometric parameters of bone, evaleval-uated by bone biopsy, with vascular calcifications evaluated by plain X-ray (SVCS). This is an extension study per-formed in a cohort of 50 patients participating in a European randomized clinical trial, with the Study Number: GTC-68-402, that analysed the effect of sevelamer hydrochloride and cal-cium carbonate on bone turnover and mineralization in hemodialysis patients [21], (Fig 1). This randomized clinical trial was a requisition of EMA (European Medicines Agency) and was initiated in 2002. This trial has no registration number because The European Clinical Tri-als Register started after 1 May 2004 with the creation of EdraCT.
Our present study was an extension study from this clinical trial and included a group of 50 patients that accepted undergo evaluation of vascular calcifications in the same diagnostic cen-ter, in Lisbon, immediately after the second bone biopsy performed in the clinical trial. The
Competing interests:The funding provided by
protocol of this study was approved by the institutional ethical committees of the hemodialysis units participating in the study (FMC Entroncamento, Torres Vedras and Barreiro; CMDR, Fig 1. The intention-to-treat (ITT) population was defined as all patients who were randomly assigned, received one or more doses of study medication, and had a second bone biopsy.One patient in the sevelamer group completed treatment but did not have a second bone biopsy and so was excluded from the ITT analysis. Two patients in the calcium group withdrew from the study early but received one or more doses of study medication and had a second bone biopsy and so were included in the ITT analysis.
Centro Me´dico de Doenc¸as Renais, HPA, Hospital Particular Almada, SPD, Sociedade Portu-guesa de Dia´lise, Uninefro, Santo Tirso and NefroNorte, Paredes). All patients signed an informed consent, and all the studies procedures were in accordance with the recommenda-tions for research involving human beings of the Helsinqui Declaration (with the amendments of Tokyo 1975, Hong-Kong 1989, Somerset West 1996 and Edimburg 2000) and of the WHO).
Assessment of vascular calcifications
Vascular calcifications were assessed by the simple vascular calcification score (SVCS), a semi-quantitative score developed by us and evaluated in plain radiographs of pelvis and hands [3]. Pelvis films were divided into four sections by two imaginary lines: a horizontal line over the upper limit of both femoral heads and a median vertical line over the vertebral column. A hori-zontal line divided hand films over the upper limit of the metacarpal bones. In each section, the presence of any type of vascular calcification lining the vessel walls, either in a linear or irregular pattern, was rated as 1 and its absence as 0. Final score was the sum of calcifications found in all sections and ranged from 0 to 8. In the same diagnostic centre, vascular calcifica-tions were simultaneously assessed in 42 patients by the Agatston score, using Multislice Com-puted Tomography (MSCT). MSCT scans were performed with the four-slice technique on the model Somatom Volume Zoom (Siemens AG, Erlangen, Germany). Slices of 2.5 mm thickness were acquired under the following conditions: 120 kVp, 130 mAs, and 0.5 gantry rotation time. All images were transferred to a workstation and analysed with calcium scoring software (HeartView CT, Siemens AG, Erlangen, Germany).
Plain X-Ray calcifications and coronary Agatston score were evaluated at the same diagnos-tic center, 3.8±1.9 months after bone biopsy.
Bone biopsies and bone histomorphometry
All bone biopsies were performed in Lisbon (by A.F.) and Oporto (by J.M.F). Anterior iliac crest bone biopsies were done after tetracycline double labelling under local anesthesia and conscious sedation. The labelling schedule consisted of a 2 days oral administration of tetracy-cline hydrochloride (250 mg twice daily) followed by a drug-free interval of 10 days, and subse-quent oral administration of demeclocycline hydrochloride (300 mg twice daily) for 4 days. Bone biopsies were performed 3 to 4 days after completing the second label. Bone samples were obtained with the one-step electrical drill technique (Straumann Medical, Waldenburg, Switzerland). All bone samples were processed and analysed at the Bone Diagnostic and Research Laboratory, University of Kentucky, (Lexington, KY) without knowledge of the clini-cal data.
volume per bone volume (OV/BV) (Normal 0.57–6.00%). Bone histomorphometry nomencla-ture and units are in agreement with the 2012 update report of the ASBMR histomorphometry nomenclature committee [28]. Normal values are from American and European studies. These values have been used in prior studies including histomorphometric assessment of bone from patients of Portugal and other European countries and from the USA [15,21,29–34].
Biochemical analysis
Serum levels of the following biochemical parameters were evaluated and time averaged for the 12 months preceding the bone biopsy: serum calcium, phosphorus, and iPTH were evalu-ated every 4 weeks; bone specific alkaline phosphatase, 25-(OH)-vitamin D3; 1,25-(OH)2 -vita-min D3and lipid profile were evaluated every 6 months; iPTH was evaluated using the DPC Immulite PTH IRMA; the reference range is 25 to 87 pg/mL and the intra and inter-assay coef-ficients of variation are<7% and<9%, respectively; 1,25-(OH)2-vitaminD3and 25-(OH)-vita-min D were analysed by radioimmunoassay using LIAISON kits (DiaSorin, Sallugia, Italy). The reference range for 1,25-(OH)2-vitaminD3was 25 to 86.5 pg/mL and the intra and inter-assay coefficients of variation were<2.9% and<5.9%, respectively. The reference range for 25-(OH)-vitaminD3was 25 to 100 ng/mL and the intra and inter-assay coefficients of variation were 4.1% and 7% respectively. Total cholesterol, LDL-cholesterol, HDL-cholesterol and tri-glycerides were measured every 4 months by the Synchron LX system (Beckman Coulter, Ful-lerton, California).
Statistical analysis
An exploratory analysis was carried out for all variables. Categorical data were presented as fre-quencies and percentages, and continuous variables as mean±standard deviation or median and inter-quartile range (25thpercentile; 75thpercentile). Univariable analysis was done using Student´s t-test and nonparametric tests (Chi-square, Fisher’s Exact, Mann-Whitney U) when-ever outliers and skewed distributions were present.
The multivariable analysis was performed using logistic regression models where the dependent variable was SVCS after being dichotomized (SVCS<3 and SVCS3), according to previously demonstrated association with cardiovascular mortality (3,18). To obtain a first model (model 1), all the variables with a p-value<0.25 obtained in the univariable analysis and with clinical relevance, were considered. To compare bone parameters regarding their associa-tion with vascular calcificaassocia-tions measured by SVCS, three addiassocia-tional models were adjusted. These models were obtained by adding to model 1, separately, the variables BV/TV (bone vol-ume, model 2), Md.BV/TV (mineralized bone volvol-ume, model 3) and OV/BV (osteoid volvol-ume, model 4). Bone volume consists of mineralized bone volume and osteoid volume.
To quantify the improvement resulting from adding BV/TV, (Model 2), Md.BV/TV (Model 3) and OV/BV (Model 4) to Model 1, continuous net reclassification improvement (NRI) and integrated discrimination improvement (IDI) measures were calculated [35,36] (supplemental statistical analysis,S1 Table). Predictiveness curves were also calculated [37].
minimum p-value approach. Based on a systematic search for the best cut-point, the point that is associated with the minimum chi-squared test p-value or, equivalently, with the maximum chi-squared test value in a grid of marker values is identified [41]. Sensitivity, specificity, posi-tive predicposi-tive value, and negaposi-tive predicted value were calculated for the obtained cut-point.
Confidence intervals (95% CI) were also calculated, as required. The level of significance
α= 0.05 was considered.
All data were analyzed using SPSS 22.0 (IBM Corp.Released 2013.IBM SPSS Statistics for Windows.Armonk,NY:IBM Corp) and R software (R: A Language and Environment for Sta-tistical Computing, R Core Team, R Foundation for StaSta-tistical Computing, Vienna, Austria, 2014).
Results
Fifty patients (27 men and 23 women) from the above-mentioned randomized trial [21] were enrolled, with a mean age of 53.52±15.61 years and a median hemodialysis duration of 36.87 months (P25= 25.95; P75= 65.15). The only inclusion criterion for the present study was the patient’s agreement to undergo evaluation of vascular calcifications in a single centre which was performed at 3.8±1.9 months after bone biopsies.
Phosphate binders were given during the year before bone biopsies either with sevelamer hydrochloride in 26 patients, 52%; mean dose 4.1±1.9 g/day or calcium carbonate in 24 patients, 48%; mean dose 3.7±1.8 g/day. Twenty-nine patients (58%) were treated with active vitamin D with a mean dose 3.8±2.7μg/week. Eight patients (16%) were smokers and five (10%) were diabetic.
The demographic, biochemical, bone summary measures of the study sample and their association with SVCS are presented in Tables1and2, respectively. Vascular calcifications were detected by plain X-ray in 30 patients (60%). Pelvic vascular calcifications were present in 29 patients (58%) and hand vascular calcifications were present in 16 patients (32%). SVCS3 was found in 20 patients (40%). Low and high bone turnover were present in 27 patients (54%) and 19 patients (38%); there were no cases of osteomalacia. None of the bone biopsies showed positive stain for aluminium.
Univariable analysis
Demographic, biochemical and vascular calcification univariable analysis results are shown in
Table 1. Among the variables with a p-value<0.25, gender (p = 0.021), age (p = 0.030) and
diabetes (p = 0.007) were the factors associated with SVCS. In the group of patients with
SVCS3 (Table 1), 12 in 15 patients (80%) had an Agatston score>400 (p<0.001). Diabetes
had a very low prevalence in the study sample (n = 5; 10% with 0% in the group of patients with SVCS<3), and was not included in the multivariable analysis. The variable gender was also not included due to the low number of events in the female gender.
Results of bone parameters are shown inTable 2. Lower mineralized bone volume (p = 0.029) was associated with a SVCS3. We found no association between cancellous bone volume, oste-oid volume, osteoste-oid thickness, mineralization lag time, bone formation rate, activation frequency and high or low bone turnover with SVCS results.
Multivariable analysis
consists of mineralized bone volume and osteoid volume. For each increase of 1% in mineral-ized bone volume there was a 13.7% decrease in the odds of having SVCS3 (p = 0.015). The addition of mineralized volume to Model 1 resulted in an increased performance of the model. Table 1. Univariable analysis: Demographic, biochemical and vascular calcification parameters.
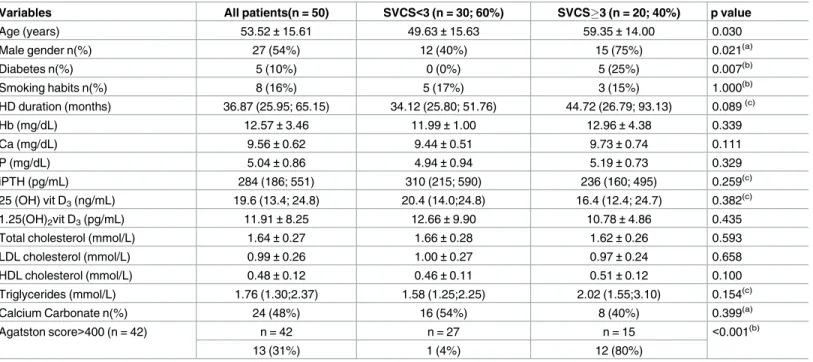
Variables All patients(n = 50) SVCS<3 (n = 30; 60%) SVCS3 (n = 20; 40%) p value
Age (years) 53.52±15.61 49.63±15.63 59.35±14.00 0.030
Male gender n(%) 27 (54%) 12 (40%) 15 (75%) 0.021(a)
Diabetes n(%) 5 (10%) 0 (0%) 5 (25%) 0.007(b)
Smoking habits n(%) 8 (16%) 5 (17%) 3 (15%) 1.000(b)
HD duration (months) 36.87 (25.95; 65.15) 34.12 (25.80; 51.76) 44.72 (26.79; 93.13) 0.089(c)
Hb (mg/dL) 12.57±3.46 11.99±1.00 12.96±4.38 0.339
Ca (mg/dL) 9.56±0.62 9.44±0.51 9.73±0.74 0.111
P (mg/dL) 5.04±0.86 4.94±0.94 5.19±0.73 0.329
iPTH (pg/mL) 284 (186; 551) 310 (215; 590) 236 (160; 495) 0.259(c)
25 (OH) vit D3(ng/mL) 19.6 (13.4; 24.8) 20.4 (14.0;24.8) 16.4 (12.4; 24.7) 0.382(c)
1.25(OH)2vit D3(pg/mL) 11.91±8.25 12.66±9.90 10.78±4.86 0.435
Total cholesterol (mmol/L) 1.64±0.27 1.66±0.28 1.62±0.26 0.593
LDL cholesterol (mmol/L) 0.99±0.26 1.00±0.27 0.97±0.24 0.658
HDL cholesterol (mmol/L) 0.48±0.12 0.46±0.11 0.51±0.12 0.100
Triglycerides (mmol/L) 1.76 (1.30;2.37) 1.58 (1.25;2.25) 2.02 (1.55;3.10) 0.154(c)
Calcium Carbonate n(%) 24 (48%) 16 (54%) 8 (40%) 0.399(a)
Agatston score>400 (n = 42) n = 42 n = 27 n = 15 <0.001(b)
13 (31%) 1 (4%) 12 (80%)
Continuous data are summarized as mean±standard deviation or median (25thpercentile; 75thpercentile); SVCS, simple vascular calcification score; HD, Hemodialysis, Hb, hemoglobin; Ca, calcium; P, phosphorus; iPTH, intact parathyroid hormone
(a)Pearson Chi-Square test (b)Fisher’s exact test (c)
Mann-Whitney test
other p-values for differences between SVCS<3 and SVCS>3 were obtained by were obtained by Student’s t-test.
https://doi.org/10.1371/journal.pone.0179868.t001
Table 2. Univariable analysis: Association between bone parameters and SVCS.
Variables All patients (n = 50) SVCS<3
(n = 30; 60%)
SVCS3 (n = 20; 40%)
p value
Bone Volume/Tissue Volume (%) 24.27±8.64 24.92±5.78 23.31±11.83 0.100
Mineralized Bone Volume/Tissue Volume (%) 21.95±7.12 23.56±5.49 19.55±8.63 0.029
Osteoid Volume/Bone Volume (%) 11.09±8.17 12.07±7.82 9.63±8.66 0.437
Osteoid Thickness (μm) 11.42±3.97 11.42±3.11 11.43±5.10 0.989
Mineralization lag time (days) 49.65±42.86 54.36±43.24 42.60±42.40 0.339
Bone formation rate/Bone Surface (mm3/cm2/year) 2.40 (1.65;4.81) 2.59 (1.72;4.82) 2.17(1.49; 4.77) 0.591(a) Activation frequency (/year) 0.47 (0.27;0.95) 0.27 (.48;.94) 0.47 (0.26; 0.99) 0.968(a)
Low bone turnover n (%) 27 (54%) 15 (50%) 12 (60%) 0.481(b)
High bone turnover n (%) 19 (38%) 12 (40%) 7 (35%) 0.721(b)
Continuous data are summarized as mean±standard deviation or median (25thpercentile; 75thpercentile) (a)Mann-Whitney test
(b)Pearson Chi-Square test
other p-values for differences between SVCS<3 and SVCS>3 were obtained by Student’s t-test.
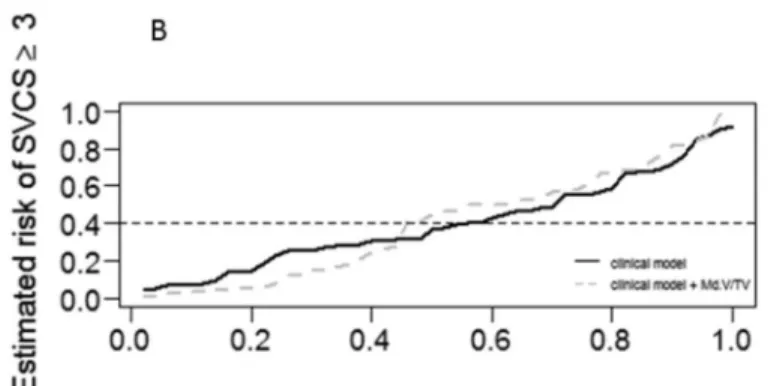
The performance measures of the multivariable regression logistic models are presented in sup-plemental Table A (S1A Table). When comparing model 1 and models 2 to 4, using the predic-tiveness curves, model 3 (model 1 + mineralized bone volume) presented a better performance
(Fig 3)
Agreement between SVCS and Agatston score
The study of agreement between SVCS and Agatston score resulted in a Spearman’ s correla-tion coefficient estimate of 0.71 (95%CI: 0.51, 0.86).
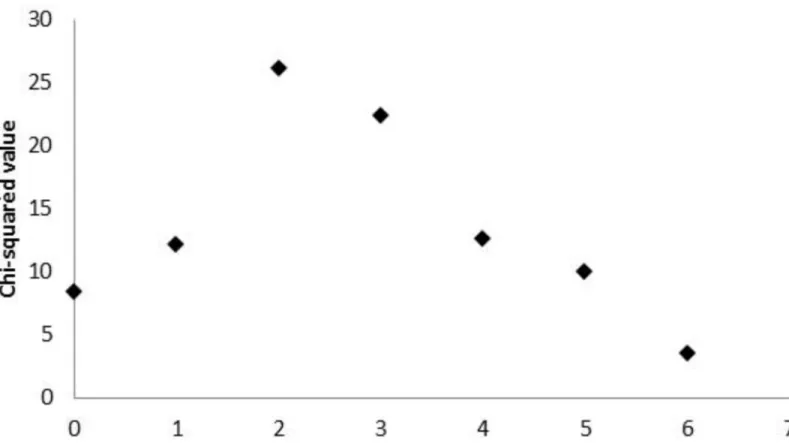
A complementary study of agreement was additionally performed after dichotomizing both variables. Regarding Agatston score, the cut-point 400 was considered (40), and results of the minimum p-value approach (Fig 3) identified a SVCS greater than 2 as the best cut-point, enabling the discretization of this variable as SVCS<3 and SVCS3 (Fig 4). This result is in accordance with the cut-point previously obtained for higher cardiovascular mortality risk (3,18).
In the group of patients with SVCS3 (Table 1), 12 of 15 patients (80%) had an Agatston score>400 (p<0.001), and a Cohen’s kappa of 0.79 (95%CI: 0.59, 0.99) was found, indicating a substantial agreement between the two binary SVCS and Agatston scores (38,39). Addition-ally, a sensitivity of 0.92 (95%CI: 0.64, 1.00), a specificity of 0.90 (95%CI: 0.73, 0.98), a positive predictive value of 0.80 (95%CI: 0.55, 0.99), and a negative predictive value of 0.96 (95%CI: 0.79, 0.99), were obtained. The AUC achieved by this binary SVCS score regarding the dis-crimination of the patients with Agatston score>400 was 0.92 (95%CI: 0.80, 1.00), indicating an appropriate discrimination ability.
Discussion
In 2006, KDIGO included vascular calcifications in the diagnosis of chronic kidney disease mineral and bone disorder (CKD-MBD) [11]. The evaluation of the relationship between bone Table 3. Multivariable logistic regression models.Binary dependent variable: (SVCS<3, SVCS3).
Model 1
OR 95% CI p value
age 1.066 1.013–1.126 0.015
HD duration* 1.131 1.023–1.250 0.017
Model 2 = Model 1 + Bone Volume
age 1.065 1.011–1.121 0.018
HD duration* 1.142 1.028–1.268 0.013
Bone Volume 0.965 0.888–1.049 0.404
Model 3 = Model 1 + Mineralized Bone Volume
age 1.068 1.006–1.133 0.030
HD duration* 1.214 1.060–1.390 0.005
Mineralized Bone volume 0.863 0.766–0.971 0.015
Model 4 = Model 1 + Osteoid Volume
age 1.064 1.010–1.121 0.020
HD duration* 1.142 1.031–1.265 0.011
Osteoid Volume 0.952 0.878–1.033 0.236
OR, odds ratio estimate; HD, hemodialysis; Bone Volume consists of Mineralized Bone Volume and Osteoid Volume. The different models apply to the same population (n = 50).
*Increased odds of SVCS3 for each six-month increase in HD duration.
histomorphometric abnormalities and vascular calcifications was one of the suggested KDIGO questions for clinical research.
We demonstrate in this study an association between higher mineralized bone volume with a lower vascular calcification score evaluated by plain X-ray. [3].
Bone is the main reservoir of calcium and phosphate in the organism and acts as a mineral pool for calcium homeostasis [42]. Bone volume is composed of mineralized bone and non-mineralized osteoid bone. Hydroxyapatite, a crystalline complex of calcium and phosphate, constitutes 70% of mineralized bone [42]. The maintenance of the body’s steady state of cal-cium and phosphorus is the result of the concerted action of intestinal, renal and skeletal regu-latory mechanisms under tight hormonal control [43]. In dialysis patients, according to the Braun model [44], bone has a decreased capacity to buffer high blood levels of calcium and phosphate and, in association with oligo / anuria with reduced calciuria and phosphaturia, the only escape is the development of vascular calcifications.
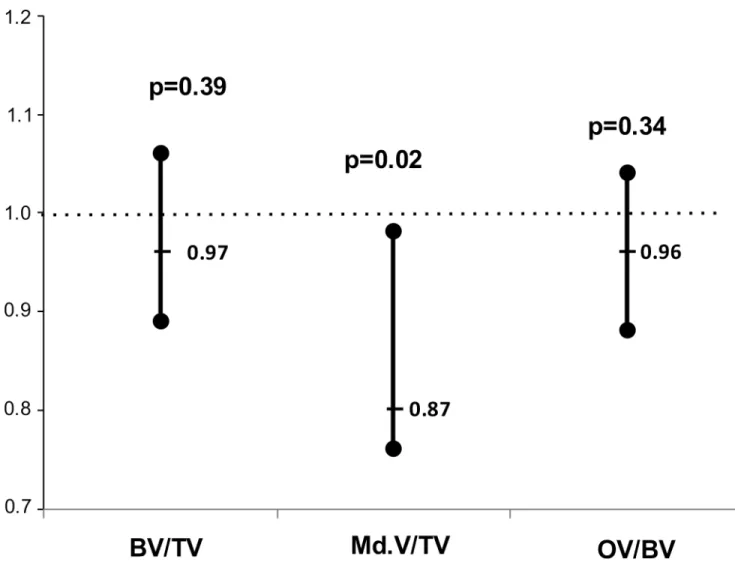
In dialysis patients several studies have shown an association between bone disease and vas-cular calcifications. Low bone turnover [12,14], changes in bone remodelling [13], low bone volume [15] have been associated with vascular calcifications diagnosed by ultrasonography or Fig 2. Bone volume and SVCS3.Estimated odds ratios of the association of Bone Volume, Mineralized Bone Volume and Osteoid Volume with SVCS3 adjusted for age, hemodialysis duration and gender with corresponding confidence intervals and p-values.
multislice computed tomography. Bone fractures have been associated with vascular calcifica-tions evaluated by plain X-ray [17]. Adynamic bone disease has been associated with progres-sion of coronary calcifications [13]. Lower bone mineral density has been associated with arterial stiffness [45,46], and with progression of coronary calcifications [16].
The high prevalence of both low bone volume and low bone turnover has been demon-strated in a study evaluating 630 bone biopsies from dialysis patients [16]. Low bone formation is the mechanism that links low bone volume to low bone turnover [16]. Our finding of the association of higher mineralized bone volume with a lower vascular calcifications score is also in agreement with previous findings of the association of low bone turnover with higher vascu-lar calcifications scores [12–14]. We expand this observation by identifying mineralized bone as the major factor of association.
We have previously demonstrated an association between low bone volume with coronary calcifications [15]. In the present study we have verified an association between the simple vascular calcification score evaluated in plain X-ray [3] with mineralized bone volume. Our results highlight the association of mineralized bone volume with vascular calcifications, call-ing attention for the role of mineralized bone as reservoir of calcium and phosphate and its possible contribution for the burden of vascular calcifications in dialysis patients.
Computed tomography is the most sensitive method to evaluate the prevalence and pro-gression of vascular calcifications but, due to the higher cost and the higher radiation dose it is not suitable to be used in the daily clinical routine.
Fig 3. Predictiveness curves.Predictiveness curves corresponding to the clinical model and to the extended model with:A- BV/TV;B- Md.BV/TV;C- OV/ BV. The dashed grey line below and above the continuous black line (for lower and higher estimated risks, respectively) shows a best performance only for the model 3, where Md.BV/TV was added to the clinical model.
The SVCS is inexpensive, very easy to interpret by the Nephrologist, widely available, and uses a very low radiation dose. In CKD patients, this score has been associated with all-cause and cardiovascular mortality [3,18–20], with arterial stiffness [18,46], with low or high ankle brachial-index [47] and with low bone mineral density [46]. In a large cohort of CKD patients not on dialysis, this SVCS, but not the Kauppila score, was associated with all-cause and car-diovascular mortality [20]. We have also verified in the present study that there is a substantial agreement between an Agatston score>400 and a SVCS3.
The main limitation of this study is its observational nature that allows only to show associ-ations and no cause and effect relassoci-ationship. The low number of diabetic patients in this study did not allow to address diabetes as a risk factor. The strength of this study lies in the availabil-ity of bone biopsies for direct tissue analysis.
In summary, our analysis shows an association of higher mineralized bone volume evalu-ated in bone biopsies, with a lower vascular calcification score assessed by plain X-ray. The decreased risk of the association of higher mineralized bone volume with a lower vascular calcification score suggests that there might be a role for bone in the reduction of the high cardiovascular risk in hemodialysis patients. This study reinforces the utility of this simple plain x-ray method to evaluate vascular calcifications for dialysis patients and supports the hypothesis of the existence of a link between bone mineralization and vascular calcification. If this hypothesis is correct, it is possible that a therapeutic intervention in bone disease could have an impact on patient cardiovascular outcomes beyond the beneficial effect on bone.
Fig 4. Cut-point for SVCS.Chi-square values measuring the association between binary Agatston score and dichotomized SVCS (at potential cut-points). The maximum chi-squared value occurs at SVCS = 2, enabling the dichotomization of this variable as SVCS<3 and3.
Supporting information
S1 Table. Performance of the multivariable regression logistic models. (DOCX)
Author Contributions
Conceptualization:Teresa Adragao, Anibal Ferreira, Joao M. Frazao, Ana Luisa Papoila, Iola Pinto, Marie-Claude Monier-Faugere, Hartmut H. Malluche.
Data curation:Teresa Adragao, Ana Luisa Papoila, Iola Pinto.
Formal analysis:Teresa Adragao, Ana Luisa Papoila, Iola Pinto.
Funding acquisition:Teresa Adragao.
Investigation:Teresa Adragao, Joao M. Frazao, Marie-Claude Monier-Faugere, Hartmut H. Malluche.
Methodology:Teresa Adragao, Ana Luisa Papoila, Iola Pinto.
Project administration:Teresa Adragao, Anibal Ferreira, Joao M. Frazao.
Resources:Marie-Claude Monier-Faugere, Hartmut H. Malluche.
Software:Ana Luisa Papoila, Iola Pinto.
Visualization:Teresa Adragao, Ana Luisa Papoila, Iola Pinto.
Writing – original draft:Teresa Adragao.
Writing – review & editing:Teresa Adragao, Anibal Ferreira, Joao M. Frazao, Ana Luisa Papoila, Iola Pinto, Marie-Claude Monier-Faugere, Hartmut H. Malluche.
References
1. Blacher J, Guerin AP, Pannier B, Marchais SJ, London GM. Arterial calcifications, arterial stiffness, and cardiovascular risk in end-stage renal disease. Hypertension 2001; 38: 938–942. PMID:11641313
2. London GM, Gue´rin AP, Marchais SJ, Me´tivier F, Pannier B, Adda H. Arterial media calcification in end-stage renal disease: impact on all-cause and cardiovascular mortality. Nephrol Dial Transplant. 2003; 18(9): 1731–40. PMID:12937218
3. Adragao T, Pires A, Lucas C, Birne R, Magalhaes L, Gonc¸alves M et al. A simple vascular calcification score predicts cardiovascular risk in haemodialysis patients. Nephrol Dial Transplant. 2004; 19:1480– 1488.https://doi.org/10.1093/ndt/gfh217PMID:15034154
4. Block GA, Raggi P, Bellasi A, Kooienga L, Spiegel DM. Mortality effect of coronary calcification and phosphate binder choice in incident hemodialysis patients. Kidney Int 2007; 71(5): 438–41.https://doi. org/10.1038/sj.ki.5002059PMID:17200680
5. Giachelli CM: Vascular calcification mechanisms. J Am Soc Nephrol 2004; 15 (12):2959–64.https:// doi.org/10.1097/01.ASN.0000145894.57533.C4PMID:15579497
6. Moe SM, O’Neill KD, Duan D, Ahmed S, Chen NX, Leapman SBet al. Medial artery calcification in ESRD patients is associated with deposition of bone matrix proteins. Kidney Int 2002; 61 (2): 638–47. https://doi.org/10.1046/j.1523-1755.2002.00170.xPMID:11849407
7. Shanahan CM, Cary NR, Salisbury JR, Proudfoot D, Weissberg PL, Edmonds ME. Medial localization of mineralization-regulating proteins in association with Monckeberg’s sclerosis: evidence for smooth muscle cell-mediated vascular calcification. Circulation 1999; 100 (21):2168–76. PMID:10571976
8. Ketteler M, Vermeer C, Wanner C, Westenfeld R, Jahnen-Dechent W, Floege J. Novel insights into ure-mic vascular calcification: role of matrix Gla protein and alpha-2-Heremans Schmid glycoprotein/fetuin. Blood Purif 2002; 20 (5):473–476. PMID:12207096
mouse model of uraemia. Nephrol Dial Transplant. 2011; 26(10):3349–57.https://doi.org/10.1093/ndt/ gfr039PMID:21398365
10. O’Neill WC, Lomashvili KA, Malluche HH, Faugere MC, Riser BL. Treatment with pyrophosphate inhib-its uremic vascular calcification. Kidney Int. 2011; 79(5): 512–517.https://doi.org/10.1038/ki.2010.461 PMID:21124302
11. Moe S, Dru¨eke T, Cunningham J, Goodman W, Martin K, Olgaard K et al. Definition, evaluation, and classification of renal osteodystrophy: a position statement from Kidney Disease: Improving Global Out-comes (KDIGO). Kidney Int 2006; 69 (11): 1945–53.https://doi.org/10.1038/sj.ki.5000414PMID: 16641930
12. London GM, Marty C, Marchais SJ, Guerin AP, Metivier F, de Vernejoul MC. Arterial calcifications and bone histomorphometry in end-stage renal disease. J Am Soc Nephrol 2004; 15 (7):1943–51. PMID: 15213285
13. Barreto DV, Barreto Fde C, Carvalho AB, Cuppari L, Draibe SA, Dalboni MA et al. Association of changes in bone remodeling and coronary calcification in hemodialysis patients: a prospective study. Am J Kidney Dis 2008; 52(6): 1139–50.https://doi.org/10.1053/j.ajkd.2008.06.024PMID:18824289
14. London GM, Marchais SJ, Gue´rin AP, Boutouyrie P, Me´tivier F, de Vernejoul MC. Association of bone activity, calcium load, aortic stiffness, and calcifications in ESRD. J Am Soc Nephrol. 2008; 19(9):1827– 35.https://doi.org/10.1681/ASN.2007050622PMID:18480316
15. Adragao T, Herberth J, Monier-Faugere MC, Branscum AJ, Ferreira A, Frazao JM et al. Low Bone Vol-ume-A Risk Factor for Coronary Calcifications in Hemodialysis Patients. Clin J Am Soc Nephrol 2009; 4(2):450–5.https://doi.org/10.2215/CJN.01870408PMID:19158372
16. Malluche HH, Blomquist G, Monier-Faugere MC, Cantor TL, Davenport DL. High Parathyroid Hormone Level and Osteoporosis Predict Progression of Coronary Artery Calcification in Patients on Dialysis. J Am Soc Nephrol 2015; 26(10):2534–44.https://doi.org/10.1681/ASN.2014070686PMID:25838468
17. Rodrı´guez-Garcı´a M, Go´mez-Alonso C, Naves-Dı´az M, Diaz-Lopez JB, Diaz-Corte C, Cannata-Andı´a JB. Vascular calcifications, vertebral fractures and mortality in haemodialysis patients. Nephrol Dial Transplant 2009; 24(1): 239–46.https://doi.org/10.1093/ndt/gfn466PMID:18725376
18. Adragão T, Pires A, Birne R, Curto JD, Lucas C, Gonc¸alves M et al. A plain X-ray vascular calcification score is associated with arterial stiffness and mortality in dialysis patients. Nephrol Dial Transplant 2009; 3:997–1002.
19. Schlieper G, Brandenburg V, Djuric Z, Damjanovic T, Markovic N, Schurgers L et al. Risk factors for car-diovascular calcifications in non-diabetic Caucasian haemodialysis patients. Kidney Blood Press Res 2009; 32(3): 161–8.https://doi.org/10.1159/000221064PMID:19468238
20. Go´rriz JL, Molina P, Cervero´n MJ, Vila R, Bover J, Nieto Jet al. Vascular calcification in patients with nondialysis CKD over 3 years. Clin J Am Soc Nephrol 2015; 10(4):654–66.https://doi.org/10.2215/ CJN.07450714PMID:25770175
21. Ferreira A, Frazão JM, Monier-Faugere MC, Gil C, Galvao J, Oliveira C et al. Sevelamer Study Group. Effects of sevelamer hydrochloride and calcium carbonate on renal osteodystrophy in hemodialysis patients. J Am Soc Nephrol 2008; 19(2):405–12.https://doi.org/10.1681/ASN.2006101089PMID: 18199805
22. Malluche HH, Faugere MC: Atlas of Mineralized Bone Histology. New York, Karger, 1986.
23. Goldner J: A modification of the Masson trichrome technique for routine laboratory purposes. Am J Pathol 1938; 14:237–243. PMID:19970387
24. Lillie PD, Fullmer HM: Histopathologic Technique and Practical Histochemistry., 4 ed. New York, McGraw Hill, 1976.
25. Denton J, Freemont AJ, Ball J: Detection of distribution of aluminum in bone. J Clin Pathol 1984; 37:136–142. PMID:6198339
26. Malluche HH, Sherman D, Meyer W, Massry SG: A new semiautomatic method for quantitative static and dynamic bone histology. Calcif Tissue Int 1982; 34:439–448. PMID:6817891
27. Manaka RC & Malluche HH: A program package for quantitative analysis of histologic structure and remodeling dynamics of bone. Comput Programs Biomed 1981; 13:191–202. PMID:7032836
28. Dempster DW, Compston JE, Drezner MK, Glorieux FH, Kanis JA, Malluche H et al. Standardized nomenclature, symbols, and units for bone histomorphometry: a 2012 update of the report of the ASBMR Histomorphometry Nomenclature Committee. J Bone Miner Res 2013; 28(1):2–17.https://doi. org/10.1002/jbmr.1805PMID:23197339
30. Adragao T, Herberth J, Monier-Faugere MC, Branscum AJ, Ferreira A, Frazao JM, Malluche HH. Femo-ral bone mineFemo-ral density reflects histologically determined cortical bone volume in hemodialysis patients. Osteoporos Int. 2010; 21(4):619–25.https://doi.org/10.1007/s00198-009-0988-9PMID: 19554246
31. Asci G, Ok E, Savas R, Ozkahya M, Duman S, Toz H, Kayikcioglu M et al. The link between bone and coronary calcifications in CKD-5 patients on hemodialysis. Nephrol Dial Transplant. 2011; 26(3):1010– 15.https://doi.org/10.1093/ndt/gfq491PMID:20709740
32. Cejka D, Herberth J, Branscum AJ, Fardo DW, Monier-Faugere MC, Diarra D et al. Sclerostin and Dick-kopf-1 in renal osteodystrophy. Clin J Am Soc Nephrol. 2011; 6(4):877–82.https://doi.org/10.2215/ CJN.06550810PMID:21164019
33. Sprague SM, Bellorin-Font E, Jorgetti V, Carvalho AB, Malluche HH, Ferreira A et al. Diagnostic Accu-racy of Bone Turnover Markers and Bone Histology in Patients With CKD Treated by Dialysis. Am J Kid-ney Dis. 2016; 67(4):559–66.https://doi.org/10.1053/j.ajkd.2015.06.023PMID:26321176
34. Ok E, Asci G, Bayraktaroglu S, Toz H, Ozkahya M, Yilmaz M et al. Reduction of Dialysate Calcium Level Reduces Progression of Coronary Artery Calcification and Improves Low Bone Turnover in Patients on Hemodialysis. J Am Soc Nephrol. 2016; 27(8):2475–86.https://doi.org/10.1681/ASN. 2015030268PMID:26701977
35. Pencina MJ, D’Agostino RB Sr, Steyerberg EW. Extensions of net reclassification improvement calcula-tions to measure usefulness of new biomarkers. Stat Med 2011; 30 (1): 11–21.https://doi.org/10.1002/ sim.4085PMID:21204120
36. Pencina MJ, D’Agostino RB Sr, D’Agostino RB Jr, Vasan RS. Evaluating the added predictive ability of a new marker: from area under the ROC curve to reclassification and beyond. Stat Med 2008; 27 (2):157–72.https://doi.org/10.1002/sim.2929PMID:17569110
37. Huang Y, Sullivan Pepe M, Feng Z. Evaluating the predictiveness Evaluating the predictiveness of a continuous marker. Biometrics 2007; 63(4):1181–8.https://doi.org/10.1111/j.1541-0420.2007.00814.x PMID:17489968
38. Cohen J. A coefficient of agreement for nominal scales. Educ Pshycol Meas 1960; 20(1): 20(1): 37–46.
39. Viera AJ, Garrett JM. Understanding interobserver agreement; the Kappa statistic. Farm Med 2005; 37 (5): 360–3.
40. Greenland P, Bonow RO, Brundage BH, Budoff MJ, Eisenberg MJ, Grundy SM et al. CCF/AHA 2007 clinical expert consensus document on coronary artery calcium scoring by computed tomography in global cardiovascular risk assessment and in evaluation of patients with chest pain: a report of the American College of Cardiology Foundation Clinical Expert Consensus Task Force. Circulation 2007; 115(3): 402–26https://doi.org/10.1161/CIRCULATIONAHA..107.181425PMID:17220398
41. Mazumdar M, Glassman JR. Categorizing a prognostic variable: review of methods, code for easy implementation and applications to decision-making about cancer treatments. Statistics in Medicine 2000; 19(1):113–132. PMID:10623917
42. Wang L, Nancollas GH, Henneman ZJ. Nanosized particles in bone and dissolution insensitivity of bone mineral. Biointerphases 2006; 1: 106–111.https://doi.org/10.1116/1.2354575PMID:20408623
43. Renkema KY, Alexander RT, Bindels RJ, Hoenderop JG. Calcium and phosphate homeostasis: con-certed interplay of new regulators. Ann Med 2008; 40(2):82–91.https://doi.org/10.1080/
07853890701689645PMID:18293139
44. Braun J. Extraosseous calcification in patients with chronic renal failure—no escape? Nephrol Dial Transplant 2005; 20(10):2054–9.https://doi.org/10.1093/ndt/gfi030PMID:16077145
45. Raggi P, Bellasi A, Ferramosca E, Block GA, Muntner P. Pulse wave velocity is inversely related to ver-tebral bone density in hemodialysis patients. Hypertension 2007; 49:1278–84.https://doi.org/10.1161/ HYPERTENSIONAHA.107.086942PMID:17420331
46. Adragao T, Branco P, Birne R, Curto JD, de Almeida E, Prata MM et al. Bone mineral density, vascular calcifications, and arterial stiffness in peritoneal dialysis patients. Perit Dial Int 2008; 28(6):668–72. PMID:18981400