ACPD
9, 7239–7271, 2009Tropospheric water vapour above Switzerland over the
last 12 years
J. Morland et al.
Title Page
Abstract Introduction
Conclusions References
Tables Figures
◭ ◮
◭ ◮
Back Close
Full Screen / Esc
Printer-friendly Version
Interactive Discussion
Atmos. Chem. Phys. Discuss., 9, 7239–7271, 2009 www.atmos-chem-phys-discuss.net/9/7239/2009/ © Author(s) 2009. This work is distributed under the Creative Commons Attribution 3.0 License.
Atmospheric Chemistry and Physics Discussions
This discussion paper is/has been under review for the journalAtmospheric Chemistry and Physics (ACP). Please refer to the corresponding final paper inACPif available.
Tropospheric water vapour above
Switzerland over the last 12 years
J. Morland1, M. Collaud Coen2, K. Hocke1,3, P. Jeannet2, and C. M ¨atzler1,3
1
Institute of Applied Physics, University of Bern, Sidlerstrasse 5, 3012 Bern, Switzerland
2
M ´et ´eoSuisse, Station a ´erologique, 1530 Payerne, Switzerland
3
Oeschger Centre for Climate Change Research, University of Bern, Sidlerstrasse 5, 3012 Bern, Switzerland
Received: 8 December 2008 – Accepted: 23 February 2009 – Published: 18 March 2009 Correspondence to: C. M ¨atzler ([email protected])
ACPD
9, 7239–7271, 2009Tropospheric water vapour above Switzerland over the
last 12 years
J. Morland et al.
Title Page
Abstract Introduction
Conclusions References
Tables Figures
◭ ◮
◭ ◮
Back Close
Full Screen / Esc
Printer-friendly Version
Interactive Discussion Abstract
Integrated Water vapour (IWV) has been measured since 1994 by the TROWARA mi-crowave radiometer in Bern, Switzerland. Homogenization techniques were used to identify and correct step changes in IWV related to instrument problems. IWV from radiosonde, GPS and SPM was used in the homogenisation process as well as the
5
IWV differences calculated between mountain and valley weather stations. The aver-age IWV of the homogenised TROWARA time series was 14.4 mm over the 1996–2007 period, with maximum and minimum monthly average values of 22.4 mm and 8 mm oc-curring in August and January, respectively. A weak diurnal cycle in TROWARA IWV was detected with an amplitude of 0.32 mm, a maximum at 21:00 UT and a minimum
10
at 11:00 UT. For 1996–2007, TROWARA trends were compared with those calculated from the Payerne radiosonde and the closest ECMWF grid point to Bern. The ra-diosonde midnight trend of+0.087 (standard error 0.046) mm/y was significant at the 90% level. The radiosonde trend for all measurement times, +0.098 (0.061) mm/y, and the TROWARA midday trends, 0.068 (0.043) mm/y, were significant at the 89%
15
level. Seasonal Mann Kendall analysis revealed a significant positive trend in July of+0.19 (0.14) to +0.34 (0.25) mm/y for all three datasets. In December, the Pay-erne radiosonde showed a non-significant negative trend of−0.12 (0.13) mm/y, whilst
ECMWF and TROWARA indicated a significant negative trend of −0.20 (0.14) and −0.36 (0.24) mm/y, respectively.
20
1 Introduction
Water vapour is the strongest natural greenhouse gas. Under the assumption of con-stant relative humidity, the Clausius Clapeyron equation predicts a water vapour in-crease of 6% per degree Kelvin inin-crease in atmospheric temperature. Model simu-lations have shown that the water vapour feedback effect amplifies the temperature
25
ACPD
9, 7239–7271, 2009Tropospheric water vapour above Switzerland over the
last 12 years
J. Morland et al.
Title Page
Abstract Introduction
Conclusions References
Tables Figures
◭ ◮
◭ ◮
Back Close
Full Screen / Esc
Printer-friendly Version
Interactive Discussion
Ross and Elliott (1996) analyzed surface to 500 mb Integrated Water vapour (IWV) calculated from North American radiosonde data. Significant increases of 0.3 to 0.7%/y were observed over a large part of North America for the 1975 to 1995 period. How-ever, a similar study carried out for the whole of the northern hemisphere for the 1973 to 1995 period (Ross and Elliott, 2001), showed that the radiosonde IWV trends for
5
Europe were smaller, often negative and not significant at the 95% level.
Nilsson and Elgered (2008) studied IWV data from 33 Swedish and Finnish Global Positioning System (GPS) stations from 1996–2006. Trends lay between−0.05 and +0.1 mm/y (−0.14 and+0.75%) with errors of around 0.04 mm/y. The IWV increase
was larger in summer than in winter, when negative trends were frequently observed.
10
Trenberth et al. (2005) examined the European Centre for Medium-Range Weather Forecasts (ECMWF) 40-year reanalysis (ERA-40) data for the 1988 to 2003 period and found no significant trends over Europe. However, a global average trend of+0.04 (±0.009) mm/y, equivalent to+0.13 (±0.03) %/y, was calculated for the same period
us-ing Special Sensor Microwave Imager (SSM/I) satellite observations over the oceans.
15
Ground based microwave radiometers make accurate measurements of water vapour at a high temporal resolution (one minute or less). They also offer an inde-pendent source of atmospheric information from both radiosonde and analysis data. However, there are few long term datasets. Water vapour observations from microwave radiometers and other instruments have been collected by the US Atmospheric
Radi-20
ation Program (ARM) since the mid 1990s (Revercomb et al., 2003). A radiometer based in Onsala, Sweden has been operating on a campaign basis since 1980 and on a continual basis since 1993. By combining the radiometer data with other datasets, Haas et al. (2003) estimated an IWV trend of+0.17±0.01 mm/y from 1980 to 2002.
This paper presents IWV measured by the TROWARA (TROpospheric WAter
RA-25
ACPD
9, 7239–7271, 2009Tropospheric water vapour above Switzerland over the
last 12 years
J. Morland et al.
Title Page
Abstract Introduction
Conclusions References
Tables Figures
◭ ◮
◭ ◮
Back Close
Full Screen / Esc
Printer-friendly Version
Interactive Discussion
Sect. 5, IWV trends calculated from the homogenized TROWARA dataset are com-pared with those obtained from radiosonde and ECMWF data.
2 Data sources
2.1 TROWARA
The TROWARA instrument measures water vapour at a 2 s time resolution using
ob-5
servations at 21.3 GHz, near a water vapour absorption line, and at 31.5 GHz, in the water vapour continuum. The use of the second frequency helps to determine the amount of cloud liquid water present. Hourly average measurements were used in the present analysis. The original instrument was described by Peter and K ¨ampfer (1992) and details of the IWV retrieval are given in Ingold and M ¨atzler (2000). The instrument
10
operated outdoors from 1994 to April 2002. In November 2002, an improved radiome-ter model was introduced (Morland, 2002) and TROWARA was re-installed in an indoor laboratory with a microwave transparent window. This move reduced the diurnal cy-cle in the internal air temperature by around 80% and also meant that the instrument was completely sheltered from rain (Morland, 2007). Measurements of IWV are now
15
possible during light rain conditions of up to 2.4 mm h−1. However, in order to main-tain consistency with the old measurements, all observations made during rain were excluded from the present analysis.
2.2 Radiosonde
The Swiss RadioSonde (SRS400) at Payerne (490 m a.s.l. and 40 km southwest of
20
ACPD
9, 7239–7271, 2009Tropospheric water vapour above Switzerland over the
last 12 years
J. Morland et al.
Title Page
Abstract Introduction
Conclusions References
Tables Figures
◭ ◮
◭ ◮
Back Close
Full Screen / Esc
Printer-friendly Version
Interactive Discussion
troposphere (Miloshevich et al., 2006 and references therein). An overestimation of water vapour can occur above low level stratus in the winter (Guerova et al., 2003).
A homogeneity test indicated a major break point in the midday to midnight IWV in 1995. Minor or secondary break points remain in the time series due to small changes in the treatment of the solar radiation error and differences between batches of
hygris-5
tors delivered by the manufacturer. To avoid the major breakpoint, the present trend analysis is restricted to 1996–2007. However, the TROWARA homogenization is car-ried out for 1994–2007.
2.3 Sun photometer
A sun photometer (SPM) has been operated at Bern since 1993. It tracks the sun and
10
measures direct sunlight along the view direction in 18 different channels including one centred on the 946 nm water vapour absorption line. The water vapour transmittance can be determined after first accounting for aerosol effects. The transmittance is then converted into IWV using a method based on radiative transfer modelling (Ingold et al., 2000). For this study, hourly average data were used. The SPM is an accurate
15
method but sampling is limited to daytime and clear skies. This introduces a negative fair weather bias in the IWV data, since cloudy conditions are often associated with higher IWV values.
2.4 GPS
Zenith Total Delay (ZTD) data for the fixed GPS receiver at Bern were obtained from
20
Swisstopo for the period from November 2000. The IWV calculation followed the method described in Bevis et al. (1992). The Zenith Hydrostatic Delay (ZHD) due to dry gases in the atmosphere was estimated from pressure measurements. The Zenith Wet Delay, which is the delay due to water vapour, was calculated as ZWD=ZTD−ZHD.
The ZWD can be converted to IWV using a relationship which uses the water vapour
25
sur-ACPD
9, 7239–7271, 2009Tropospheric water vapour above Switzerland over the
last 12 years
J. Morland et al.
Title Page
Abstract Introduction
Conclusions References
Tables Figures
◭ ◮
◭ ◮
Back Close
Full Screen / Esc
Printer-friendly Version
Interactive Discussion
face temperature measurements.
2.5 ECMWF
Profiles at 0:00, 6:00, 12:00 and 18:00 UT were extracted from the ECMWF operational analysis for the grid point closest to Bern (7.87◦E, 47.25◦N) for 1996–2007. IWV was calculated by integrating the data from 850 to 200 mb. The 850 mb level was chosen
5
as a starting point because it is the lowest level for which no data gaps occur. This pressure is lower than the average annual pressure at Bern of 952 mb because the presence of nearby mountains increases the model topography.
3 Homogenisation of TROWARA data
Ingold and M ¨atzler (2000) noted a mean IWV bias of +2.1 mm in TROWARA data
10
relative to the Payerne radiosonde from 1995–1998. This was resolved in the year 2000 when an amplifier in the radiometer was replaced. A problem with the 31 GHz hot load voltage measurement (see Sect. 3.2) occurred when the instrument was moved to the Netherlands for a field campaign in July 2001. This was recognized and the problem was solved on 4 February 2002.
15
The effect of these instrument problems on the measurements is illustrated in Fig. 1 which shows the mean bias in TROWARA relative to Payerne radiosonde, SPM and GPS averaged over five different periods. Matching hourly average values were used to calculate the bias between TROWARA and other instruments. From 4 February 2002 onwards (P4), the bias between TROWARA and other instruments is within±0.7 mm, 20
which is acceptable given the fact that the accuracy of the GPS is around 0.7 mm (Hagemann et al., 2003). The SPM tends to have a fair-weather negative bias, leading to a positive bias of 0.4 mm in TROWARA relative to SPM, because of cases where clouds prevented the SPM from observing during the whole of the hourly averaging period.
ACPD
9, 7239–7271, 2009Tropospheric water vapour above Switzerland over the
last 12 years
J. Morland et al.
Title Page
Abstract Introduction
Conclusions References
Tables Figures
◭ ◮
◭ ◮
Back Close
Full Screen / Esc
Printer-friendly Version
Interactive Discussion
The first instrument problem is evident in P1B (April 1995 to August 2000) when TROWARA data had a bias of 1.9 and 3.0 mm, relative to SPM and radiosonde, re-spectively. After the amplifier replacement, the instrument seemed to function well for a brief period P2 (March to July 2001) when the bias lay between 0.2 and 0.8 mm. Measurements in Bern were interrupted by a field campaign and when the instrument
5
returned in October 2001, the hot load voltage was frequently saturated. Despite re-moving all data for which the hot load voltage had actually reached 5 V (saturation), an average TROWARA bias of−0.6 to−1.6 mm occurred in period P3 (October 2001 to 4
February 2002). This can be explained by the fact that the voltage cannot be accurately measured close to detector saturation, and is frequently under-estimated.
10
It is clear from Fig. 1 that the effects of a strong positive bias early in the series, fol-lowed by a negative bias in the middle will cause an error in any trend analysis applied to the original dataset. Given the scarcity of independent IWV observations stretching back more than ten years, it is worthwhile using homogenisation techniques to correct the TROWARA data. These are statistical techniques which were developed to deal
15
with inhomogeneities in other climate data, principally precipitation and temperature observations. Abrupt changes in a time series of meteorological observations can be caused by either instrument problems or the removal of the weather station to a dif-ferent site. Homogenisation techniques were developed to avoid losing large amounts of data which are potentially valuable for climatic analysis. In general, the instrument
20
time series is compared to one or more reference series which should be in the same climatic region. If the reference series is well chosen, it should show the same climatic variations as the instrument series, and any differences will be due to artificial factors.
The Multiple Linear Regression (MLR) technique from Vincent (1998) and the Stan-dard Normalization Homogenization Technique (SNHT) from Alexandersson (1986)
25
Liebe-ACPD
9, 7239–7271, 2009Tropospheric water vapour above Switzerland over the
last 12 years
J. Morland et al.
Title Page
Abstract Introduction
Conclusions References
Tables Figures
◭ ◮
◭ ◮
Back Close
Full Screen / Esc
Printer-friendly Version
Interactive Discussion
feld (556 m a.s.l.) and Bern Bantiger (942 m a.s.l.), and Neuch ˆatel (485 m a.s.l.) and Zimmerwald (907 m a.s.l.). The Zimmerwald station is maintained by the Astronomi-cal Institute at the University of Bern and the other data came from the MeteoSwiss networks. The yearly mean IWV values for these layers are 2.5 and 3.0 mm for Bern Liebefeld/Bern Bantiger and Neuch ˆatel/Zimmerwald, respectively, which is around 20%
5
of the TROWARA yearly mean IWV of 14.5 mm. The square,r2, of the correlation coef-ficient between TROWARA five day average IWV and that calculated between weather station pairs is 0.86, i.e. 86% of the TROWARA IWV variance can be explained by the weather station pairs. The r2 value for the correlation between TROWARA and radiosonde five-day average IWV is 0.89. Although the IWV calculated between the
10
weather stations covers only the lowest 50 mb or so of the atmosphere, the correlation between these data and TROWARA over a 5 day averaging period is not a great deal less than the correlation between TROWARA and radiosonde IWV.
Super-imposed on Fig. 1 are the magnitudes of the significant changepoints found by the MLR and SNHT techniques. When the whole series was examined, the SNHT
15
and MLR found significant negative changepoints in August 2000 and March 2001, respectively, which corresponded to the last measurements made before and the first measurements made after the replacement of the faulty amplifier. The series was then broken down into two sections before and after this break and retested.
When the first section was tested (January 1994 to August 2000), the SNHT and
20
MLR found changepoints in April 1994 and April 1995, respectively, which corre-sponded to the measurements directly before and directly after a break in observations which lasted almost a year. Unfortunately, it was not possible to determine what in-strument changes occurred in this period. However, it was assumed that they led to the amplifier problem which caused the positive bias during P1B. The first period of
25
measurements, from January to April 1994 will be referred to as P1A. During this time, TROWARA had a negative bias of up to−0.7 mm.
de-ACPD
9, 7239–7271, 2009Tropospheric water vapour above Switzerland over the
last 12 years
J. Morland et al.
Title Page
Abstract Introduction
Conclusions References
Tables Figures
◭ ◮
◭ ◮
Back Close
Full Screen / Esc
Printer-friendly Version
Interactive Discussion
tected a changepoint in June 2001, and the MLR estimated the time of the change more correctly to be October 2001, which was the time when TROWARA resumed measurements in Bern after the field campaign. The data from October 2001 to De-cember 2007 were tested with both techniques. The SNHT failed to detect the expected positive changepoint at the end of the period affected by saturated hot load voltages.
5
This was probably because the 31 GHz atmospheric temperature was lower and close to the cold load brightness temperature, which would lead to little change in the IWV (see Sect. 3.2). However, the MLR did detect a significant positive change at the end of January 2001 of magnitude+0.6 mm.
3.1 Correction of amplifier problem
10
Unfortunately the only information we have about TROWARA in the early years is that the original amplifier at 21 GHz was replaced during a break in measurements which lasted from late August 2000 to March 2001. An earlier break in measurements oc-curred from May 1994 to April 1995, but there is no record of what work was carried out on the instrument. Whatever repairs or improvements occurred, they must have
15
affected the measurements, as indicated by Fig. 1 which shows a negative bias in TROWARA relative to other instruments in P1A and a positive bias in P1B.
The bias in TROWARA IWV relative to the sonde was plotted against TROWARA IWV for the time period P1B, and a negligible slope of 0.0017 mm mm−1was found. It was therefore concluded that a constant correction was appropriate. This correction
20
was calculated from the changes in bias relative to sun photometer and radiosonde at the end of P1B,∆bSPMend and∆bsondeend, as well as the MLR and SNHT
change-points at the end of P1B,∆MLRendand∆SNHTend. The change in bias and the
change-points at the start of P1B could not be used because they included the effect of the negative bias in P1A. The corrected IWV in P1B, IWVCORP1B, was calculated from the
25
original IWV measurements in P1B, IWVORIGP1B, as follows:
ACPD
9, 7239–7271, 2009Tropospheric water vapour above Switzerland over the
last 12 years
J. Morland et al.
Title Page
Abstract Introduction
Conclusions References
Tables Figures
◭ ◮
◭ ◮
Back Close
Full Screen / Esc
Printer-friendly Version
Interactive Discussion =IWVORIGP1B−2.2 mm (1)
The correction for P1A was calculated as the difference between the mean change at the start of P1B and the mean change at the end, as follows:
IWVCORP1A =IWVORIGP1A+0.25(∆bSPMstart+ ∆bsondestart+ ∆MLRstart+ ∆SNHTstart)
−0.25(∆bSPMend+ ∆bsondeend+ ∆MLRend+ ∆SNHTend)
5
=IWVORIGP1A+0.9 mm (2)
3.2 Correction of saturated hot-load problem
An underestimate of IWV is what would be expected from the saturated hot load voltage problem. In order to calibrate the measurements, TROWARA measures a hot and cold load calibration target after every sky measurement. Each calibration cycle lasts just
10
under two seconds. The antenna brightness temperature, BTant, can be calculated as
follows:
BTant=Thot+
Vant−Vhot
Vhot−Vcold
(Thot−Tcold) (3)
BTant is later corrected to the true sky brightness temperature using a tipping
cali-bration. Vant, Vhot and Vcold are the antenna, hot and cold load voltages, respectively,
15
and Thot and Tcold are the physical temperatures of the cold and hot loads. A partial
derivative with respect toVhotleads to:
∂BTant
∂Vhot
= Vcold−Vant
(Vhot−Vcold)2
(Thot−Tcold) (4)
IfVantis equal toVcoldthen a change inVhotwill have no effect on BTant, all other things
being equal. However, ifVantis greater thanVcold, as was often the case since a vacuum
20
cold load cooled to 24 K was used, then BTantwill increase as the voltage decreases.
ACPD
9, 7239–7271, 2009Tropospheric water vapour above Switzerland over the
last 12 years
J. Morland et al.
Title Page
Abstract Introduction
Conclusions References
Tables Figures
◭ ◮
◭ ◮
Back Close
Full Screen / Esc
Printer-friendly Version
Interactive Discussion
voltage is 5 V (maximum range) when it was in fact higher, then an artificial decrease inVhot is imposed which leads, under most sky conditions, to an artificial increase in
BTant. The IWV was calculated from the linearised brightness temperatures (Wu, 1979)
as follows:
IWV=−0.5059+0.4837·BTlin21−0.2151·BTlin31 (5)
5
where BTlin21and BTlin31are the calibrated 21 and 31 GHz linearised brightness
tem-peratures in Kelvin. The equation comes from calculating IWV and linearised bright-ness temperatures from Payerne radiosonde data and then regressing the IWV against the simulated brightness temperatures. Equation 5 indicates that an artificial increase in BT31 leads, under most atmospheric conditions, to an artificial decrease in IWV as
10
is confirmed in Fig. 1.
The above theoretical analysis shows that we can expect a negative bias in IWV due to the saturated hot load problem, except in very cold atmospheric conditions when a positive bias will occur. It also indicates that the bias will be dependent on the IWV amount. A plot of the TROWARA bias relative to radiosonde and GPS data against
15
IWV showed that the bias did indeed become increasingly negative with increasing IWV amount. From the best fit linear regression of TROWARA bias against IWV the following correction was estimated:
IWVCORP3 =−2.23+1.3967·IWVORIGP3 (6)
where IWVCORP3is the corrected TROWARA IWV in mm for period P3, and IWVORIGP3
20
is the original TROWARA observation in mm.
The corrections for P1A, P1B and P3 were applied to the TROWARA data. In order to confirm their validity, the homogenised dataset was compared with simultaneous sonde, SPM and GPS measurements for the period 1994–2007. The average bias in the corrected TROWARA data was+0.4, +0.3 and −0.6 mm for radiosonde, SPM
25
ACPD
9, 7239–7271, 2009Tropospheric water vapour above Switzerland over the
last 12 years
J. Morland et al.
Title Page
Abstract Introduction
Conclusions References
Tables Figures
◭ ◮
◭ ◮
Back Close
Full Screen / Esc
Printer-friendly Version
Interactive Discussion 4 Climatology
4.1 Monthly climatology
Figure 2 shows a comparison between the TROWARA 1996–2007 monthly climatology and that of the Payerne radiosonde integrated from the altitude of Bern. Also shown are IWV climatologies for the Bern GPS and SPM as well as for ECMWF data for
5
the closest gridpoint to Bern, integrated from 850–200 mb. The average IWV of the homogenised TROWARA time series was 14.4 mm over the 1996–2007 period. Maxi-mum and miniMaxi-mum monthly average values of 22.4 mm and 8 mm occurred in August and January, respectively.
TROWARA has a negative bias in every month relative to the co-located GPS
in-10
strument. This ranges from −0.6 mm (February) to −2.1 mm (July) and is on
aver-age−1.4 mm. This value is considerably larger than the bias of −0.6 mm reported in Sect. 3.2 for the comparison between TROWARA and GPS matching hourly averages, i.e. non-raining conditions. The differences are due to the fact that the GPS monthly mean includes periods when the GPS made observations and TROWARA did not.
15
This usually occurred during rainy periods since the TROWARA data shown here are restricted to rain-free conditions. The highest IWV values are likely to occur during rainy conditions when the atmosphere is close to saturation. This can be checked by examining the annual mean IWV for TROWARA data for 2003 to 2007. The value in non-raining conditions was 14.3 mm. However, when measurements made in light rain
20
conditions the annual mean was 14.6 mm, with differences of up to 1.2 mm occurring between the datasets for individual months. Therefore the additional bias of−0.8 mm
in the TROWARA monthly means relative to GPS may be due to the sampling dif-ferences between a dataset which excludes rainy conditions and one which includes measurements made even during heavy precipitation. The maximum precipitation in
25
Bern occurs in June and the minimum in March, which is close to the months (July and February) when the largest and smallest TROWARA bias relative to GPS occurs.
ACPD
9, 7239–7271, 2009Tropospheric water vapour above Switzerland over the
last 12 years
J. Morland et al.
Title Page
Abstract Introduction
Conclusions References
Tables Figures
◭ ◮
◭ ◮
Back Close
Full Screen / Esc
Printer-friendly Version
Interactive Discussion
and July, but otherwise has a negative bias ranging from−0.1 to−0.9 mm. The largest
negative biases occur in December and January which is not surprising given the fact that the radiosonde has a tendency to overestimate IWV over low stratus in the winter. The mean TROWARA bias relative to the radiosonde is −0.3 mm, whereas a slight
positive bias was seen in the matching hourly measurements in Sect. 3.2. The negative
5
TROWARA bias in the monthly means is probably related to the fact that these include rainy periods when the radiosonde makes a measurement and TROWARA does not.
TROWARA has a positive bias of between 1.8 (January) and 4.1 mm (June) relative to the co-located SPM. The monthly mean comparison gives quite different results from the comparison between matching hourly average TROWARA and SPM data
10
described in Sect. 3 where the TROWARA bias was just 0.3 mm. This is because the SPM operates only in sunny, daylight conditions and therefore grossly undersamples the number of potential weather situations in a given month. The percentage bias in TROWARA relative to SPM has an average value of 19%, and is lowest in September (12%) and highest in January (24%).
15
The sampling differences between the various measuring techniques can be better visualised with a histogram plot as shown in Fig. 3. The histograms are plotted as a percentage of the total number of measurements in each 1 mm bin in order to allow better comparison between different instrument types. For all instruments, IWV values between 1 to 2 mm have a frequency of less than 0.5%, but values of 4 to 5 mm occur
20
around 3 to 4% of the time. For the IWV range between 5 and 19 mm, all instruments show a frequency of between 4 and 6%, with TROWARA and radiosonde showing a peak frequency between 8 and 10 mm. The GPS distribution function tends to be more of a plateau shape, whilst the SPM shows double peaks at 5 and 16 mm. The SPM makes 71% of its measurements in the 5 to 19 mm range, as opposed to the
25
ACPD
9, 7239–7271, 2009Tropospheric water vapour above Switzerland over the
last 12 years
J. Morland et al.
Title Page
Abstract Introduction
Conclusions References
Tables Figures
◭ ◮
◭ ◮
Back Close
Full Screen / Esc
Printer-friendly Version
Interactive Discussion
time by the SPM due to the restriction that it measures only in fair weather conditions. TROWARA and radiosonde measure IWV values above 26 mm around 7% of the time. There is a large divergence in the maximum IWV with values of 32.2, 39.5, 43.5 and 43.8 mm being recorded by SPM, radiosonde, TROWARA and GPS, respectively.
TROWARA has a positive bias relative to the ECMWF data, but this is expected since
5
these data are integrated from an altitude of 850 mb, whereas the mean annual pres-sure in Bern is around 100 mb higher. The positive TROWARA bias varies between 2.5 and 8 mm depending on the time of year. However, it is always between 30 and 38% of the TROWARA IWV, with an average of 33%. Thus around one third of the atmo-spheric water vapour over Bern is to be found in the first 100 mb of pressure decrease.
10
From the comparison between reference series and TROWARA in Sect. 3, we know that 20% of the total IWV lies in the layer between Neuchatel (average annual pressure 961 mb) and Zimmerwald (average annual pressure 913 mb). Therefore about 20% of the IWV lies in the first 50 mb of pressure decrease.
4.2 Diurnal climatology
15
Because IWV has rapid time variations related to the synoptic weather situation, it is difficult to observe any diurnal cycle on a particular day. However, a diurnal cycle may be detectable over a longer period of time. In this section, emphasis will be given to comparing the diurnal cycle of the TROWARA and GPS IWV. For the calculation of IWV from GPS Zenith Wet Delay, an estimate of the water vapour weighted mean
20
atmospheric temperature,Tm, is required. The standard formula for estimatingTm from
surface air temperature was developed by Bevis et al. (1992), and takes no account of the fact that the surface temperature has a much higher diurnal cycle amplitude than temperatures higher in the atmosphere. Wang et al. (2005) usedTm estimated from
ERA-40 reanalysis data and from the National Centers for Environmental Prediction/
25
National Center for Atmospheric Research (NCEP/NCAR) global reanalysis products to evaluate the suitability of using surface air temperature, Ts, to estimate Tm. They
ACPD
9, 7239–7271, 2009Tropospheric water vapour above Switzerland over the
last 12 years
J. Morland et al.
Title Page
Abstract Introduction
Conclusions References
Tables Figures
◭ ◮
◭ ◮
Back Close
Full Screen / Esc
Printer-friendly Version
Interactive Discussion
early morning and a consequent dry bias in the GPS IWV during these times. In the case of Bern, the diurnal cycle ofTshas an amplitude of 3.5 K, whereas the amplitude
ofTmin central Europe calculated by Wang et al. (2005) from ERA-40 data lies between 0.5 and 1 K.
For comparison with TROWARA, GPS IWV was calculated from Ts using the ob-5
served diurnal cycle, a damped diurnal cycle and no diurnal cycle. The surface air temperature with a damped diurnal cycle,Tsdamped, was defined as follows:
Tsdamped =0.25Ts+0.75Ts (7)
where Ts is the daily mean surface air temperature. This formula gave an average
diurnal-cycle amplitude of 0.9 K for the years 2002 to 2007.
10
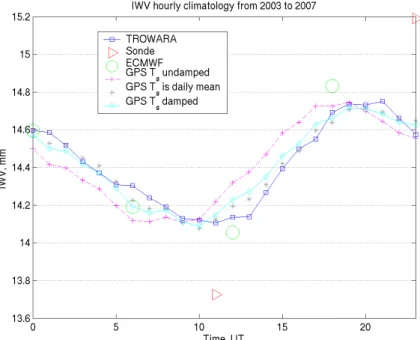
Figure 4 shows the average hourly IWV for the period 2003 to 2007. Only data acquired since 2003 were considered because before then TROWARA had stood out-doors, and the daytime heating and night-time cooling inside the radiometer may have had an influence on the diurnal cycle of IWV. Another reason is that the GPS is only available from 2001 onwards. Also shown is the ECMWF hourly average IWV for 0:00,
15
6:00, 12:00 and 24:00 UT, and the radiosonde average IWV for 00 and 12:00 UT. For easier comparison, the ECMWF, GPS and radiosonde data are plotted minus a con-stant daily average bias with respect to TROWARA data. This bias was−4.9, 1.3 and
0.3 mm for ECWMF, GPS and radiosonde, respectively.
The first point of interest is that although a diurnal cycle in IWV exists, it is very small
20
with an amplitude of around 2% annual IWV. The ECMWF data have a slightly larger diurnal amplitude than TROWARA (0.39 as opposed to 0.32 mm) and seem to be con-sistent as to the position of the minimum and maximum. TROWARA shows a minimum at 11:00 UT, with a broad dip between 9:00 and 12:00 UT, and peak values occurring between 19:00 and 21:00 UT. These are close to the ECMWF minimum and maximum
25
ACPD
9, 7239–7271, 2009Tropospheric water vapour above Switzerland over the
last 12 years
J. Morland et al.
Title Page
Abstract Introduction
Conclusions References
Tables Figures
◭ ◮
◭ ◮
Back Close
Full Screen / Esc
Printer-friendly Version
Interactive Discussion
atmospheric temperature over central Europe using both NCEP-NCAR and ECMWF ERA-40 reanalysis data.
The radiosonde data are only twice daily and therefore give no detailed picture of the diurnal cycle. The minimum of the radiosonde IWV occurs at 11:00 UT, in agree-ment with TROWARA. The radiosonde IWV has a diurnal cycle amplitude of 0.73 mm
5
which is about twice as large as that of TROWARA or ECMWF. Guerova et al. (2005) observed a stronger negative bias in Payerne radiosonde measurements relative to co-located GPS in the daytime than at night. Morland and M ¨atzler (2007) observed a stronger negative bias in Payerne radiosonde IWV relative to GPS in summer than in any other season. Both of these effects were attributed to an error caused by solar
10
radiation. The large IWV diurnal cycle observed in the radiosonde is possibly related to this error.
The GPS shows a diurnal cycle amplitude of 0.32 mm, in agreement with TROWARA. It also gives a detailed picture of the shape of the diurnal cycle, which clearly differs depending on how the surface air temperature is treated for the conversion between
15
Zenith Wet Delay and IWV. IfTs is used without any damping of the diurnal cycle, the GPS minimum and maximum occur around two hours earlier than TROWARA data. A negative bias in GPS (Ts undamped) IWV can be observed in Fig. 4 during the night and early morning (21:00 UT to 8:00 UT), in agreement with the findings of Wang et al. (2005). It is complimented by a positive bias in GPS (Ts undamped) IWV between 20
11:00 and 17:00 UT, which is almost certainly due to an unrealistically high estimate of
Tm from the undampedTs. Damping or removing the diurnal cycle ofTs shifts the GPS diurnal cycle to the right by one to two hours so that GPS values lie closer to TROWARA values. The absolute difference between the TROWARA and GPS diurnal cycle is 0.1 mm for the undampedTs, and this reduces to 0.03 and 0.04 mm, respectively, for
25
totally and partially damped diurnal cycles inTs.
ACPD
9, 7239–7271, 2009Tropospheric water vapour above Switzerland over the
last 12 years
J. Morland et al.
Title Page
Abstract Introduction
Conclusions References
Tables Figures
◭ ◮
◭ ◮
Back Close
Full Screen / Esc
Printer-friendly Version
Interactive Discussion
cycle of 2 years of radiometer data from Potsdam in Germany and also found a higher diurnal cycle amplitude in summer (around 1.5 mm) than in winter (around 0.5 mm). The summer values reported in these studies are substantially higher than the yearly values for Bern presented here, although the values for other seasons are more similar. The peak in the IWV diurnal cycle occurs about 6 h later than the maximum daily
5
temperature at Bern, which is reached at around 14:00 UT. The increase in IWV in the daytime must be related to daytime evaporation and the decrease at night to conden-sation of water vapour from the atmosphere. It would be interesting to check whether the amount of dew deposited on grass on a clear night corresponded to the amplitude of the diurnal cycle.
10
5 Trend analysis
A trend analysis was carried out on the homogenised TROWARA data using both least squares analysis (LSA) and the seasonal Mann Kendall (MK) technique (Hirsch and Slack, 1984). Both of these methods were applied by Collaud Coen et al. (2007) to 10.5 years of aerosol data from the high alpine site Jungfraujoch. In the following
15
discussion, trends are given in mm or %/y and the standard error is given afterwards in brackets.
5.1 Least squares analysis
For the LSA, the data were modeled with a constant term, a0, which is close to the
yearly mean, a seasonal term represented by a series of sine and cosine harmonics,
20
and a linear trend, represented byα0t:
IWV(t)=a0+
κ X
k=1
ACPD
9, 7239–7271, 2009Tropospheric water vapour above Switzerland over the
last 12 years
J. Morland et al.
Title Page
Abstract Introduction
Conclusions References
Tables Figures
◭ ◮
◭ ◮
Back Close
Full Screen / Esc
Printer-friendly Version
Interactive Discussion
For this analysis, three series of harmonics were used (κ=3), because this value of
κ gave the best statistical fit to the TROWARA data. The standard error was calcu-lated according to Weatherhead (2000) and includes a term for autocorrelation in the residuals. In order to avoid unrepresentative values due to the gaps in the TROWARA data, a monthly mean was only calculated if measurements were available on at least
5
8 distinct days.
The homogenized TROWARA dataset for the period since the start of TROWARA measurements (1994–2007) is presented together with the LSA trend estimate in Fig. 5. It shows that the TROWARA has measured continuously during the five years from 2003 to end 2007. There is also a fairly continuous period from 1996 through
10
to 1998. However, Fig. 5 also shows the gaps which occurred due to a field cam-paign (summer 2001), and repairs and upgrades made on the instrument (latter half of 1994, spring 1999 to spring 2000, latter half of 2002). The LSA trend estimate is 0.061 (0.048) mm/y. This represents an increase of around 4% per decade.
Figure 6 shows a comparison of the trend results in mm/y for the shorter period
15
1996–2007 which avoids the main radiosonde inhomogeneity. The LSA trends are cal-culated for all times, as well as midday or midnight measurements. The TROWARA data were averaged from 11:00 to 13:00 UT and 23:00 to 1:00 UT, respectively, in order to best match the radiosonde measurement times. The radiosonde profiles are inte-grated from the surface to 200 mb, RS (s-200), for comparison with TROWARA and
20
from 850 to 200 mb, RS (850–200), for comparison with ECMWF.
It is generally accepted that a trend is at least significant at the 90% and 95% levels if the trend divided by the standard error equals or exceeds 1.65 and 1.96, respectively. The significance indicates the confidence with which a change in the measurements can be distinguished from natural variability or measurement noise, but it does not give
25
ACPD
9, 7239–7271, 2009Tropospheric water vapour above Switzerland over the
last 12 years
J. Morland et al.
Title Page
Abstract Introduction
Conclusions References
Tables Figures
◭ ◮
◭ ◮
Back Close
Full Screen / Esc
Printer-friendly Version
Interactive Discussion
all observations are significant at the 89% level.
The ECMWF trends, although not significant, are somewhat lower than the ra-diosonde trends, but show the same behavior in that midnight trends are larger than midday trends. TROWARA, which contains more measurement times in the all day dataset, shows the opposite behavior. The difference is probably not caused by the
ra-5
diosonde solar radiation error, because changes in processing techniques would have tended to produce a slight increase in the radiosonde daytime trend and do not explain the large nighttime trend. On the other hand, the disagreement could be due to the fact that TROWARA was moved indoors in late 2002. This stabilised the internal air tem-perature. It could be that the large diurnal changes which occurred in the radiometer air
10
temperature when it was outdoors had a differing effect on midday and midnight data. If the period 2003 to 2008 is analysed, when the instrument was only operated indoors, then a nighttime trend of 0.10 (0.21) mm/y, and a daytime trend of 0.07 (0.19) mm/y is calculated, i.e. the TROWARA nighttime trend is larger than the daytime trend over this later period. These results also agree fairly well with the radiosonde 1996 to 2007 night
15
and day trends of 0.09 (0.05) and 0.05 (0.04) mm/y. A higher nighttime than daytime trend in water vapour is consistent with the fact that minimum surface air temperatures have increased faster than maximum temperatures in the period between 1950 and 2004 (Vose et al., 2005).
An average temperature trend of 0.06 (0.05) K/y was calculated for 1996–2007
us-20
ing the Basel, Bern, Chaumont, Geneva and Z ¨urich homogenized temperature series (Begert et al., 2005). Under the assumption of constant relative humidity, the expected water vapour increase is 0.36 (0.30)%/y. In comparison, trends of 0.25 [0.34], 0.39 (0.44) and 0.45 (0.29)%/y were calculated for ECMWF, TROWARA and RS (s-200) IWV. The results are consistent with the change predicted by the surface temperature
25
increase, but a longer time period is required for statistically significant results and to determine the cause of the water vapour increase.
ACPD
9, 7239–7271, 2009Tropospheric water vapour above Switzerland over the
last 12 years
J. Morland et al.
Title Page
Abstract Introduction
Conclusions References
Tables Figures
◭ ◮
◭ ◮
Back Close
Full Screen / Esc
Printer-friendly Version
Interactive Discussion
1996–2007 series produces a similar trend of 0.41 (0.37)%/y. From this it can be con-cluded that the TROWARA trends are not greatly sensitive to the endpoints.
5.2 Mann Kendall analysis
The Mann Kendall (MK) technique allows monthly or seasonal trends to be calculated. It was corrected for autocorrelation in the data (Hamed and Rao, 1998) and trend
mag-5
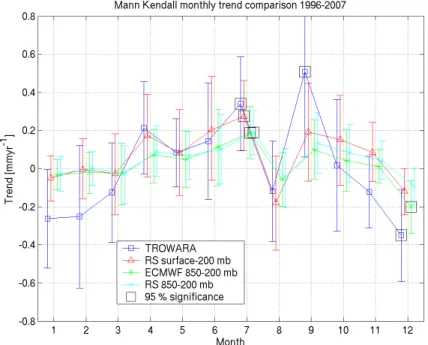
nitude was determined using the Sen’s slope estimator (Sen, 1968). Figure 7 shows the monthly trends calculated using all observation times. The absolute values are larger than the LSA trends calculated for the whole year. In December to March, the trends are close to zero or negative in agreement with the findings of Nilsson and El-gered (2008). December is the only winter month with a statistically significant trend of
10
−0.20 (0.14) and−0.36 (0.24) mm/y for ECMWF and TROWARA, respectively, which
is equivalent to−3.6 (2.5) to−4.3 (2.9)%/y. Positive trends are seen from April to
Oc-tober, with the exception of August, which has a negative trend. July is the only month showing a positive statistically significant trend for all datasets of+0.19 (0.14) to+0.34 (0.25) mm/y or +1.2 (0.8) to +1.6 (1.1)%/y. The negative trend seen in all datasets
15
in August could be due to the surface moisture drying out and reducing evaporation. This tendency was observed by Guerova and Morland (2008) in a study of GPS and radiosonde IWV during the summer 2003 heatwave.
The trend directions are in agreement for every month except November for which the trends are not significant for any dataset. In September, TROWARA shows a stronger
20
positive trend than the other datasets and in December to March a stronger negative trend. To test whether this was due to the gaps in the TROWARA dataset, a trend analysis was carried out on the radiosonde data for only the months during which a TROWARA monthly mean was also available. The RS (s-200) trends calculated using the masked dataset were closer to the TROWARA trends for March and September,
25
ACPD
9, 7239–7271, 2009Tropospheric water vapour above Switzerland over the
last 12 years
J. Morland et al.
Title Page
Abstract Introduction
Conclusions References
Tables Figures
◭ ◮
◭ ◮
Back Close
Full Screen / Esc
Printer-friendly Version
Interactive Discussion
When midday or midnight trends are examined with the MK technique, the same pattern is seen as with the LSA in that midnight trends are higher than midday trends for ECMWF and radiosonde, whilst the opposite is true for TROWARA. The ECMWF and TROWARA trends are on average 0.02 and 0.06 mm/y lower than radiosonde trends with standard deviations of 0.03 and 0.17 mm/y, respectively. It is not surprising that
5
the radiosonde agrees better with ECMWF than with TROWARA because the Payerne radiosonde data are assimilated in the operational analysis.
6 Conclusions
Homogenisation techniques, which were originally developed for temperature and pre-cipitation measurements, were applied to the TROWARA IWV data. The reference
10
series were the Payerne radiosonde and IWV calculated for the atmospheric layer between weather stations separated by 380 to 420 m altitude. Changepoints due to known instrument problems were confirmed and an additional break in the series, as-sociated with a gap in measurements, was identified for which no instrument informa-tion had been recorded. The original TROWARA time series was corrected with the
15
help of the changepoint magnitudes identified by the homogenisation techniques as well as comparison with simultaneous radiosonde, GPS and SPM data. The diff er-ences between the corrected TROWARA data and radiosonde, GPS and SPM data IWV lay between±0.6 mm.
An analysis of the 1996 to 2007 monthly climatology of several datasets revealed
20
that sampling differences can cause significant variation in the monthly means. The SPM, which is restricted to sunny conditions, has a negative bias of around 20% IWV compared to TROWARA. On the other hand the GPS, which can measure in all weather conditions, has a positive bias of 7 to 17% compared to TROWARA monthly means. GPS and TROWARA data obtained in non-raining conditions showed that less than
25
ACPD
9, 7239–7271, 2009Tropospheric water vapour above Switzerland over the
last 12 years
J. Morland et al.
Title Page
Abstract Introduction
Conclusions References
Tables Figures
◭ ◮
◭ ◮
Back Close
Full Screen / Esc
Printer-friendly Version
Interactive Discussion
conditions were included in this analysis. Due to its sheltered location, TROWARA has been able to measure in some, but not all, light rain conditions since 2003. Care must be taken not to introduce an artificial positive trend if these data are included in a future trend analysis.
A diurnal cycle in TROWARA IWV was detected which had an amplitude of 0.32 mm,
5
a maximum beween 19:00 and 21:00 UT and a minimum at 11:00 UT. A comparison with GPS data showed that calculating GPS IWV without damping the diurnal cycle in the surface air temperature produces an IWV cycle which is shifted one or two hours earlier than the TROWARA cycle. Damping or removing the diurnal cycle from the surface air temperature used in the GPS Zenith Total Delay to IWV conversion, leads
10
to a much better match with the TROWARA diurnal cycle. ECMWF data match the TROWARA diurnal cycle reasonably well considering that there are only four datapoints each day. The radiosonde, however, produces an unreasonably large amplitude in the IWV diurnal cycle and this was attributed to an underestimate of IWV at midday when the radiosonde is heated by solar radiation.
15
Using least squares analysis, the three datasets show consistent positive trends in IWV from 1996 to 2007. The radiosonde midnight trend was significant at the 90% level whilst the TROWARA midday trend and radiosonde trend for all observations were significant at the 89% level. The seasonal Mann Kendall analysis showed trends of the same direction for all three datasets for all months except November, which was
20
not statistically significant. All datasets indicated a significant positive trend in July and TROWARA and ECMWF showed a significant negative trend in December.
To detect a trend at the 95% significance level, 13, 15 and 20 full years of data are required for the radiosonde, TROWARA and ECMWF datasets, respectively, accord-ing to the method of Weatherhead (2000). Establishaccord-ing the statistical significance of
25
ACPD
9, 7239–7271, 2009Tropospheric water vapour above Switzerland over the
last 12 years
J. Morland et al.
Title Page
Abstract Introduction
Conclusions References
Tables Figures
◭ ◮
◭ ◮
Back Close
Full Screen / Esc
Printer-friendly Version
Interactive Discussion
TROWARA IWV product is now being calculated using a new algorithm which was developed by M ¨atzler and Morland, 2008 to improve the estimate of ILW (Integrated Liquid Water). The data from the old algorithm, based on the work of Wu (1979), are still being saved in order to allow comparisons between the two products. Based on an analysis of one year of data, the new algorithm has a bias of only+0.02 mm in IWV
5
relative to the old one, which is promising for its use in future climate research.
Acknowledgement. This work was supported by NCCR Climate. The help of E. Graham, L. Martin and the IAP Electronics Workshop in operating and maintaining TROWARA is greatly appreciated. We acknowledge MeteoSwiss and Swisstopo for providing the meteorological and GPS data.
10
References
Alexandersson, H.: A homogeneity test applied to precipitation data, J. Climatol., 6, 661–675, 1986.
Begert M., Schlegel, T., and Kirchhofer, W.: Homogeneous temperature and precipitation series of Switzerland from 1864 to 2000, Int. J. Climatol., 25, 65–80, doi:10.1002/joc.1118, 2005.
15
Bevis, M., Businger, S., Herring, T. A., Rocken, C., Anthes, R. A., and Ware, R. H.: GPS Mete-orology: Remote sensing of atmospheric water vapor using the global positioning system, J. Geophys. Res., 97(D14), 15787–15801, 1992.
Collaud Coen, M., Weingartner, E., Nyeki, S., Cozic, J., Henning, S., Verheggen, B., Gehrig, R., and Baltensperger, U.: Long-term trend analysis of aerosol variables at the high-alpine site
20
Jungfraujoch, J. Geophys. Res., 112, D13213, doi:10.1029/2006JD007995, 2007.
Dai A., Wang, J., Ware, R. H., and Van Hove, T.: Diurnal variation in water vapor over North America and its implications for sampling errors in radiosonde humidity, J. Geophys. Res., 107(D10), 4090, doi:10.1029/2001JD000642, 2002.
Guerova, G., Brockmann, E., Quiby, J., Schubiger, F., and M ¨atzler, C.: Validation of NWP
25
mesoscale models with Swiss GPS Network AGNES, J. Appl. Meteorol., 42(1), 141–150, 2003.
as-ACPD
9, 7239–7271, 2009Tropospheric water vapour above Switzerland over the
last 12 years
J. Morland et al.
Title Page
Abstract Introduction
Conclusions References
Tables Figures
◭ ◮
◭ ◮
Back Close
Full Screen / Esc
Printer-friendly Version
Interactive Discussion
sessment of measured and modeled integrated water vapor in Switzerland for the period 2001–2003, J. Appl. Meteorol., 44(7), 1033–1044, 2005.
Guerova, G. and Morland, J.: Water vapour anomaly during the 2003 summer in Switzerland, AGU Chapman Conference, Hawaii, USA, 20–24 October, 2008.
G ¨uldner, J. and Sp ¨ankuch, D.: Results of year-round remotely sensed integrated water vapor
5
by ground-based microwave radiometry, J. Appl. Meteor., 38, 981–988, 1999.
Haas, R., Elgered, G., Johansson, J., and Gradinarsky, L.: Assessing Long Term Trends in the Atmospheric Water Vapor Content by Combining Data from VLBI, GPS, Radiosondes and Microwave Radiometry, in Proceedings of 16th Working Meeting on European VLBI for Geodesy and Astrometry, edited by W. Schwegmann and V. Thorandt, Bundesamt f ¨ur
10
Kartographie und Geod ¨asie, Frankfurt/Leipzig, 279–288, 2003.
Hagemann S., Bengtsson, L., and Gendt, G.: On the determination of atmospheric water vapor from GPS measurements, J. Geophys. Res., 108(D21), 4678, doi:10.1029/2002JD003235, 2003.
Hall, A. and Manabe, S.: The role of water vapor feedback in Unperturbed Climate Variability
15
and Global Warming, J. Climate, 12, 2327–2346, 1999.
Hamed, K. A. and Rao, A. R.: A modified Mann-Kendall trend test for autocorrelated data, J. Hydrol. 204, 182–196, 1998.
Hirsch, R. M. and Slack, J. R.: A nonparametric trend trest for seasonal data with serial depen-dence, Water Resour. Res., 20, 727–732, 1984.
20
Ingold, T. and M ¨atzler, C.: Four Years of Columnar Water Vapor Measurements above the Swiss Central Plain using Radiosondes and a Microwave Radiometer, Research Report No. 2000– 2002, Institute of Applied Physics, University of Bern, 26 pp., 2000.
Ingold, T., Schmid, B., Matzler, C., Demoulin, P., and Kampfer, N.: Modeled and empirical approaches for retrieving columnar water vapor from solar transmittance measurements in
25
the 0.72, 0.82 and 0.94 m absorption bands, J. Geophys. Res., 105(D19), 24327–24344, doi:10.1029/2000JD900392, 2000.
Jeannet, P., Ruffieux, D., Nater, R., Berger, H., Levrat, G., and Hewison, T.: Temperatur- und Feuchtigkeitsprofile: Vergleich von Radiosonden und Bodengestuetzten Fernerkundungsys-tem, Proceedings of DACH 2004 Meteorologentagung, 7–10 September 2004, Karlsruhe,
30
Germany, 2004.
ACPD
9, 7239–7271, 2009Tropospheric water vapour above Switzerland over the
last 12 years
J. Morland et al.
Title Page
Abstract Introduction
Conclusions References
Tables Figures
◭ ◮
◭ ◮
Back Close
Full Screen / Esc
Printer-friendly Version
Interactive Discussion
Miloshevich L. M., V ¨omel, H., Whiteman, D. N., Lesht, B. M., Schmidlin, F. J., and Russo, F.: Absolute accuracy of water vapor measurements from six operational radiosonde types launched during AWEX-G and implications for AIRS validation, J. Geophys. Res., 111, D09S10, doi:10.1029/2005JD006083, 2006.
Morland, J.: TROWARA – Tropospheric Water Vapour Radiometer. Radiometer review and new
5
calibration model, Research Report No. 2002–15-MW, Institute of Applied Physics, University of Bern, 29 pp., 2002.
Morland, J.: TROWARA – rain flag development and stability of instrument and calibration,, Research Report No. 2007–13-MW, Institute of Applied Physics, University of Bern, 45 pp., 2007.
10
Morland, J. and M ¨atzler, C.: Spatial interpolation of GPS integrated water vapour measure-ments made in the Swiss Alps, Meteorol. Appl., 14, 15–26, 2007.
Nilsson, T. and Elgered, G.: Long-term trends in the atmospheric water vapor content estimated from ground-based GPS data, J. Geophys. Res., 113, D19101, doi:10.1029/2008JD010110, 2008.
15
Peter, R. and K ¨ampfer, N.: Radiometric Determination of Water Vapor and Liquid Water and Its Validation With Other Techniques, J. Geophys. Res., 97(D16), 18173–18183, 1992.
Revercomb, H. E., Turner, D. D., Tobin, D. C., Knuteson, R. O., Feltz, W. F., Barnard, J., B ¨osenberg, J., Clough, S., Cook, D., Ferrare, R., Goldsmith, J., Gutman, S., Halthore, R., Lesht, B., Liljegren, J., Linn ´e, H., Michalsky, J., Morris, V., Porch, W., Richardson, S.,
20
Schmid, B., Splitt, M., Van Hove, T., Westwater, E. and Whiteman, D.: The ARM program’s water vapor intensive observation periods, Bull. Am. Meteorol. Soc., 84(2), 217–236, 2003. Ross, R. J. and Elliott, W. P.: Tropospheric water vapor climatology and trends over North
America: 1973–1993, J. Climate, 9, 3561–3574, 1996.
Ross, R. J. and Elliott, W. P.: Radiosonde-based Northern Hemisphere tropospheric water
25
vapor trends, J. Climate, 14, 1602–1612, 2001.
Sen, P. K.: Estimates of the regression coefficient based on Kendall’s tau, J. Am. Statist. Assoc., 63, 1379–1389, 1968.
Trenberth, K. E., Fasullo, J., and Smith, L.: Trends and variability in column-integrated atmo-spheric water vapor, Clim. Dynam., 24(7–8), 741–758, doi:10.1007/s00382–005-0017–4,
30
2005.
ACPD
9, 7239–7271, 2009Tropospheric water vapour above Switzerland over the
last 12 years
J. Morland et al.
Title Page
Abstract Introduction
Conclusions References
Tables Figures
◭ ◮
◭ ◮
Back Close
Full Screen / Esc
Printer-friendly Version
Interactive Discussion
Vose, R. S., Easterling, D. R., and Gleason, B.: Maximum and minimum temperature trends for the globe: An update through 2004, Geophys. Res. Lett., 32, L23822, doi:10.1029/2005GL024379, 2005.
Wang J., Zhang, L., and Dai, A.: Global estimates of water-vapor-weighted mean tem-perature of the atmosphere for GPS applications, J. Geophys. Res., 110, D21101,
5
doi:10.1029/2005JD006215, 2005.
Weatherhead, E. C., Reinsel, G. C., Tiao, G. C., Jackman, C. H., Bishop, L., Hollandsworth Frith, S. M., DeLuisi, J., Keller, T., Oltmans, S. J., Fleming, E. L., Wuebbles, D. J., Kerr, J. B., Miller, A. J., Herman, J., McPeters, R., Nagatani, R. M., and Frederick, J. E.: Detecting the recovery of total column ozone, J. Geophys. Res., 105(D17), 22201–22210,
10
doi:10.1029/2000JD900063, 2000.
ACPD
9, 7239–7271, 2009Tropospheric water vapour above Switzerland over the
last 12 years
J. Morland et al.
Title Page
Abstract Introduction
Conclusions References
Tables Figures
◭ ◮
◭ ◮
Back Close
Full Screen / Esc
Printer-friendly Version
Interactive Discussion
ACPD
9, 7239–7271, 2009Tropospheric water vapour above Switzerland over the
last 12 years
J. Morland et al.
Title Page
Abstract Introduction
Conclusions References
Tables Figures
◭ ◮
◭ ◮
Back Close
Full Screen / Esc
Printer-friendly Version
Interactive Discussion
ACPD
9, 7239–7271, 2009Tropospheric water vapour above Switzerland over the
last 12 years
J. Morland et al.
Title Page
Abstract Introduction
Conclusions References
Tables Figures
◭ ◮
◭ ◮
Back Close
Full Screen / Esc
Printer-friendly Version
Interactive Discussion
ACPD
9, 7239–7271, 2009Tropospheric water vapour above Switzerland over the
last 12 years
J. Morland et al.
Title Page
Abstract Introduction
Conclusions References
Tables Figures
◭ ◮
◭ ◮
Back Close
Full Screen / Esc
Printer-friendly Version
Interactive Discussion
ACPD
9, 7239–7271, 2009Tropospheric water vapour above Switzerland over the
last 12 years
J. Morland et al.
Title Page
Abstract Introduction
Conclusions References
Tables Figures
◭ ◮
◭ ◮
Back Close
Full Screen / Esc
Printer-friendly Version
Interactive Discussion
ACPD
9, 7239–7271, 2009Tropospheric water vapour above Switzerland over the
last 12 years
J. Morland et al.
Title Page
Abstract Introduction
Conclusions References
Tables Figures
◭ ◮
◭ ◮
Back Close
Full Screen / Esc
Printer-friendly Version
Interactive Discussion
ACPD
9, 7239–7271, 2009Tropospheric water vapour above Switzerland over the
last 12 years
J. Morland et al.
Title Page
Abstract Introduction
Conclusions References
Tables Figures
◭ ◮
◭ ◮
Back Close
Full Screen / Esc
Printer-friendly Version
Interactive Discussion