High Connectivity among Blue Crab
(Callinectes sapidus) Populations in the
Western South Atlantic
Ana Luzia Figueiredo Lacerda1*, Ralf Kersanach2, Maria Cristina Silva Cortinhas1, Pedro Fernandes Sanmartin Prata1, Luiz Felipe Cestari Dumont1, Maíra Carneiro Proietti1,
Rodrigo Maggioni3, Fernando D’Incao1
1Instituto de Oceanografia, Universidade Federal do Rio Grande, Rio Grande do Sul, Brasil,2Instituto de Ciências Biológicas, Universidade Federal do Rio Grande, Rio Grande do Sul, Brasil,3Instituto de Ciências do Mar, Universidade Federal do Ceará, Ceará, Brasil
Abstract
Population connectivity in the blue crabCallinectes sapiduswas evaluated along 740 km of the Western South Atlantic coast. Blue crabs are the most exploited portunid in Brazil. Despite their economic importance, few studies report their ecology or population structure. Here we sampled four estuarine areas in southern Brazil during winter 2013 and summer 2014 in order to evaluate diversity, gene flow and structure of these populations. Nine microsatellite markers were evaluated for 213 adult crabs, with identification of seven poly-morphic loci and 183 alleles. PairwiseFSTvalues indicated low population structure ranging
from -0.00023 to 0.01755. A Mantel test revealed that the geographic distance does not influence genetic (r = -0.48), and structure/migration rates confirmed this, showing that even the populations located at the opposite extremities of our covered region presented lowFST
and exchanged migrants. These findings show that there is a significant amount of gene flow between blue crab populations in South Brazil, likely influenced by local current dynam-ics that allow the transport of a high number of larvae between estuaries. Considering the elevated gene flow, the populations can be considered a single genetic stock. However, fur-ther information on population size and dynamics, as well as fishery demands and impacts at different regions, are necessary for harvest management purposes.
Introduction
Understanding the population structure of commercially valuable species is extremely impor-tant for identifying stocks, defining fishing boundaries, and managing exploitation of fishery resources [1,2]. The definition of limits for fisheries requires reliable information on gene flow and the number of migrants exchanged between different areas, since populations affected by natural or human pressures may or may not be reestablished by individuals from neighboring populations [2,3].
a11111
OPEN ACCESS
Citation:Lacerda ALF, Kersanach R, Cortinhas MCS, Prata PFS, Dumont LFC, Proietti MC, et al. (2016) High Connectivity among Blue Crab (Callinectes sapidus) Populations in the Western South Atlantic. PLoS ONE 11(4): e0153124. doi:10.1371/journal.pone.0153124
Editor:Daniel Rittschof, Duke University Marine Laboratory, UNITED STATES
Received:September 1, 2015
Accepted:March 24, 2016
Published:April 11, 2016
Copyright:© 2016 Lacerda et al. This is an open access article distributed under the terms of the
Creative Commons Attribution License, which permits unrestricted use, distribution, and reproduction in any medium, provided the original author and source are credited.
Data Availability Statement:All files are available from the FigShare database (DOIhttp://dx.doi.org/10. 6084/m9.figshare.1504100).
Funding:This research was supported by grants from Universidade Federal do Rio Grande- FURG (http://www.furg.br) and Coordenação de
Genetic markers are commonly used to evaluate the degree of connection among popula-tions of marine invertebrates, since the minute size of these organisms during their larval phase hinders direct observations of dispersal between areas [4,5]. Microsatellites are a type of genetic marker frequently applied in studies involving population and conservation genetics, and con-sist of tandem repetitions of short nucleotide motifs (2–6 bp) found abundantly in the genome [6,7]. Due to their high polymorphism, these markers are very useful in differentiating popula-tions and inferring dispersal patterns [8–10]. For instance, microsatellites have been employed to better understand populations of animals with highly dispersive larvae such as the prawn Penaeus monodon[10] and the crabCarcinus maenas[11], as well the blue crabCallinectes sapidus[12]. This information can be applied to management strategies, since genetically struc-tured populations should be considered separate management units for maintenance of genetic diversity [7].
The blue crab is a marine-estuarine crustacean [13,14] that lives for up to three and a half years [15]. Mating occurs inside estuaries and is closely coordinate with the molt cycle, which is controlled by temperature [16,17]. Gonadal maturation can occur at temperatures above 10°C, when females become active to forage and can therefore mature their ovaries [18]. Tim-ing and duration of their spawnTim-ing season is influenced by salinity, and therefore varies tempo-rally and spatially [19]. In temperate areas with marked seasonality, spawning occurs during spring and peaks in summer, when salinity is usually higher [19,20]. At these zones, the repro-ductive cycle is characterized by copulation in estuarine waters, after which males remain in the upper estuary while inseminated females migrate to the high salinity waters of lower estua-rine and shelf areas for egg deposition from the end of spring to the end of summer [16,19,20]. Larvae then hatch in the ocean, where they are influenced mainly by nearshore wind-generated surface currents. Eventually they return to the estuary through selective tidal stream transport identified using sensorial cues [21]. In this manner, during the larval phase blue crabs are sub-ject to the oceanographic processes that occur in the coastal zone.
The eastern coast of Brazil in influenced by two main ocean current systems: the Brazil Cur-rent (BC) and the Malvinas CurCur-rent (MC) [22]. The BC is formed at around 10°S, and is the western boundary current of the South Atlantic subtropical gyre, transporting warm, high salinity waters poleward and influencing most of the eastern coast during the entire year [23– 25]. The MC is formed at around 55°S and flows northward carrying cold, low salinity waters, influencing mainly the South Brazilian coast in the winter when it is intensified [26,27]. The BC and MC interface at between 28–36°S in what is known as the Subtropical Confluence Zone; the latitude where this zone occurs can vary seasonally according to mass transport of both currents, as well as wind forcing [28]. These currents, as well as their seasonal variations, can influence regional transport ofC.sapiduslarvae.
Blue crabs represent an important commercial and recreational asset valued at approxi-mately US$185 million worldwide in 2013 [29], and are the most exploited portunid species in Brazil [30]. In some regions, this species is commonly used as an alternative during closed sea-sons of other fishery resources, such as the anchovyAnchoviella lepidentostolein the southeast and the pink shrimpFarfantepenaeus paulensisin South Brazil, when it is commonly caught using banned fishing gear [30]. Despite its economic importance in the region, few studies dis-cuss the ecology and populations ofC.sapidusin the Western South Atlantic [31]. Such studies are extremely important for producing baseline data and establishing management strategies of blue crab fishery stocks.
In this context, the present work aimed to evaluate the genetic diversity and connectivity of blue crab populations in Western South Atlantic. Since coastal ocean currents are likely to influence larval transport and gene flow between areas, we tested the hypothesis that there are seasonal differences in gene flow between populations due to variations in currents.
Competing Interests:The authors have declared
Materials and Methods
Ethics statements
This work was approved by the evaluation committee of the Biological Oceanography Master Program of the Universidade Federal do Rio Grande-FURG. According to Normative Instruc-tion 154/March 2007, all capture, tagging, sampling and transport of biological samples of wild animals for scientific purposes must have approval from Instituto Chico Mendes de Conserva-ção da Biodiversidade (ICMBio) SISBIO committees. This study was approved by ICMBio, and conducted under SISBIO license #40765–1.
Sampling
Adult blue crabs were sampled along 740 km of the cost of Santa Catarina (SC) and Rio Grande do Sul (RS) states, in South Brazil, at four areas: Itajaí and Laguna (SC), Tramandaí and Lagoa dos Patos (RS) (Fig 1). Samples were collected in winter 2013 and summer 2014 at each loca-tion, but the Tramandaí samples from summer were not used since inadequate storing degraded their DNA. Geographical coordinates and sample size of each area are shown in Table 1.
Individuals were captured using nets and traps at Lagoa dos Patos and Itajaí, or purchased directly from local fishermen after morphological identification at Tramandaí, Laguna and Ita-jaí. Sampling within regions was opportunistic, but always conducted inside the estuary in order to adequately represent the population. Muscle tissue was removed from the pereiopods, placed in absolute alcohol, and stored at -20°C temperature until laboratorial analyses.
DNA extraction
Genomic DNA was extracted using standard proteinase K digestion and Phenol:Chlorophorm: Isoamyl Alcohol method [32]. Quantification and purity analysis were done with a NANO-DROP 20001spectrophotometer, and DNA concentrations were standardized to 100 ng/μl using ultrapure water.
Microsatellite amplification
Nine microsatellite loci previously described forCallinectes sapidus(12) were amplified through Polymerase Chain Reaction (PCR) (Table 2). Each PCR, contained: 10ng genomic DNA, 1.6 mM MgCl2, 30 mM Tris-HCL at pH 8.4, 75 mM KCL, 0.2 mM dNTP, 0.5 U
Plati-num Taq DNA polymerase (Invitrogen), 0.06μM forward primer labeled with an M13 tail, 0.3μM reverse primer, 0.24μM universal fluorescent-label M13 primer, and ultrapure water to complete a total volume of 10μL [33].
Amplification conditions were the same for all primers, with variations only in the anneal-ing temperature (Table 2). PCR conditions were: initial denaturation at 95°C for 2 min; 30 cycles of 1 min at 95°C, 30 s at 46–64°C (depending on the primer) and 1 min at 72°C; 8 cycles of 30 s at 94°C, 42 s at 53°C, and 1 min at 72°C; final extension step of 30 min at 72°C; and cooling to 4°C. Prior to genotyping PCR products were qualitatively analyzed through electro-phoresis on 1% agarose gels stained with GelRedTM(Biotium).
Genotyping
Fig 1.Callinectes sapidussampling areas in the Western South Atlantic.LPA = Lagoa dos Patos; TRA = Tramandaí; LAG = Laguna; ITA = Itajaí.
doi:10.1371/journal.pone.0153124.g001
Table 1. Coordinates and sample sizes of study areas in winter 2013 and summer 2014.
Location Abbreviation Latitude Longitude Sample size
Winter (W) Summer (S)
Lagoa dos Patos LPA 32°02’23.91”S 52°07’43.32”O 30 28
Tramandaí TRA 29°58’56.29”S 50°08’22.69”O 34
-Laguna LAG 28°29’02.13”S 48°47’12.35”O 31 36
Itajaí ITA 26°54’32.80”S 48°39’02.28”O 21 33
dyes 6-FAM™, VIC1, NED™and PET1. Results were visualized and molecular weight of alleles determined with GeneMapper v 4.1 (Applied Biosystems).
Data analyses
Identification of null alleles and correction of allelic frequencies were performed with MICRO--CHECKER 2.2.3 [34]. Allele frequencies per locus, frequency of private alleles, observed and expected heterozygosis (respectively Ho and He), Hardy-Weinberg equilibrium (HWE) [35], linkage disequilibrium (LD), and inbreeding coefficient (FIS) [36], were obtained with GENEPOP
4.3 [37]. Significance of HWE was determined after a Bonferroni correction (α<0.001). PairwiseFSTestimates and Analysis of Molecular Variance (AMOVA) were used to
com-pare genetic differentiation among groups by season (winter and summer). AllFST
signifi-cances were determined after a Bonferroni correction (α<0.001). Due to insignificantFST(α
<0.001) between seasons, winter and summer samples of each population were grouped and
genetic structure inferred only between populations. Isolation by distance was evaluated by a Mantel test following Rousset [38] using the length of coastline between sampling sites andFST
calculated across all loci. All pairwiseFST, AMOVA and the Mantel test were run in
ARLE-QUIN 3.0 [39].
Population clustering was done using a Bayesian approach in STRUCTURE 2.3.4 [40], assuming the ancestral model with population admixture, and correlated allele frequencies. Simulations were done using a 50,000 step burn-in, followed by 100,000 replicates of the Mar-kov Chain Monte Carlo with the number of clusters varying from 1 to 4. For each K, twenty independent replicate runs were conducted in order to estimateΔK [41], and then corrected in
STRUCTURE HARVESTER to infer the most likely number of population clusters (K) though the Evanno method [42].
To estimate the migration rates between populations, a maximum likelihood approach based on the coalescent method was implemented in MIGRATE 3.6 [43] using default settings Table 2. Sequences and annealing temperature T (°C) of forward (F) and reverse (R) primers used in PCRs, with underlined sequence in M13 tail, as well as fluorescent dye labels used for genotyping.
Locus name Primer sequence (5–3’) Repeat motif Anelling Temperature Label
CSC-001 F: TGTAAAACGACGGCCAGTATTGGGTGGTTGCTTCAT (CCTT)14 55°C 6-FAM™
R: ACGAGGAGAAAGTTGAGATTGC
CSC-004 F: TGTAAAACGACGGCCAGTACAACGGTAATTGTACGAGAAA (TG)16 58°C VIC1
R: AGGCTAATGCCACCATCATC
CSC-007 F: TGTAAAACGACGGCCAGTGGGACAAACAACATGAAAGTGG (GA)35 59°C PET1
R: GAAAACCTATTCCGGGAAGC
CSC-074 F: TGTAAAACGACGGCCAGTATGAGTACTGTGGCGTGTTTGG (GT)6 60°C VIC1
R: CAAAGATGCCCCCTTATTTACC
CSC-094 F: TGTAAAACGACGGCC AGTGTATCCACAACTGACTTTTCTCC (TCTG)6 64°C VIC1
R: GGAGAAACACCCTCAGAAAACC
CSA-035 F: TGTAAAACGACGGCC AGT GACTGGAGAAACGATAGGTG (GT)29 46°C NED™
R: AACAAGGAGATTACACGGATTC
CSA-073 F: TGTAAAACGACGGCC AGTGCCTATTTGCCTCGCTACCCC (GT)57 55°C NED™
R:GTCACCAAAGTTGAGCAAGACTCTCT
CSA-092 F: TGTAAAACGACGGCCAGTGTCAGTTTATTGGGAATCTCTTG (GT)13 52°C 6-FAM™
R: CTTCCATCCTAAACCACACCTGC
CSA-121 F:TGTAAAACGACGGCCAGTAATAAGAGAACAAACACACGGGG (AGAC)9 56°C PET1
R: AACTGCTTGCCTTCCTTCCATC
with Brownian motion approximation through mean values of the parametersθand M, with
γab=θb.Mab, whereγis the effective number of migrants,θthe populations size and M =m/μ,
wheremis the immigration rate andμis mutation rate [43,44]. Migration rates are given as effective number of migrants.
Results
Allelic diversity
Seven of the nine analyzed microsatellite loci were polymorphic, displaying high levels of allelic diversity. Loci CSC-074 and CSA-092 were monomorphic in all locations, and were therefore excluded from all analyses. A total of 183 alleles were detected over the seven polymorphic loci at the four sampled areas, with a mean number of alleles per locus of 26.1. Locus CSA-073 pre-sented the highest number of alleles (43 alleles) while locus CSA-121 displayed the lowest allelic diversity, with four alleles (Table 3).
Genetic variability was similar among samples. Two tetranucleotide microsatellite loci, CSA-121 and CSC-094, displayed lower allelic diversity than the remaining polymorphic loci. The five dinucleotide microsatellite loci (CSA-035, CSA-073, CSC-001, CSC-004, CSC-007) were highly polymorphic and all displayed private alleles to some populations. The frequency of private alleles between locations was low (Table 3).
Heterozygosity and Hardy-Weinberg Equilibrium
Expected heterozygosity (He) per locus varied from 0.1374 (locus CSC-094 at Tramandaí) to 0.9558 (locus CSC-007 at Laguna), and observed heterozygosity (Ho) ranged from 0.0882 (locus CSC-094 at Tramandaí) to 0.9444 (locus CSA-073 at Itajaí). Mean expected heterozy-gosity of all loci was 0.5891, 0.4410, 0.5414 and 0.6148, and mean observed heterozyheterozy-gosity was 0.5419, 0.4538, 0.4392 and 0.5749 for Lagoa dos Patos, Tramandaí, Itajaí and Laguna, respec-tively. Loci CSC-007, CSC-004, CSC-001 and CSA-073 showed deviations from HWE. In this manner, among the 28 locus-area combinations (seven loci, four populations), significant devi-ation from HWE was observed for a total of eight groups (α<0.001) (Table 4).
Population structure and migration rates
The inbreeding coefficient (FIS) varied from -0.0646 at locus CSA-121 to 0.6771 at locus
CSC-001 (both at Tramandaí), and meanFISfor all areas was 0.1116 (Table 4). As noted above,
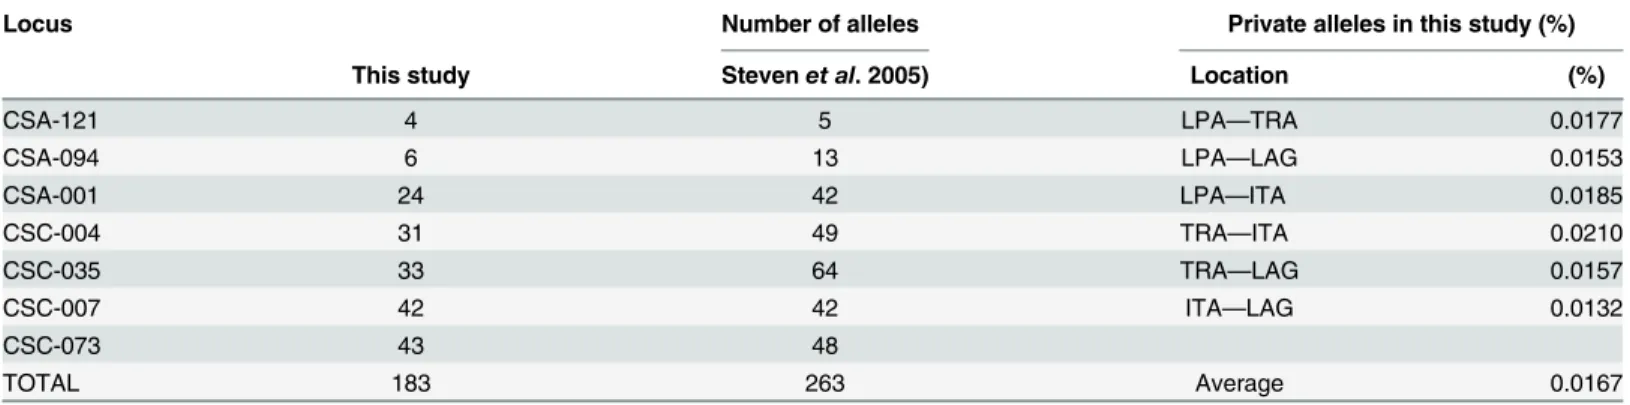
Table 3. Number of alleles to same seven loci found in this study and in Stevenet al., (2005), as well as private alleles in this study, separated by pairwise populations.
Locus Number of alleles Private alleles in this study (%)
This study Stevenet al. 2005) Location (%)
CSA-121 4 5 LPA—TRA 0.0177
CSA-094 6 13 LPA—LAG 0.0153
CSA-001 24 42 LPA—ITA 0.0185
CSC-004 31 49 TRA—ITA 0.0210
CSC-035 33 64 TRA—LAG 0.0157
CSC-007 42 42 ITA—LAG 0.0132
CSC-073 43 48
TOTAL 183 263 Average 0.0167
LPA = Lagoa dos Patos; TRA = Tramandaí; LAG = Laguna; ITA = Itajaí.
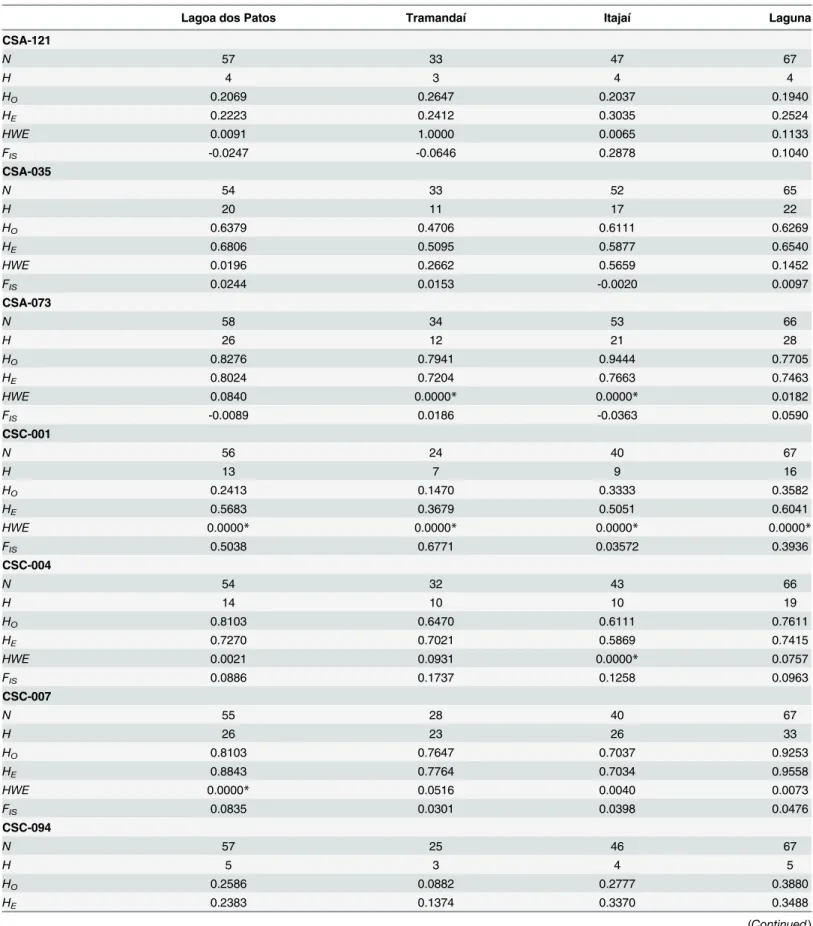
Table 4. Genetic diversity of seven nuclear loci of blue crabs populations sampled at the Western South Atlantic.
Lagoa dos Patos Tramandaí Itajaí Laguna
CSA-121
N 57 33 47 67
H 4 3 4 4
HO 0.2069 0.2647 0.2037 0.1940
HE 0.2223 0.2412 0.3035 0.2524
HWE 0.0091 1.0000 0.0065 0.1133
FIS -0.0247 -0.0646 0.2878 0.1040
CSA-035
N 54 33 52 65
H 20 11 17 22
HO 0.6379 0.4706 0.6111 0.6269
HE 0.6806 0.5095 0.5877 0.6540
HWE 0.0196 0.2662 0.5659 0.1452
FIS 0.0244 0.0153 -0.0020 0.0097
CSA-073
N 58 34 53 66
H 26 12 21 28
HO 0.8276 0.7941 0.9444 0.7705
HE 0.8024 0.7204 0.7663 0.7463
HWE 0.0840 0.0000* 0.0000* 0.0182
FIS -0.0089 0.0186 -0.0363 0.0590
CSC-001
N 56 24 40 67
H 13 7 9 16
HO 0.2413 0.1470 0.3333 0.3582
HE 0.5683 0.3679 0.5051 0.6041
HWE 0.0000* 0.0000* 0.0000* 0.0000*
FIS 0.5038 0.6771 0.03572 0.3936
CSC-004
N 54 32 43 66
H 14 10 10 19
HO 0.8103 0.6470 0.6111 0.7611
HE 0.7270 0.7021 0.5869 0.7415
HWE 0.0021 0.0931 0.0000* 0.0757
FIS 0.0886 0.1737 0.1258 0.0963
CSC-007
N 55 28 40 67
H 26 23 26 33
HO 0.8103 0.7647 0.7037 0.9253
HE 0.8843 0.7764 0.7034 0.9558
HWE 0.0000* 0.0516 0.0040 0.0073
FIS 0.0835 0.0301 0.0398 0.0476
CSC-094
N 57 25 46 67
H 5 3 4 5
HO 0.2586 0.0882 0.2777 0.3880
HE 0.2383 0.1374 0.3370 0.3488
when analyzing structure by season, noFSTvalues were significant after the Bonferroni
correc-tion (α<0.001) (Table 5). Therefore, although some variations were observed (slightly higher structure between populations in the winter than in the summer), individuals sampled in sum-mer and winter were grouped per population for all remaining analyses.
PairwiseFSTvalues varied from -0.00023 to 0.01755, and globalFSTwas 0.00682, revealing
very low structuring between the analyzed populations. HighestFSTwas observed between
Tra-mandaí and Laguna (0.01755), which also indicates low, albeit significant (α<0.001), differen-tiation (Table 6). The AMOVA brought additional evidence to support this low structure: variation was predominantly observed within populations (98%), with little variation among them (-0.08%). Correlation between geographic and genetic distances, as estimated with the Mantel test, was non-significant (r = -0.48).
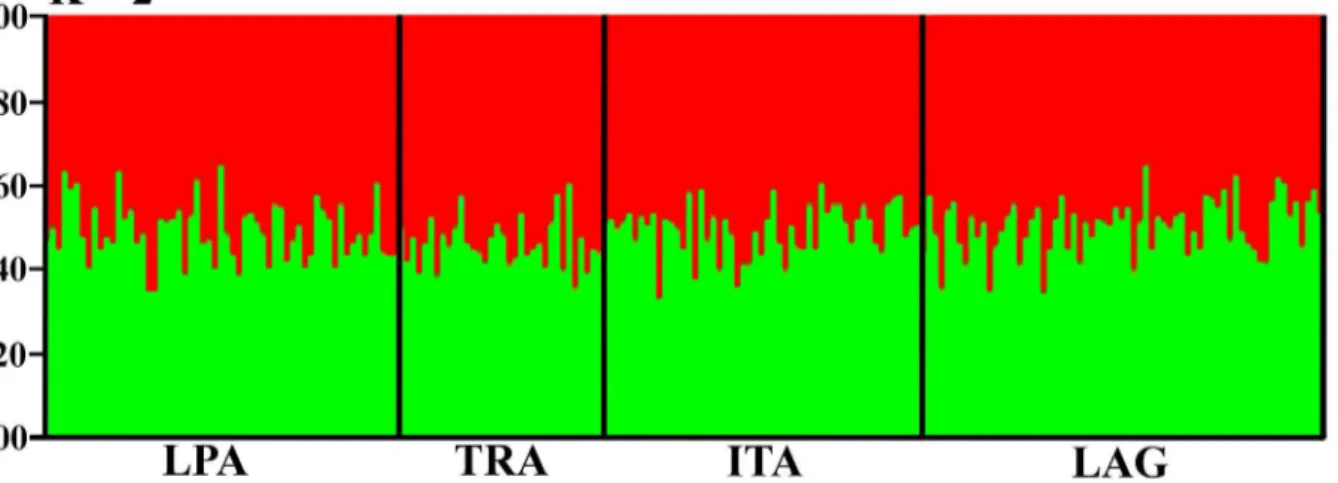
Bayesian posterior probabilities indicated that the sampled populations were grouped into two clusters (K = 2), with all individuals presenting almost equal probabilities of being assigned to both clusters (Fig 2). This once again indicates a scenario of low structure and high admix-ture among blue crab populations in South Brazil.
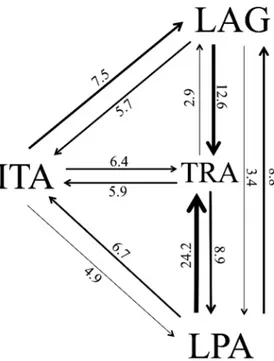
Estimated migration rates showed highest number of migrants from Lagoa dos Patos to Tra-mandaí (γ= 24.19), and lowest from Tramandaí to Itajaí (γ= 2.90) (Fig 3). Tramandaí
pre-sented the hightes number of immigrants and Itajaí the lowest. The second lowest migration rate (γ= 3.44) was observed from Lagoa dos Patos to Itajaí, wich are the two populations
located at the extremities of our study area range, separated by 740 km.
Discussion
Genetic diversity and HWE
Callinectes sapidusfrom four populations in the Western South Atlantic presented relatively high genetic diversity, with 183 alleles found in 213 individuals over the seven considered loci. However, this diversity was lower than the one reported by Stevenet al. [12] for blue crabs from two locations of Chesapeake Bay, in the Western North Atlantic: 263 alleles in 134 indi-viduals over the same seven loci. Heterozygosity and allelic diversity was also lower than those Table 4. (Continued)
Lagoa dos Patos Tramandaí Itajaí Laguna
HWE 1.0000 0.2086 0.0706 0.9191
FIS -0.0293 0.2420 0.2671 -0.0313
Nnumber of genotypes,hnumber of haplotypes,Hoobserved heterozygosity,HEexpected heterozygosity,HWEHardy-Weinberg equilibrium andFIS
inbreeding coefficient. Asterisks indicate significant HWE values after a standard Bonferroni correction (*α<0.001).
doi:10.1371/journal.pone.0153124.t004
Table 5. PairwiseFSTvalues (below diagonal) andp-values (above diagonal) between locations, considering seasons (α<0.001).
LPA W LPA S TRA W ITA W ITA S LAG W LAG S
LPA W - 0.4540 0.0173 0.0262 0.1634 0.1353 0.1336
LPA S -0.00094 - 0.1745 0.2023 0.6583 0.4003 0.7399
TRA W 0.01939 0.00648 - 0.7355 0.0883 0.0131 0.0517
ITA W 0.01869 0.00501 -0.00788 - 0.0927 0.0433 0.1581
ITA S 0.00330 -0.00507 0.00702 0.00551 - 0.2830 0.4298
LAG W 0.00720 0.00020 0.02376 0.01832 0.00085 - 0.7924
LAG S 0.00598 -0.00436 0.01178 0.00532 -0.00119 -0.00489
found by Stevenet al. [12], as well as those reported forCallinectes danaeat the same region studied in the present work [45]. Deviations from HWE observed in several groups indicate significant inbreeding. Elevated inbreeding was also found by Weber & Levy [45] for Calli-nectes danaein southern Brazil through allozymes analysis. Lower diversity and heterozygosity could be a result of continuous gene flow due to larval dispersal between areas, leading to shal-low structure and admixture ofC.sapiduspopulations at the studied region.
Population structure and gene flow
Overall differentiation between blue crab populations in southern Brazil was very low withFST
= 0.00682. This estimate is below theFSTvalue reported for otherC.sapiduspopulations in the
Atlantic, even those separated by smaller distances than the 740 km considered in this work. Yednocket al. [2] analyzed blue crabs sampled along 300 km of the Gulf of Mexico, and found an overallFSTof 0.09460, indicating a higher structure at this region when compared to the
Western South Atlantic. Low structure and high gene flow was also shown through Bayesian clustering, number of migrants between populations, and AMOVA results, allowing us to infer a certain degree of panmixia among populations [3]. Pairwise comparisons between our sam-pled locations showed highestFSTbetween Tramandaí and Laguna (0.01755), wich despite
being significant (α<0.001) is still quite low. Lagoa dos Patos and Itajaí, located at the two margins of our studied region, were not significantly structured (FST= 0.00373). These areas
are separated by over 700 km and it would be expected that gene flow between them be limited, since migration is generally higher between geographically proximal areas [46]. However, gene Table 6. PairwiseFSTvalues (below diagonal) andp-values (above diagonal) between locations.
LPA TRA ITA LAG
LPA - 0.03605 0.14414 0.18919
TRA 0.01245 - 0.27027 0.00000*
ITA 0.00323 -0.00023 - 0.03604
LAG 0.00373 0.01755 0.00408
-*Asterisks indicate significant values (*α<0.001).
doi:10.1371/journal.pone.0153124.t006
Fig 2. STRUCTURE assignment probabilities for blue crabs in South Brazil.K = 2 clusters. Each vertical bar represents one individual, and vertical black lines separate the sampled populations: LPA = Lagoa dos Patos; TRA = Tramandaí; ITA = Itajaí; LAG = Laguna.
exchange between marine populations is influenced by several factors other than distance, such as physical/hydrographical barriers, population sizes, life history patters, and prevailing ocean currents [3,47,48].
Influence of currents on dispersal
Blue crab life history includes an oceanic larval period with seven or eight zoea followed by a megalopa phase, lasting around 31–69 days [13,49]. Therefore, this stage has high potential for dispersal through surface currents. Two large-scale currents possibly influence gene flow observed between the studies populations: the Brazil current, which courses poleward and is intensified in the summer; and the Malvinas Current, equator-bound and more intense in win-ter [27]. Coastal currents are a result of the impact of ocean currents on the topographical fea-tures of the continental shelf, also under strong influence of wind systems [50]. They act along the shelf in a seasonal manner and likely also influence larval dispersal between populations at the region. For instance, based on direction and speed of currents at the southern coast of Bra-zil, D’Incao [51] concluded thatPenaeus paulensis(currentlyFarfantepenaeus paulensis) shrimp post-larvae disperse from the coast of Santa Catarina to Rio Grande do Sul from the end of winter to the end of summer. The same process could be responsible forC.sapiduslarval transport between these areas, since blue crab females lay eggs in the open ocean from the end of spring to autumn [52]. This could explain the large number of migrants from Laguna to Tra-mandaí (seeFig 3).
The dynamic behavior of the Lagoa dos Patos plume can also influence larval flow along South Brazil. Marqueset al. [53] showed that predominant southwestern (SW) winds during the winter increase the plume size along the coast and lead to northwards dispersal of organ-isms. During this season, this intensified plume can influence other lagoons and estuaries along the southern coast, likely transportingC.sapiduslarvae from Rio Grande do Sul to Santa Catarina. Rodrigueset al. [52] found ovigerous females at the Lagoa dos Patos mouth at the Fig 3. Directional migration rates between blue crab populations, given as effective number of migrants.LPA = Lagoa dos Patos; TRA = Tramandaí; ITA = Itajaí; LAG = Laguna.
end of spring, during summer, and in autumn. Considering the larval phase duration of this species, it is possible to infer that during winter the Lagoa dos Patos plume transportsC. sapi-duslarvae ecloded at the end of summer and autumn to estuaries located northwards, rein-forced by southwestern winds and the Malvinas Current [53]. This could explain the large number of migrants from this estuary to Tramandaí. In this manner, these surface ocean cur-rents likely favor the extensive gene flow and consequent low structure ofCallinectes sapidus populations along the southern coast of Brasil.
Implications for management
This work is the first to infer, through genetic markers, the population structure of blue crab populations along the Southern Brazil coast. The results obtained in this work clearly show thatCallinectes sapiduspopulations are highly connected throughout this region. High gene flow and low population structure were evidenced and attributed to dispersal by coastal cur-rents, which present different directions and intensities according to season and likely trans-port blue crab larvae between areas. Information on stock structure is fundamental for
determining impacts of exploitation on genetically separate stocks, and consequently establish-ing effective fisheries management policies. Considerestablish-ing the elevated gene flow between the blue crab populations along southern Brazil, they can be considered a single genetic stock. However, further information on population size and dynamics, as well as fishery demands and impacts at different regions, are necessary for harvest management purposes.
Acknowledgments
A.L.F.L. is a graduate student of the Programa de Pós-graduacão em Oceanografia Biológica (FURG). We thank Luis F. Marins for suggestions on this manuscript and Jamile M. Forte for assistance in the laboratory and suggestions for data processing. This work is a contribution of the research group“Ecologia e Pesca de Crustáceos”and the“Integrated Oceanography and Multiple Uses of the Continental Shelf and the Adjacent Ocean”, Center of Integrated Ocean-ography (INCT-Mar COI–Processo CNPq 565062/2010-7).
Author Contributions
Conceived and designed the experiments: ALFL LFCD RK FD. Performed the experiments: ALFL MCSC PFSP. Analyzed the data: ALFL MCSC RK MCP RM. Contributed reagents/mate-rials/analysis tools: LFCD RK MCP RM FD. Wrote the paper: ALFL RK MCSC MCP RM FD.
References
1. Kordos LM, Burton RS. Genetic differentiation of Texas Gulf coast populations of the blue crab Calli-nectes sapidus. Marine Biology. 1993; 117: 227–233.
2. Yednock BK, Neigel JE. An investigation of genetic population structure in blue crabs,Callinectes sapi-dus, using nuclear gene sequence. Marine Biology. 2014; 161: 871–886.
3. McMillen-jackson AL, Bert TM, Steele P. Population genetics of the blue crabCallinectes sapidus: mod-est population structuring in a background of high gene flow. Marine Biology. 1994; 118: 53–65.
4. Azuma N, Kunihiro Y, Sasaki J, Mihara E, Mihara Y, Yasunaga T, et al. Genetic variation and popula-tion structure of hair crab (Erimacrus isenbeckii) in Japan inferred from mitochondrial DNA sequence analysis. Marine Biotechnology. 2008; 10: 39–48. PMID:17955293
5. Thorrold SR, Jones GP, Hellberg ME, Burton RS, Swearer SE, Neigel JE, et al. Quantifying larval reten-tion and connectivity in marine populareten-tions with artificial and natural markers. Bulletin of Marine Sci-ence. 2002; 70 (1): 291–308.
7. Chang Y, Liang L, Ma H, He J, Sun X. Microsatellite analysis of genetic diversity and population struc-ture of Chinese mitten crab (Eriocheir sinensis). Journal of Genetics and Genomics. 2008; 35: 171– 176. doi:10.1016/S1673-8527(08)60023-5PMID:18355760
8. Herborg LM, Weetman D, Oosterhout CV, Hanfling B. Genetic population structure and contemporary dispersal patterns of a recent European invader, the Chinese mitten crab,Eriocheir sinensis. Molecular Ecology. 2007; 16: 231–242. PMID:17217341
9. Ma H, Cui H, Ma C, Ma L. High genetic diversity and low differentiation in mud crab (Scylla paramamo-sain) along the southeastern coast of China revealed by microsatellite markers. The Journal of Experi-mental Biology. 2012; 215: 3120–3125. doi:10.1242/jeb.071654PMID:22660789
10. Brooker AL, Benzie JAH, Blair D, Versini JJ. Population structure of the giant tiger prawnPenaeus monodonin Australian waters, determined using microsatellite markers. Marine Biology. 2000; 136: 149–157.
11. Pascoal S, Creer S, Taylor MI, Queiroga H, Carvalho G, Mendo S. Development and application of microsatellites inCarcinus maenas: Genetic differentiation between northern and central Portuguese populations. Plos One. 2009; 4(9): e7268. doi:10.1371/journal.pone.0007268PMID:19789651 12. Steven CR, Hill J, Masters B, Place AR. Genetic markers in blue crabs (Callinectes sapidus) I: Isolation
and characterization of microsatellite markers. Journal of Experimental Marine Biology and Ecology. 2005; 319: 3–14.
13. Costlow JD Jr, Bookhout CG. The larval development ofCallinectes sapidus(Rathbun, 1896), reared in the laboratory. Biological Bulletin. 1959; 116(3): 373–396.
14. Hines AH, Lipicus RN, Haddon AM. Population dynamics and habitat partitioning by size, sex, and molt stage of blue crabsCallinectes sapidusin a subestuary of central Chesapeake Bay. Marine Ecology. 1987; 36: 55–64.
15. Rodrigues MA, D’Incao F. Growth comparison betweenCallinectes sapidus(Crustacea, Decapoda, Portunidae) collected on the field and maintained under controlled conditions. Iheringia, Série Zoologia. 2008; 98(3): 372–378.
16. Hines AH, Lipcius RN, Haddon AM. Population dynamincs and habitat partitioning by size, sex, and molt stage of blue crabsCallinectes sapidusin a subestuary of central Chesapeake Bay. Marine Ecol-ogy. 1987; 36: 55–64.
17. Hines AH, Jivoff PR, Bushmann PJ, van Montfrans J, Reed SA, Wolcott DL, et al. Evidence for sperm limitation in the blue crab,Callinectes sapidus. Bulletin of Marine Science. 2003; 72 (2): 287–310.
18. Hines AH, Johnson EG, Darnell MZ, Rittschof D, Miller TJ, Bauer LJ, et al. Predicting effects of climate change on blue crabs in Chesapeake Bay. In: Kruse GH, Eckert GL, Foy RJ, Lipcius RN, Sainte-Marie B, Stram DL, Woodby D (eds.), Biology and Management of exploited crab populations under climate change. Alaska Sea Grant, University of Alaska Fairbanks. doi:10.4027/bmecpcc.2010.22 19. Kennedy VS, Cronin LE, editors. The blue crabCallinectes sapidus. Maryland Sea Grant, 774p.
20. Aguilar R, Hines AH, Wolcott TG, Wolcott DL, Kramer MA, Lipcius RN. The timing and route of move-ment and migration of post-copulatory female blue crabs,Callinectes sapidus(Rathbun, 1896) from the upper Chesapeake Bay. Journal of Experimental Marine Biology and Ecology. 2005; 319:117–128.
21. Forward RB Jr, Tankersley RA, Smith KA, Wech JM. Effects of chemical cues on orientation of blue crab,Callinectes sapidus, megalopae in flow: implications for location of nursery areas. Marine Biology. 2003; 142: 747–756.
22. Matano RP, Palma ED, Piola, AR. The influence of the Brazil and Malvinas Currents on the Southwest-ern Atlantic Shelf circulation. Ocean Science. 2010; 6: 983–995.
23. Silveira ICA, Schmidt ACK, Campos EJD, Godoi SS, Ikeda Y. The Brazil Current off the Eastern Brazil-ian Coast. Revista Brasileira de Oceanografia. 2000; 48(2): 171–183.
24. Stramma L. Geostrophic transport of the South Equatorial Current in the Atlantic. Journal of Marine Research. 1991; 49: 281–294.
25. Chiessi CM, Mulitza S, Groeneveld J, Silva JB, Campos MC, Gurgel MHC. Variability of the Brazil Cur-rent during the late Holocene. Palaeogeography, Palaeoclimatology, Palaeoecology. 2014; 415: 28– 36.
26. Piola AR, Avellaneda M, Guerrero RA, Jardón FP, Palma ED, Romero SI. Malvinas-slope water intru-sions on the northern Patagonia continental shelf. Ocean Science. 2010; 6: 345–359.
27. Zavialov PO, Ghisolfi RD, Garcia CAE. An inverse model for seasonal circulation over the Southern Brazilian Shelf: near-surface velocity from the heat budget. Journal of Physical Oceanography. 1998; 28: 545–562.
29. NOAA. National Oceanographic and Atmospheric Administration, National Marine Fisheries Service, Office of Science and Technology, Commercial Fisheries. Annual commercial landing statistics. 2014.
30. Mendonça JT, Verani JR, Nordi N. Evaluation and management of blue crabCallinectes sapidus (Rath-bun, 1896) (Decapoda- Portunidae) fishery in the Estuary of Cananéia, Iguape and Ilha Comprida, São Paulo, Brazil. Brazilian Journal of Biology. 2010; 70(1): 37–45.
31. Severino-Rodrigues E, Fernandes JM, Moura AAS, Branco GMP, Canéo VOC. Fecundity, reproductive seasonality and maturation size ofCallinectes sapidusfemales (Decapoda: Portunidae) in the South-east coast of Brazil. Rev. Bio. Trop. 2013; 61(2): 595–602.
32. Sambrook KJ, Fritsch EF, Maniatis T. Molecular Cloning: a Laboratory Manual. 2ª edição. New York: Cold Spring Harbor University Press. 1989.
33. Boutin-Ganache I, Raposo M, Raymond M, Deschepper CF. M13-tailed primers improve the readability and usability of microsatellite analyses performed with two different allele-sizing methods. Biotechni-ques. 2001; 31:24–28. PMID:11464515
34. Oosterhoud CV, Hutchinson WF, Wills DPM, Shipley P. MICRO-CHECKER: software for itendifying and correting genotyping errors in microsatellite data. Molecular Ecology Notes. 2004; 4: 535–538.
35. Guo SW, Thompson EA. Performing the exact test of Hardy-Weinberg proportion for multiple alleles. Biometrics. 1992; 48(2): 361–372. PMID:1637966
36. Weir BS, Cockerham CC. EstimatingF-statistics for the analysis of population structure. Evolution. 1984; 38: 1358–1370.
37. Rousset F. GENEPOP’007: a complete re-implementation of the GENEPOP software for Windows and Linux. Molecular Ecology Resources. 2008; 8: 103–106. doi:10.1111/j.1471-8286.2007.01931.x PMID:21585727
38. Rousset F. Genetic differentiation and estimation of gene flow fromF-statistics under isolation by dis-tance. Genetics. 1997; 145:1219–1228 PMID:9093870
39. Excoffier L, Lischer HEL. Arlequin 3.5: A new series of programs to perform population genetics analy-ses under Linux and Windows. Molecular Ecology Resources. 2010; 10: 564–567. doi:10.1111/j. 1755-0998.2010.02847.xPMID:21565059
40. Pritchard JK, Stephens M, Donnelly P. Inference of population structure using multilocus genotype data. Genetics. 2000; 155: 945–959. PMID:10835412
41. Evanno G, Regnaut S, Goudet J. Detecting the number of clusters of individuals using the software STRUCTURE: a simulation study. Molecular Ecology. 2005; 14: 2611–2620. PMID:15969739 42. Earl DA, vonHoldt BM. STRUCTURE HARVESTER: a website and program for visualizing
STRUC-TURE output and implementing the Evanno method. Conservation Genetic Resource. 2012; 4: 359– 361.
43. Beerli P, Felsenstein J. Maximum-likelihood estimation of migration rates and effective populations numbers in two populations using a coalescent approach. Genetics.1999; 152(2): 763–773. PMID: 10353916
44. Beerli P, Felsenstein J. Maximum-likelihood estimation of a migration matrix and effective population sizes innsobpopulations by using a coalescent approach. Proceedings of the National Academy of Sciences of the USA. 2001; 98(8): 4563–4568. PMID:11287657
45. Weber LI, Levy JA. Genetic population structure of the swimming crabCallinectes danae(Crustacea: Decapoda) in southern Brazil. Hydrobiologia. 2000; 420: 203–210.
46. Beacham TD, Supernault J, Miller KM. Population structure of dungeness crab (Cancer magister) in British Columbia. Journal of Shellfish Research. 2008; 27(4): 901–906.
47. Peliz A, Marchesiello P, Dubert J, Almeida MM, Roy C, Queiroga H. A study of crab larvae dispersal on the Western Iberian shelf: physical processes. Journal of Marine Systems. 2007; 68: 215–236.
48. Cowen RK, Sponaugle S. Larval dispersal and marine population connectivity. Annual Review of Marine Science. 2009; 1: 443–466. PMID:21141044
49. Costlow JD Jr. The effect of salinity and temperature on survival and metamorphosis of megalops of the blue crabCallinectes sapidus. Helgolander wissenschaftliche Meeresuntersuchungen. 1967; 15: 84–97.
50. Seeliger U, Odebrecht C, Castello JP. Os ecossistemas costeiro e marinho do extremo sul do Brasil. Rio Grande: Ecoscientia, 1998.- 341p
51. D’Incao F. Pesca e Biologia dePenaeus Paulensisna Lagoa dos Patos, RS. Atlântica. 1991; 13(1): 159–169.