Chromosome Structuring Limits Genome
Plasticity in
Escherichia coli
Emilie Esnault[, Miche`le Valens[, Olivier Espe´li, Fre´de´ric Boccard*
Centre de Ge´ne´tique Mole´culaire du CNRS, 91198 Gif-sur-Yvette, France
Chromosome organizations of related bacterial genera are well conserved despite a very long divergence period. We have assessed the forces limiting bacterial genome plasticity inEscherichia coliby measuring the respective effect of
altering different parameters, including DNA replication, compositional skew of replichores, coordination of gene expression with DNA replication, replication-associated gene dosage, and chromosome organization into macro-domains. Chromosomes were rearranged by large inversions. Changes in the compositional skew of replichores, in the coordination of gene expression with DNA replication or in the replication-associated gene dosage have only a moderate effect on cell physiology because large rearrangements inverting the orientation of several hundred genes inside a replichore are only slightly detrimental. By contrast, changing the balance between the two replication arms has a more drastic effect, and the recombinational rescue of replication forks is required for cell viability when one of the chromosome arms is less than half than the other one. Macrodomain organization also appears to be a major factor restricting chromosome plasticity, and two types of inverted configurations severely affect the cell cycle. First, the disruption of the Ter macrodomain with replication forks merging far from the normal replichore junction provoked chromosome segregation defects. The second major problematic configurations resulted from inversions between Ori and Right macrodomains, which perturb nucleoid distribution and early steps of cytokinesis. Consequences for the control of the bacterial cell cycle and for the evolution of bacterial chromosome configuration are discussed.
Citation: Esnault E, Valens M, Espe´li O, Boccard F (2007) Chromosome structuring limits genome plasticity inEscherichia coli.PLoS Genet 3(12): e226. doi:10.1371/journal. pgen.0030226
Introduction
Genomic analyses have revealed that bacterial genomes are dynamic entities that evolve through various processes, including intrachromosome genetic rearrangements, gene duplication, and gene loss or acquisition by lateral gene transfer [1]. Nevertheless, comparison of bacterial chromo-somes from related genera revealed a conservation of organization [2]. For example, the genetic maps of E. coli and Salmonella typhimurium that diverged from a common ancestor about 140 million years ago are extensively super-imposable [1]. Multiple forces seem to shape the organization of bacterial chromosomes, and the imprinting of these processes on the chromosome is evident at different levels.
DNA replication initiated at oriCproceeds bidirectionally until the two replication forks meet. Replication initiation and termination at defined loci result in guanine/cytosine skew between leading and lagging strands due to the mutational differences [3–5]. In wild-type (wt) cells, repli-cation arms coincide with the two compositional skewed halves of the chromosome, hence the name of replichore [6]. Initiation of replication occurs atoriC, the origin junction of replichores, and in most cases, the two replication forks are predicted to meet at the terminal junction of replichores where skew changes [7]. Biological processes may exploit these strand-biased sequences defining each replication arm as a target for selection pressure. Two examples of positive selection at the replichore scale have been well documented in bacteria; first, the octamer v sequence involved in the RecBCD-mediated recombination process is overrepresented 3.5 times in one orientation along each replichore [8]. Second, FtsK-Orientating-Polar-Sequences (KOPS) are over-represented on one DNA strand ([9], see below).
Beyond the replichore organization, processes affecting the genome organization at the gene level also shape chromo-some structures, and two different parameters might be affected: orientation of gene transcription relative to replication, and location of genes relative to the origin of replication. Since replication and transcription occur simul-taneously on the same DNA molecule, both head-on and co-oriented collisions are thought to occur in replicating bacteria. It has been originally proposed that highly ex-pressed genes are preferentially positioned on the leading strand to allow faster DNA replication and reduce transcript losses that occur during head-on collisions [10]. InE. coli, 54% of coding sequences are found on the leading strand, and as for most bacterial species, highly expressed genes such as rRNA operons (rDNA) and genes encoding ribosomal proteins are transcribed in the direction of replication. However, at least inE. coliandBacillus subtilis, essentiality, not expressiveness, selectively drives the gene-strand bias [11].
Editor:Ivan Matic, Universite´ Paris V, INSERM U571, France
ReceivedMay 22, 2007;AcceptedNovember 6, 2007;PublishedDecember 14, 2007
A previous version of this article appeared as an Early Online Release on November 6, 2007 (doi:10.1371/journal.pgen.0030226.eor).
Copyright:Ó2007 Esnault et al. This is an open-access article distributed under the terms of the Creative Commons Attribution License, which permits unrestricted use, distribution, and reproduction in any medium, provided the original author and source are credited.
Abbreviations: Inter, interreplichore inversion; Intra, intrareplichore inversion; KOPS, FtsK-Orientating-Polar-Sequences; MD, macrodomain; NS, nonstructured; wt, wild type
* To whom correspondence should be addressed. E-mail: boccard@cgm.cnrs-gif.fr
Another parameter thought to shape chromosome structure at the gene level involves the location of genes relative to the replication origin, and gene dosage effect may constrain this positioning. In fast-growing bacteria, the replication gene dosage effects are mainly associated with the elements of the translation and transcription machinery, i.e., rDNA, transfer DNA (tDNA), RNA polymerase, and ribosomal protein genes [12].
In bacteria, selection operates to maintain the two replichores of approximately equal length. In most cases, the size of the longest replichore corresponds to 50%–60% of the entire chromosome [13]. InE. coli, the constraint on the size of replication arms is ensured by the presence of ten Ter sites (TerA–J) scattered in two oppositely oriented groups in the terminal half of the chromosome ([14], Figure 1A). Each of the Ter sites binds Tus, the replication terminator protein, with a specific affinity. Each replication fork travels across the five Ter sites in the permissive orientation before it encounters a Ter site in the nonpermissive orientation and is blocked. The forks are thus trapped between oppositely oriented sites, defining a region called the replication fork trap. In conditions in which Tus blocks replication forks at ectopic Ter sites, creating a region impossible to replicate, the RecBCD pathway of homologous recombination and SOS induction are essential for viability [15–17]. The need for a high level of homologous recombination protein RecA and helicase UvrD accounts for the requirement of SOS induction for viability [18]. A detailed study has shown that forks blocked at Ter sites are stable; linear DNA molecules are formed upon arrival of a second round of replication forks and RecBCD-promoted recombination catalyzes the reincor-poration of the double-strand DNA (ds-DNA) ends made by replication run off [17]. UvrD was proposed to enable replication forks initiated at recombination intermediates to progress across the Ter–Tus barrier [18].
Microscopy observations have shown that circular bacterial
chromosomes are organized with a particular orientation within growing cells that preserves the linear order of loci on the DNA [19–23]. The E. coli chromosome consists of four structured macrodomains (MDs) and two nonstructured regions [24,25]. The Ori MD containing the origin of replication oriC is centered on migS, a centromere-like structure involved in bipolar positioning of oriC [26]. The Ori MD is flanked by two nonstructured (NS) regions called NSright and NSleft (Figure 1A). The Ter MD containing the replication fork trap is centered on the terminal replichore junction. The Ter MD is flanked by two MDs called the Right and Left MDs. The existence of the four MDs and two NS regions was deduced from genetic data showing that different MDs do not interact during cell growth, but interact with their adjacent NS regions [25]. Several important processes take place in the Ter MD. First, replication ends in the Ter Figure 1.Macrodomain Organization of theE. coliChromosome (A) Schematic representation of E. coli MDs and nonstructured (NS) regions. The circle represents the genetic map of the chromosome. Colored bars represent the different MDs (with their coordinates indicated in minutes), and interrupted black bars schematize the two NS regions. The ten Ter sites (from A to J), replication originoriC,migS, anddifsites are indicated.
(B) Integrative and excisive recombination promoted by IntþXis. In the presence of Int and Xis proteins, recombination betweenattL andattR sites generatesattB andattP sites. It recreates alacZcoding sequence allowing phenotypic detection of recombined fragments.
doi:10.1371/journal.pgen.0030226.g001
Author Summary
MD because of the presence of the replication fork trap. Second, the replichore junction diametrically opposed tooriC is the region of the change in compositional skew defining the two replichores [7]. The site-specific recombination sitedifis present near the replichore junction and allows the reso-lution of chromosome dimers into monomers; to be active,dif must be present in a zone of converging KOPS [9,27]. KOPS are recognized by FtsK which translocates the DNA direc-tionally in order to aligndifsites at the septum where XerCD can resolve chromosome dimers into monomers (for review, see [28,29]). Third, the Ter MD contains two Non-Divisible Zones (NDZ) refractory to inversions ([30], see below).
Genetic approaches have provided experimental evidence that some chromosome rearrangements are detrimental for growth or, in rare cases, refractory to inversions [30–37]. Using homologous recombination, intrareplichore inversions (Intra) of segments with one endpoint located in the 20%– 30% region flanking the terminal replichore junction, i.e., the periphery of the Ter MD, have been shown to be reproducibly highly problematic or prohibited in E. coli (for review, see [38]). However, these regions are not refractory to inversions by the site-specific recombination system used here [25,37]. Inversions that split the Ter MD are detrimental for growth and delay cell division [37].
In a previous study, we have generated strains with chromosomes carrying inverted segments using the k site-specific recombination system [25]. Interestingly, we noticed that strains carrying combinations of partnerattsites located in the same regions of the chromosome have similar phenotypes upon inversion, and many of the inversions seemed to affect cell physiology. The results reported here allow us to define extents and limits to plasticity in theE. coli chromosome. The analysis of detrimental rearrangements allowed the identification of two types of chromosome inversions that, by changing MD organization, severely affect the progression of the cell cycle.
Results/Discussion
A Genetic System to Change Chromosome Configuration
By using the site-specific recombination system of bacter-iophage k, we previously developed a genetic system that allows the construction and detection of genetic inversions in the E. coli chromosome [25]. We have constructed several series of strains containing one defined att site at a fixed position and itsattpartner site inserted at random locations; strains carrying combinations of partnerattsites that could give rise to viable recombinants have been selected. Cassettes were designed to detect inversion betweenattsites: recombi-nation betweenattL and attR restoreslacZ integrity (Figure 1B). By providing a limiting amount of recombinase, we were able to reveal the existence of MDs that correspond to large regions that are insulated from each other in the cell (Figure 1A). By providing a high amount of recombinase, recombi-nation between most of the combirecombi-nations ofattsites can be detected, and there is a good correlation between the frequency of collisions and the frequency of recombinants [25]. There was no correlation between the frequency of inversion and the physiological properties of cells with inverted configuration; inversions occurring at high fre-quency can be detrimental, whereas those occurring at low frequency can be neutral (see below). We now analyze in
detail the properties of strains carrying chromosomes with the different inverted configurations.
To unravel the consequences of inverting a chromosomal segment on cell physiology, we performed a number of analyses aimed at detecting defects visible at the colony or cell level. The size of colonies from strains with the inverted chromosome (lacZreconstituted, blue colonies) was compared to that of strains with the wt configuration (white colonies) in rich medium. The effect of these inversions on growth was also measured using a coculture assay in which strains with chromosomes in wt and inverted configurations were compared (Materials and Methods). To analyze the conse-quences of the inversion on the nucleoid morphology, cells grown in exponential phase were stained with DAPI, and nucleoids were observed by fluorescence microscopy (see Materials and Methods). The percentages of cells with different types of nucleoids were numbered according to the cell size. The number of chromosome origins was estimated by fluorescence-activated cell sorting (FACS) analysis. Viability of strains was tested in different genetic backgrounds affected in pathways related to DNA metabo-lism. We used recA mutants and since RecA is required for both homologous recombination and SOS induction, the requirement of SOS induction for viability was tested inlexA ind
(SOS
Recþ
) andrecA lexAdef(SOSþ
Rec
) mutants. When RecA was required, we used mutants affected in the two RecA-dependent recombination pathways, i.e., RecBC and RecFOR, to identify the pathway involved. Measurements of SOS induction were performed in asfiAbackground to avoid SfiA-dependent filamentation and inhibition of cell division [39]. SOS induction was quantified in culture by using a plasmid carrying the uidA gene encoding b-glucoronidase under the control of the PsfiA promoter (see Materials and Methods). In addition, the presence of a plasmid carrying a gfpgene under the control of the PSfiApromoter allowed the direct visualization of the induction of the SOS response at the cellular level. tus mutants were used to estimate the defects provoked by inverted Ter sites in various config-urations. When recombinant colonies could not be obtained, PCR reactions probing the presence of recombination at the DNA level were used to check for the occurrence ofattL–attR inversion and for the presumed lethality conferred by the inversion.
Ter Sites Impede Replication Forks with Various Efficiencies
analyzed (Figures S1 and S2, and Text S1). Altogether, the results indicate that efficiency of replication arrest at differ-ent chromosomal Ter sites correlates with the predictions based on in vitro affinities and on replication arrest activity of TerB mutant sites. They show that in conditions of wt level of Tus protein, blocking the two forks by the strong TerE and TerA sites renders RecBCD-dependent recombination essen-tial for viability, as previously observed with TerA [15]. SOS induction is also essential in these conditions. The effect of the moderate site TerH in the inverted orientation was less severe, but still significant. Inverted weak TerI and TerJ sites do not appear to affect growth, suggesting they do not significantly impede replication (Figure S1 and Text S1).
Imbalance of Replication Arms Renders RecBC Essential for Growth
On the E. coli chromosome, the two replichores are of similar size, suggesting that most replication forks meet
within the replication fork trap diametrically opposite to the origin. To evaluate the requirements for the balance of replication arms, we analyzed strains in which inversion endpoints are in each replication arm, asymmetrically relative tooriC(interreplichore inversion [Inter], Figure 2A, Table 1). As the inverted region contains oriC, these inversions do not change the orientation of sequences or genes relative to replication. However, because the two endpoints are at different distances from oriC, the size of the replication arms are modified, one becoming greater and one smaller than 50% of the chromosome. Imbalance of 5%– 10% for replication arms has no effect on colony morphol-ogy: the colonies with inverted configurations are similar to those with wt configuration (Figure 2B, 47% for the short arm and 53% for the long arm (47–53) in strain Inter R-L3 (Table 1), and 42–58 in strain Inter R-L5 (Table 1)). The effect of these inversions on growth was also measured using the Figure 2.Imbalance of Replication Arms
(A) Schematic representation of theE. colichromosome after interreplichore inversion leading to a 20% imbalance (replication arms are 30% and 70% of the total length of the chromosome). The two replication arms are indicated by red arrows, and the replication fork trap is indicated in yellow. The ten Ter sites (from A to J), replication originoriC, anddifsite are indicated.
(B) Colonies of strains carrying chromosomes with various levels of imbalance as indicated (47–53: strain Inter R-L3; 42–58: strain Inter R-L5; 36–64: strain Inter R-NSleft1; 30–70: strain Inter R-NSleft2; 23–77: strain Inter R-NSleft4; and 18–82: strain Inter R-O1). Colonies were obtained in a wt,recA, orrecA tus genetic background.
(C) Quantification of the growth defects caused by replication arms imbalance. Strains carrying a chromosome with 3% (47–53), 14% (36–64), or 20% (30–70) of replication arms imbalance described in (B) were grown in serial cocultures with the strain carrying the wt configuration. The ratio of inverted to wt configurations is plotted as a function of the number of generations.
(D) Comparison of microscopic analyses of strains carrying a chromosome with 14% (36–64) or 32% (18–82) of replication arms imbalance described in (B). Colored horizontal bars indicate the percentage of the different types of cells and nucleoids in the wt (noninverted; left) and inverted (right) configurations. Green indicates cells containing one and two nucleoids (1þ2 nuc); yellow: cells containing four nucleoids (4 nuc); cyan: cells containing par-like nucleoids (par); red: cells with unsegregated nucleoid (CUN); and pink: anucleate (anuc).
coculture assay containing strains with either a chromosome in wt or inverted configuration: no defect was associated to this genetic rearrangement as the ratio of inverted to wt cells was close to one after 60 generations (Figure 2C and unpublished data). The cells and nucleoids of strains with either configuration were not distinguishable (Figure S3). When the imbalance reached 15% (36–64 in Figure 2B, strain Inter R-NSleft1 in Table 1), some defects became apparent. The recombinant colonies were smaller than noninverted colonies, and the ratio of inverted to wt cells after 60 generations was affected (0.13 6 0.02), but the cells and nucleoids of the inverted configuration were similar to those of the wt configuration: only 2% of the cells appeared abnormal (Figure 2D). Around 20% of imbalance (30–70 in Figure 2B, strain Inter R-NSleft2), the size of colonies carrying the inversion was affected; in coculture assays, the ratio of
cells with inversion to wt configuration was less than 0.01 (Figure 2C) and microscopic observation showed longer cells with abnormal nucleoids (14% of abnormal cells in Inter R-NSleft2, Figure S3). Above 20% of imbalance (23–77 and 18– 82 in Figure 2B, strains Inter R-NSleft4 and Inter R-O1, respectively, in Table 1), colonies were barely visible, and more than 20% of cells displayed condensed nucleoids, i.e., a par phenotype, or grew as cells with unsegregated nucleoids (Figure 2D and Figure S3, respectively).
Interestingly, we noticed that all strains with an imbalance greater than 20%, i.e., with a replication arm smaller than 30% and the other larger than 70%, were dependent on RecA for viability (Figure 2B and Table 1). Recombinant colonies could be obtained in a recFOR background, but not in conditions inhibiting either RecBC DNA recombination or SOS induction, indicating that the RecBC homologous Table 1.Strains with Rearrangements Generating Inverted Ter Sites, Imposing Imbalance of Replication Arms, and Affecting Gene Orientation
Affected Parameter Namea Inversion
Coordinatesb
Inverted Terc/
Asymmetryd
RecA Dependencee
(Suppressor)f
SOS Inductiong
Inverted Ter sites Intra R1 R17.3–L26.4 TerEc recBC (Tus) 5.7
Intra R2 R17.3–L23.6 TerEc þ —
Intra R-NSright1 R17.3–L8.8 TerHIc —
Intra R-NSright2 R17.3–L7.1 TerHIc —
Intra R-NSright3 R17.3–L6.8 TerHIc 2.7
Intra R-NSright4 R17.3–L5.4 TerHIc —
Intra R-NSright3DTerH R17.3–L6.8 TerIc —
Intra R-NSright3DTerHI R17.3–L6.8 — —
Intra L-NSleft1 R53.2–L74.4 TerJc —
Replication arms imbalance Inter R-L1 R17.3–L48.3 48–52d 0.8
Inter R-L2 R17.3–L53.4 48–52d 1
Inter NSleft-O1 L70.0–R1.2 48–52d —
Inter R-L3 R17.3–L55.4 47–53d 1
Inter R-L4 R17.3–L45.5 44–56d —
Inter NSright-NSleft1 L7.1–R70.2 42–58d —
Inter NSright-NSleft2 R6.5– L70.0 42–58d —
Inter R-T1 R17.3–L38.4 42–58d 0.9
Inter R-L5 R17.3–L60.4 42–58d —
Inter R-T2 R17.3–L35.1 39–61d —
Inter R-T3 B17.3–P34.3 38–62d —
Inter R-T4 R17.3–L34.2 38–62d —
Inter L-T1 L29.7–R53.2 36–64d —
Inter R-NSleft1 R17.3–L65.6 36–64d 1.7
Inter NSright-NSleft3 R12.9–70.0 36–64d —
Inter L-T2 L29.7–R58.9 30–70d þ —
Inter R-NSleft2 R17.3–L70.8 30–70d recBC (Tus) 1.9
Inter T-NSright1 R6.3 –L35.1 28–72d þ —
Inter T-NSleft1 L29.7–R64.5 25–75d þ —
Inter R-NSleft4 R17.3–L79.0 23–77d recBC (Tus) 3.4
Inter R-O1 R17.3–L82.7 18–82d recBC (Tus) 4.0
Inversion inside replicore Intra O-NSright1 L86.7–R6.5 — —
Intra O-NSright2 R87.1–L7.1 — —
Intra O-NSright3 R92.7–L7.1 — —
Intra L-NSleft1 R53.2–L74.4 TerJc —
Intra O-NSright4 L87.6–R12.3 — ND —
a
The name of the strain is given according to the type of inversion (Intra¼intrareplicore; and Inter¼interreplichore) and to the macrodomains affected (L:Left; NSleft
; NSright
; O: Ori; R: Right; and T: Ter). Strains Inter R-T3 containsattB andattP instead ofattL andattR.
b
Indicates in minutes the position ofattsites.
c
The inverted Ter site, if any, is indicated.
d
Indicates the amount of replication arms imbalance.
e
A plus sign (þ) indicates the RecA dependence for viability of the inverted configuration; a minus sign () indicates lack of dependence; and RecB indicates both RecBC and RecA dependence for viability. ND: not determined.
f
(Tus) indicates that the dependence to RecA for viability is suppressed by atusmutation.
g
recombination pathway is required for viability in the presence of an imbalance of replication arms greater than 20% (Table 1). The dependence on RecA for viability was suppressed by atusdeletion, indicating that the impediment of replication forks by Tus at Ter sites is responsible for lethality in arecAbackground (Figure 2B). Finally, a 2- to 4-fold SOS induction was apparent in strains that requiredrecA for viability (Table 1). The analysis performed with inverted Ter sites indicated that in cells expressing wt levels of Tus, the replication forks are stopped at the first strong Ter site in the nonpermissive orientation ([15] and Text S1). It implies that, when the imbalance is smaller than 20%, the two forks of a same replication round can progress to the replication fork trap. In contrast, RecBC-dependent recombination is soli-cited to restart the first fork that reaches a Ter site before the other fork can reach it when the imbalance of replication arms is larger than 20%. We propose that, in the conditions
used, when the shorter replication arm is less than half the longer one, it is fully replicated twice before completion of replication of the longer arm, leading to the formation of DNA double-stranded ends. These double-stranded ends induce the SOS response and are lethal in the absence of RecARecBC-dependent homologous recombination. Many natural inversions in bacterial genomes are symmetrical with respect to replication origins and termini. Scatter plots of the conserved sequences between related species produce an X-shaped pattern, called X-alignment [2]. These rearrangements reveal that selection operates to maintain replichores of similar lengths; in most genomes, the size of the longest predicted replication arm does not exceed 60% of the chromosome [13]. By moving the position of the replication fork trap on the genetic map, we have been able to analyze the effect of varying the imbalance of replication arms. Remarkably, we did not observe negative effects when the imbalance was around 10%, in total agreement with the observed size distribution of replichores in different species. Some defects appeared when the imbalance reached 15%, and recombinational rescue of replication forks was required above 20%.
The analysis of interreplichore inversions affecting at the same time two MDs revealed that making hybrid MDs while keeping the wt replichore junction unaffected was well tolerated (Figure S3). We noticed that for similar levels of imbalance less than 20%, inversions involving endpoints located either in the NS regions or in the Left, Right, and Ter MDs (Figure S3 and Table 1) behave similarly: the growth of recombinant colonies was slightly affected, and recombinants were viable in arecAbackground (Table 1). It is only when the imbalance exceeded 20% that recombinant colonies were affected and their formation recA-dependent (Table 1). Altogether, these results suggest that in the context of interreplichore inversions, the effect of MD disorganization for the Left, Right, and Ter MDs can be well tolerated by the cell.
Large Intrareplichore Inversions between NS Regions and MD Are Not Detrimental for Growth
We noticed that large inversions inside a replichore (intrareplichore) with one endpoint in the Ori MD and the other in the NSrightregion gave rise to recombinants with no strong defects. Three examples of strains with such rear-rangements are shown in Figure 3. These inversions encompass 916, 927, and 668 kb corresponding to 826, 828, and 607 genes, including four, three, and one rDNA operons, respectively (Figure 3A, strains Intra O-NSright1 to3 in Table 1). Similar outcomes were obtained in the left replichore. For example, the inversion of a 982-kb–long segment that changes the orientation of 942 genes, including two rDNA operons and 34 ribosomal protein genes (strain Intra L-NSleft1 in Table 1) had no detectable detrimental effects (Figure 3B and unpublished data). The colonies of strains with the rear-ranged chromosome had the same size as those with the wt configuration (Figure 3B). The diagram shown in Figure 3C indicates that even the largest inversion has no detectable effect on nucleoid morphology. No strong defect was associated with these genetic rearrangements, because the ratio of inverted to wt configuration was above 0.75 after 60 generations in coculture assays (Figure 3D). Finally, colonies carrying these inverted configurations were viable in arecA Figure 3.Tolerance to Large Inversions within a Replichore
(A) Schematic representation of theE. coli chromosome showing the MDs (Ori in green, Right in red, Left in blue, and Ter in cyan), the seven
rrn operons (rrsA torrsH), replication originoriC, migS, and dif. The numbered black arcs indicate the position and extent of fragments inverted in the strains 1 to 4 (1: intra O-NSright1; 2: intra O-NSright2; 3: intra O-NSright3; and 4: intra O-NSleft1).
(B) Colonies of strains 1 to 4 carrying normal and inverted configurations. Colonies were obtained in a wt orrecAgenetic background.
(C) Comparison of microscopic analyses of cells from strain 1 in wt (noninverted) and inverted configurations as described in Figure 2. (D) Quantification of the growth defects caused by intrareplichore NSright–Ori inversions. Strains 1 to 3 carrying the inverted configuration were grown in serial cocultures with the strain carrying the wt configuration. The ratio of inverted to wt configurations is plotted as a function of the number of generations.
background, indicating the absence of important DNA damage (Figure 3B). Altogether, these results indicate that the direction of replication can be inverted through hundred of genes, including rDNA genes, without important con-sequences for growth. Furthermore, the results show that inversions between Ori MD and the NS regions are well tolerated. Similar conclusions were obtained from the analyses of intrareplichore inversions between NS regions and the flanking Right or Left MD in the absence of active Ter sites (Figure S4 and Table 1). Therefore, gene orientation, gene dosage, and sequence skews appear to operate only as long-term positive selection determinants. Our results are in agreement with the evidence [11,40] that weakens the proposed influence of replication on gene orientation [41,42]. However, given the large size of bacterial populations, slightly deleterious effects that can be accredited to position-ing rDNA and ribosomal protein genes on the laggposition-ing strand are most likely sufficient to eliminate such configurations from the population in long-term evolution.
In contrast to well-tolerated inversions described above, two types of intrareplichore inversions were highly detri-mental for the cell: the first type involved endpoints located in the Ter and the Right MDs, and provokes the separation of the replication fork trap from the wt replichore junction. The second type involved inversion between endpoints located in the Ori MD and in the Right MD. Features of these two detrimental configurations are described in detail below.
Intrareplichore Inversions That Disrupt the Ter Macrodomain Are Deleterious
Intrareplichore inversions with endpoints in the Right and Ter MDs (Figure 4A, strains Intra R-T1 to3 in Table 2) generate a hybrid Right-Ter MD in which the orientation of TerA, TerD, and TerE is modified, creating a replication arms imbalance close to 35%–65% (see intra R-T1 in Figure 4B). These strains carry two zones of converging KOPS (Figure 4C): the normal one corresponding to the wt replichore junction, and a new one associated with the replication fork trap in the hybrid Right-Ter MD. Inversion severely affected the growth of colonies (Figure 4D). The observation of cells with the inverted configuration revealed the occurrence of a high proportion of abnormal cells: 27% of cells showed a par phenotype, 15% formed cells with unsegregated DNA, and 1% of cells were anucleate (strain Intra R-T1 in Figures 4E, 4F, and S5). Cells larger than 10lm with a high amount of nonsegregated nucleoids were observed. FACS analyses indicated that the number of chromosomes in the large cells ranged from 16 to 32 (unpublished data). Other strains with intrareplichore inversions between Right and Ter MDs (Intra R-T2 and 3 in Figure 4 and Table 2) showed the same features (unpublished data).
The origin of the detrimental phenotypes caused by this chromosomal configuration was analyzed by testing different genetic backgrounds (Figure 4G). It was not possible to obtain viable recombinants in alexA ind
background, i.e., in SOS-defective conditions. SOS induction was directly visualized by the use of a plasmid expressinggfpunder the control of PSfiA promoter (Figures 4F and S5). Homologous recombination was also required because recombinants with the inverted configuration could not be obtained in arecA, recBC, or in a recA lexAdefbackground (i.e., in conditions of constitutive SOS
induction, but in the absence of RecA-dependent recombi-nation).
The phenotype and RecA-independence of interreplichore Right-Ter inversions (Figure S3, strains Inter R-T1 to4 in Table 1) suggests that intermingling Right and Ter MDs cannot by itself be responsible for the growth defects of strains Intra R-T1 to3 in the inverted configuration. Growth defects and RecA dependence for viability were suppressed in atusbackground, indicating that the position of the displaced replication fork trap is responsible for the growth defects (Figure S5E). The detrimental effects can not originate only from imbalance of replication arms because the imbalance of replication arms is close to 35–65, a level that does not render RecA essential for viability in interreplichore inversions (Figure 2 and Table 1). Three other hypotheses that might account for the growth defects were tested below: the positioning of dif outside of the replication fork trap, the presence of two zones of converging KOPS, and the merging of replication forks far away from the wt replichore junction region.
In these intrareplichore Right-Ter inversions, the repli-cation fork trap is separated from dif. It was previously reported that thedifsite does not need to be present in the replication fork trap to be fully active because the insertion of a ectopic TerA* site near TerA, moving the replication fork trap away from thedifregion, did not affectdifactivity [43].difis active in any new replichore junction formed after inversion [9,27]. After deletion ofdiffrom its normal position, we reinserted a 28-bp fragment corresponding to difin the new replication fork trap, in the region where KOPS converge, far away from the wt replichore junction (Figure 4C, strain Intra R-T2Ddif difRFTin Table 2). Strains carrying this inverted configuration still showed strong detrimental defects and were not obtained in arecAbackground (Table 2) even though insertion ofdifin the new replication fork trap improved nucleoid distribution in a way suggesting dif activity, i.e., by removing a 12%–15% fraction of filaments (47% of abnormal cells instead of 64% in the absence ofdif, and 50% when dif is present at its normal location; unpublished data). These results indicate that the absence ofdiffrom the new replication fork trap is not responsible for the observed defects. These results were corroborated by the viability of Inter Right-Ter inversions in a recA background when dif was deleted (strain Inter R-T2 Ddif in Table 2), confirming that the RecA dependence for viability of Intra Right-Ter inversions does not result from the lack ofdifin the replication fork trap.
To determine whether merging of replication forks outside the Ter MD may be responsible for the detrimental effects of intrareplichore Right-Ter inversions, we generated two different genetic inversions in the Right MD (strain Intra R3 in Figure 4C, and strains Intra R3 and Intra R4 in Table 2) that inverted TerE in a strain in which TerA and TerD are deleted; inversion of the TerE region provoked replication to end in the Right MD, and generated two zones of converging KOPS (Figure 4C) and an imbalance of replication arms close to 35–65 (Table 2). Recombinant colonies were slightly affected compared to those with a wt configuration (Figure
4D); cells and nucleoids from both configurations were similar (unpublished data), and recombinants were viable in a recA background (Figure 4D). These results indicate that replication forks can merge in the Right MD without affecting viability.
Because none of the simple modifications in the chromo-some structure can, by itself, account for the growth defect of intrareplichore Right-Ter inversions, we tested whether the defect was dependent on the length of the Right MD that separates the replication fork trap from the wt replichore junction in the Intra R-T1 configuration. We constructed strain Figure 4.Intrareplichore Inversions between the Right and Ter MDs
(A) Schematic representation of theE. colichromosome showing the MDs (Ori in green, Right in red, Left in blue, and Ter in cyan), the ten Ter sites (from A to J),oriC, anddif. The numbered red arcs indicate the position and extent of fragments inverted in the strains Intra R-T1 to3 (1 to 3, respectively), and the pink arc (number 4) shows the fragment inverted in the Inter R-T2 strain.
(B) Schematic representation of theE. colichromosome upon an intrareplichore inversion that causes the intermingling of Right and Ter MDs (strain Intra R-T1). The MDs are colored as in Figure 1, and the replication fork trap is indicated in yellow. The different Ter sites,oriC, anddifare indicated. (C) Linear genetic maps of the Right and Ter MDs upon various intrareplichore inversions. The inverted Ter site defining the displaced replication fork trap is shown, and the replication fork trap is indicated in yellow. Thedifsite is indicated by a small stick, and the wt replichore junction by a grey box. Inverted KOPS are indicated by rafters (1 for 100 kb). Viability in arecAbackground is indicated by a plus sign (þ) beside the map.
(D) Colonies of strains carrying chromosomes with various intrareplichore inversions as indicated in (C). Colonies were obtained in a wt orrecAgenetic background.
(E) Microscopic analysis of strain Intra R-T1 as described in Figure 2.
(F) Cells from strain Intra R-T1 with an inverted configuration were transformed with a plasmid expressinggfpunder the PsfiApromoter. Nucleoids of cells expressing SOS appear as blue (see Figure S3 for unmerged pictures).
(G) Pathways required for viability of the inverted configuration. Genetic backgrounds in which inverted configuration did not give rise to viable colonies are indicated in red.
doi:10.1371/journal.pgen.0030226.g004
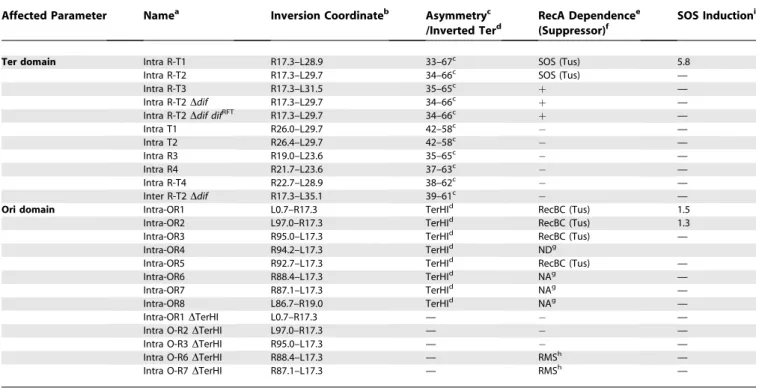
Table 2.Strains with Rearrangements Making Hybrid Right–Ter MDs and Ori–Right MDs
Affected Parameter Namea Inversion Coordinateb Asymmetryc
/Inverted Terd
RecA Dependencee (Suppressor)f
SOS Inductioni
Ter domain Intra R-T1 R17.3–L28.9 33–67c SOS (Tus) 5.8
Intra R-T2 R17.3–L29.7 34–66c SOS (Tus) —
Intra R-T3 R17.3–L31.5 35–65c þ —
Intra R-T2Ddif R17.3–L29.7 34–66c þ —
Intra R-T2Ddif difRFT R17.3–L29.7 34–66c þ —
Intra T1 R26.0–L29.7 42–58c —
Intra T2 R26.4–L29.7 42–58c —
Intra R3 R19.0–L23.6 35–65c —
Intra R4 R21.7–L23.6 37–63c —
Intra R-T4 R22.7–L28.9 38–62c —
Inter R-T2Ddif R17.3–L35.1 39–61c —
Ori domain Intra-OR1 L0.7–R17.3 TerHId RecBC (Tus) 1.5
Intra-OR2 L97.0–R17.3 TerHId RecBC (Tus) 1.3
Intra-OR3 R95.0–L17.3 TerHId RecBC (Tus) —
Intra-OR4 R94.2–L17.3 TerHId NDg
Intra-OR5 R92.7–L17.3 TerHId RecBC (Tus) —
Intra-OR6 R88.4–L17.3 TerHId NAg —
Intra-OR7 R87.1–L17.3 TerHId NAg —
Intra-OR8 L86.7–R19.0 TerHId NAg —
Intra-OR1DTerHI L0.7–R17.3 — —
Intra O-R2DTerHI L97.0–R17.3 — —
Intra O-R3DTerHI R95.0–L17.3 — —
Intra O-R6DTerHI R88.4–L17.3 — RMSh —
Intra O-R7DTerHI R87.1–L17.3 — RMSh —
a
The name of the strain is given according to the type of inversion (intra¼intrareplicore ; inter¼interreplichore) and to the macrodomains affected (L: Left; NSl: NSleft, NSr: NSright; O: Ori; R: Right; and T: Ter).
b
Indicates in minutes the position ofattsites.
c
Indicates the amount of replication arms imbalance or the inverted Ter site if any.
d
The inverted Ter site, if any, is indicated.
eA plus sign (þ) indicates the RecA dependence for viability of the inverted configuration; a minus sign () indicates lack of dependence; and RecBC indicates both RecBC and RecA
dependence for viability.
f
(Tus) indicates that the dependence to RecA is suppressed by atusmutation.
g
NA: not applicable; ND: not determined
h
RMS indicates rich medium sensitivity.
i
Intra R-T4 (Figure 4C and Table 2). In this strain, the chromosome configuration is similar to Intra T1, Intra R-T2 and Intra R-T3 configurations, but the extent of sequences belonging to the Right MD that are embedded in the Ter MD is reduced (170 kb compared to 420 kb). Recombinants showed fewer defects; only a fraction of cells (13%) showed a par phenotype, and less than 1% formed cells with unsegregated nucleoids (Figure S6). Importantly, strains in the inverted configuration were viable in a recAbackground (Figure 4D). These results are in agreement with the hypothesis that the extent of Right MD DNA that separates the Ter region where fork merge from the replichore junction region is responsible for the observed defects. The combination of the embedding of Ter sequences in the Right MD and finishing replication within these Ter sequences is responsible for the deleterious effect. The shortening of the region of Right MD that separate the replication fork trap from the wt replichore junction region suppresses the defects. Together with the observed viability of recA-interreplichore inversions involving the Right and the Ter MDs (strains Inter R-T1 and R-T2 in Figure S3 and Table 1), these observations support the hypothesis that the requirement of RecA for the viability of intrareplichore Right-Ter inversions results from the separation of the replichore junction region from the region in the Ter MD where replication ends. It is therefore tempting to speculate that in deleterious configu-rations resulting from intrareplichore inversion, replication ends in the displaced part of the Ter MD, activities normally associated to the wt replichore junction region cannot be performed, and the cell cycle is affected. Altogether, these results suggest the existence of a tight temporal and/or spatial coupling between the end of DNA replication in the Ter MD and an unknown activity near the replichore junction region required to progress in the cell cycle. Further work will be required to determine whether proteins known to function near the terminal replichore junction, FtsK [44] and TopoIV [45], are involved in this coupling.
Intrareplichore Inversion That Intermingle Ori and Right MDs Are Detrimental
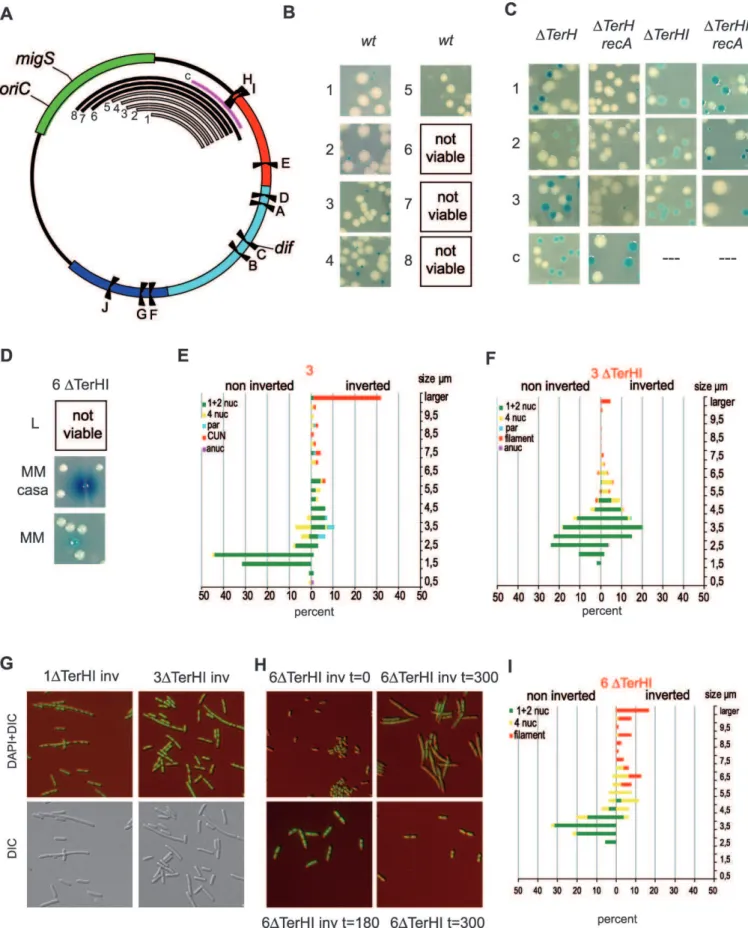
The second class of detrimental inversions corresponds to intrareplichore inversions that combine Ori MD with the Left or Right MD. Because most of the inversions between the Left and Ori MDs also induce a high imbalance of replication arms, we focused our study on the inversion between Ori and Right MDs. The detrimental effects of intermingling Ori and Right MDs were revealed by combiningattL and attR sites inserted at various positions in the Right (149, 179, 199, and 229) and Ori (0.79, 979, 959, 949, 929, 889, 879, and 869) MDs (Figure 5A, Table 2, and unpublished data). Viable recombi-nants could be obtained only when the inversion involved sites located between 929and 0.79in the Ori MD, and they all showed strong growth defects (proximal Ori–Right combina-tions, strains Intra O-R1 to5 in Figure 5A [indicated in grey] and 5B). In contrast, viable recombinants could not be obtained when the inverted fragment extended from the Right MD to 889, 879, or 869(distal Ori-Right combinations, strains Intra O-R6 to8 indicated in black in Figure 5A). Proximal inversions invert the TerHI sites as inversions between Right MD and NSrightregion (control c in Figure 5A, Intra R-NSright3 in Table 1), whereas distal inversions invert both TerHI sites and the centromere-like sequence migS found at 899. migS did not seem to be responsible for the
difference observed between the two types of combinations since distal combinations did not give rise to viable recombinants in the absence of migS(unpublished data). In the absence of both TerH and TerI (DTerHI in Figure 5C), viable recombinant colonies with no strong growth defects could be obtained for proximal inversions, and they are viable in arecAbackground (strains Intra O-R1 to3 in Figure 5C and Text S1). Distal inversions remained lethal on rich medium when both TerH and TerI were deleted (Figure 5D and unpublished data, and strains Intra O-R6 to8 in Table 2), but viable colonies could be obtained on minimal growth medium (Figure 5D). These recombinants showed growth defects in minimal medium supplemented with casamino-acids (Figure 5D) and could not be propagated in rich medium (unpublished data).
The proximal Ori–Right inversions that gave rise to viable colonies were used for microscopy analysis (strains Intra O-R1 to3 in Table 2). In the presence of TerH and TerI, we observed a predominant filamentation with DNA accumulat-ing in nonsegregated nucleoids (e.g., 39% of filaments and 10% of par-like cells in the inverted configuration of Intra O-R3 in Figure 5E, and unpublished data). Analysis of the nucleoids of recombinant colonies deleted for TerH and TerI revealed a high percentage of normal cells. However, in the inverted configurations, a significant proportion of cells formed filaments (5%, 9%, and 22%, according to the strain, Figure 5F and 5G, and unpublished data). Remarkably, these filaments were different from those observed in all other rearrangements described in this study; they showed appa-rently segregated nucleoids with no division septa between DNA bodies (Figure 5G).
Figure 5.Intrareplichore Inversions between the Right and Ori MDs
(A) Schematic representation of theE. colichromosome showing MDs, Ter sites,oriC,migS, anddif. The numbered black arcs indicate the position and extent of fragments inverted in strains 1 to 8 and (1 to 8: intra O-R1 to8 in Table 2), and the control strain c is indicated in pink (control Intra R-NSright3 in Table 1).
role. We would like to speculate that mixing Ori and Right MD sequences would perturb proper segregation of Ori and Right MD, a step necessary to establish septum division. Further experiments will be necessary to determine whether the perturbation of the spatial control of cytokinesis affected by this type of inversion involves SfiA [39], MinCDE [47], SlmA [48], or other unidentified proteins.
Altogether, the results reported here give an important insight into the role of MDs in cell cycle control by chromosome configuration inE. coli(Figure 6). The Ter MD is involved in a process that spatially and/or temporally
couples the end of replication in the Ter MD with a subsequent step near the replichore junction region. The antagonistic Ori and Right MDs are involved in a process coupling chromosome segregation and cytokinesis. Identifi-cation of determinants or factors that specify MDs should help us understand how MDs are involved in the control of these processes.
Materials and Methods
Bacterial strains.E. coliK12 strains are all derivatives of MG1655. Standard transformation and transduction procedures used were as described before [25]. Plasmids and strains with relevant genotypes are described in Table S1.
Induction. Conditions for inversion formation were as described previously [25].
Detection and measurement of the SOS response.SOS response was quantified by measuring the amount ofb-glucoronidase [49] in sfiAcells transformed by a pBAD18-derived plasmid carrying theuidA gene fused to thesfiApromoter. Similar results were obtained in a sfiAþ
background, but results were less variable in asfiAbackground. SOS induction was visualized by using cells transformed by a P15A derivative carryinggfpunder the control of thesfiApromoter (pZA-PsfiA-gfp).
Microscopy and flow cytometry analyses.The cultures were grown to optical density (OD) 0.2 at 308C and then processed for microscopy or flow cytometry. For the microscopy analysis, the cells were processed as described before [45]. For flow cytometry analysis, chromosome numbering was estimated by counting the number of replication origins using a rifampicin/cephalexin replication run-out [50]; aliquots were taken every 10 min over a period of 200 min. Cells were fixed in a 75% ethanol–PBS 13solution, then washed in PBS 13, treated with RNaseA, and the DNA was then stained with propidium iodide. The cells were analyzed on a Partec PASIII flow cytometer.
Coculture assay.Strains carrying the inverted configurations were grown in coculture with the same strain carrying the wt config-uration. A 1:1 mixture of the two strains was grown in serial cultures in LB medium at 308C for up to 70 generations. Every 10 generations, the relative numbers of both configurations were determined by plating. Experiments were performed in triplicate.
Supporting information
Figure S1.Inversion of Strong and Weak Ter Sites
(A) Schematic representation of the E. coli chromosome after the inversion of the strong TerE site. The ten Ter sites (from A to J), the replication originoriC, anddifsites are indicated. The two replication arms are indicated by red arrows, and the regions of replication fork blockage by yellow squares.
(B) Colonies of strains carrying TerE, TerHI, TerI, or TerJ in normal (white) or inverted (blue) orientation. Colonies were obtained in a wt, recA, ortusgenetic background, or after deletion of the indicated Ter in rich medium. Colonies carrying the inverted configuration of strains 1 to 5 can be obtained in rich medium (indicated by a grey arc), whereas colonies carrying the inverted configuration of strains 6 to 8 cannot be obtained (indicated by a black arc).
(C) Colonies of strains 1 to 3, in the absence of TerH or TerH and TerI, carrying the chromosome in the wt or inverted configurations. Colonies were obtained in a wt or in arecAbackground. Also shown are the results obtained after deletion of the TerH site from strain c in a wt orrecAgenetic background. (D) Colonies of strain 6 deleted for TerH and TerI, in the wt or inverted configuration, obtained in minimal medium (MM) or minimal medium supplemented with casamino-acids (MM casa).
(E) Microscopic analysis of strain 3 carrying a chromosome in the wt (noninverted) and inverted configurations as described in Figure 2.
(F) Nucleoid and cell analysis obtained from strain 3 deleted for TerH and TerI, carrying a chromosome in the wt or inverted configuration. The left and right colored horizontal bars indicate the percentage of the different types of cells and nucleoids in the wt and inverted configurations, respectively (green indicates cells containing one and two nucleoids; yellow: cells containing four nucleoids; cyan: cells containing par-like nucleoids; red: filamentous cells with apparently segregated nucleoids; and pink: anucleate cells).
(G) Images of combined DIC-DAPI and DIC-stained cells from strains 1 and 3 deleted for TerH and TerI, in the inverted configurations, showing the presence of filamentous cells with segregated nucleoids.
(H) Combined images of DIC and DAPI pictures of cells from strain 6 deleted for TerH and TerI, in the inverted (inv) or wt configuration after growth in rich medium for 0, 180, or 300 min.
(I) Nucleoid and cell analysis obtained from strain 3 deleted for TerH and TerI, carrying a chromosome in the wt or inverted configuration, after 300 min of growth in rich medium. The left and right colored horizontal bars indicate the percentage of the different types of cells and nucleoids in the wt and inverted configurations, respectively (green indicates cells containing one and two nucleoids; yellow: cells containing four nucleoids; and red: filamentous cells with un-segregated nucleoids).
doi:10.1371/journal.pgen.0030226.g005
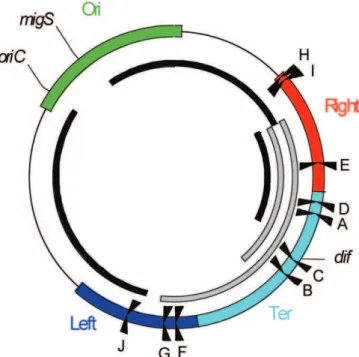
Figure 6.Detrimental Inversions inE. coli
Schematic representation of theE. colichromosome showing MDs, Ter sites,oriC,migS, anddif. The black arcs indicate the position and extent of fragments for which inversion is detrimental for growth. Grey arcs indicate inversions between Right and Ter or Right and Left MDs that are tolerated. Well-tolerated intrareplichore inversions between NSrightand adjacent MDs are not indicated. The analysis of detrimental and nondetrimental inversions supports a model in which the Ter MD is involved in a process that couples the end of replication in the Ter MD with a subsequent step. Inversion between Ori and Right MDs results in the perturbation of a process controlling chromosome segregation and cytokinesis.
site (TerE: strain Intra R1; TerHI: strain Intra R-NSright3; TerI: strain Intra R-NSright3DTerH; and TerJ: strain Intra L-NSleft1).
(C) Quantification of the growth defects caused by TerHI inversion. Strain Intra R-NSright 3 (Table 1) carrying the inverted TerHI was grown in serial cocultures with the strain carrying the wt config-uration. The ratio of inverted to wt cells is plotted as a function of the number of generations. Experiments were performed in wt andtus backgrounds (triangles and diamonds, respectively).
(D) Pathway required for viability of the inverted configuration. Genetic backgrounds in which inverted configuration did not give rise to viable colonies are indicated in red.
(E) Comparison of microscopic analyses of cells carrying TerE in a wt and inverted configuration. Colored horizontal bars indicate the size and the percentage of the different cell types and nucleoid contents in the wt (left panel) and inverted configurations (right panel), as described in Figure 2.
(F) Cells with inverted TerE were transformed with a plasmid expressinggfpunder the PsfiApromoter. Nucleoids of cells expressing
SOS appear as blue (see Figure S1 for unmerged pictures). Found at doi:10.1371/journal.pgen.0030226.sg001 (1.8 MB AI).
Figure S2.Microscopy Analysis of Cells Carrying TerE in an Inverted Configuration (Strain Intra R1)
(A) Phase contrast image of fixed cells.
(B) Fluorescence image of fixed cells expressinggfp.
(C) Combined image of phase contrast and fluorescence images of cells fixed and stained with DAPI to reveal nucleoids. Cells are in red and DNA is in green.
(D) Combined image of fluorescence images of cells fixed and stained with DAPI to reveal nucleoids and SOS response. DNA is in green and GFP fluorescence in blue.
Found at doi:10.1371/journal.pgen.0030226.sg002 (2.7 MB AI).
Figure S3.Imbalance of Replication Arms
Nucleoid and cell analyses of strains carrying chromosomes with various levels of imbalance. These inverted configurations were obtained upon interreplichore inversions. For each strain, the genetic map of the chromosome in the inverted configuration is shown. The level of imbalance is indicated above the map, the colonies are shown inside the map. The MDs (Ori in green, Right in red, Left in blue, and Ter in cyan), the ten Ter sites (from A to J),oriC, migS, anddifare indicated. Nucleoid and cell analysis obtained from each strain in both configurations is shown below the map. The left and right colored horizontal bars indicate the percentage of the different types of cells and nucleoids in the wt and inverted configurations, respectively, as described in Figure 2.
Found at doi:10.1371/journal.pgen.0030226.sg003 (2.5 MB PDF).
Figure S4.Tolerance to Large Inversions within a Replichore Nucleoid and cell analyses of strains carrying intrareplichore inversions between NSright and Ori MD (strain Intra O-NSright2),
between NSrightand Right MD in a strain deleted for TerH and TerI (strain Intra R-NSright3 DTerHI), and between NSleft and Left MD
(Intra L-NSleft1). Nucleoid and cell analysis obtained from each strain
in both configurations is shown below the map. The left and right colored horizontal bars indicate the percentage of the different types of cells and nucleoids in the wt and inverted configurations, respectively, as described in Figure 2.
Found at doi:10.1371/journal.pgen.0030226.sg004 (1.2 MB AI).
Figure S5.Phenotypic Analysis of Strains Carrying a Chromosome with an Intrareplichore Inversion between the Right and Ter MDs (A–D) show cells from strain Intra R-T1 in the inverted configuration; and (E) shows colonies of strain Intra R-T2.
(A) Microscopic phase contrast image of fixed cells.
(B) Microscopic fluorescence image of fixed cells expressinggfp. (C) Combined image of phase contrast and fluorescence images of cells fixed and stained with DAPI to reveal nucleoids. Cells are in red and DNA is in green.
(D) Combined image of fluorescence images of cells fixed and stained with DAPI to reveal nucleoids and SOS response. DNA is in green and GFP fluorescence in blue.
(E) Colonies of strain intra RT2 carrying the wt or inverted configuration in atusorrecA tusbackground.
Found at doi:10.1371/journal.pgen.0030226.sg005 (3.1 MB AI).
Figure S6.Intrareplichore Inversion between the Right and Ter MDs The genetic map of the chromosome in the inverted configuration is shown for strain Intra R-T4 carrying intrareplichore inversion between Ter and Right MDs. The MDs (Ori in green, Right in red, Left in blue, and Ter in cyan), the ten Ter sites (from A to J),oriC,migS, anddifare indicated. Nucleoid and cell analysis obtained is shown below the map. The left and right colored horizontal bars indicate the percentage of the different types of cells and nucleoids in the wt and inverted configurations, respectively, as described in Figure 2. Found at doi:10.1371/journal.pgen.0030226.sg006 (1.2 MB AI).
Figure S7.Intrareplichore Inversions between the Right and Ori MDs (A) The genetic map of chromosome in the inverted configuration is shown for strain Intra O-R6DTerHI.
(B) The genetic map of chromosome in the inverted configuration is shown for strain Intra O-R7DTerHI.
(C) The genetic map of chromosome in the inverted configuration is shown for strain Intra O-NSr2. Below the map are shown colonies carrying the wt or inverted configuration. Nucleoid and cell analysis obtained is shown below the map. The left and right colored horizontal bars indicate the percentage of the different types of cells and nucleoids in the wt and inverted configurations, respectively, as described in Figure 2.
(D) The genetic map of chromosome in the inverted configuration is shown for strain Intra O-NSr4. Below the map are shown colonies carrying the wt or inverted configuration. Nucleoid and cell analysis obtained is shown below the map. The left and right colored horizontal bars indicate the percentage of the different types of cells and nucleoids in the wt and inverted configurations, respectively, as described in Figure 2.
Found at doi:10.1371/journal.pgen.0030226.sg007 (1.4 MB AI).
Table S1.Bacterial Strains and Plasmids
Found at doi:10.1371/journal.pgen.0030226.st001 (120 KB PDF).
Text S1.Supplementary Text for Chromosome Structuring Limits Genome Plasticity inE. coli
Found at doi:10.1371/journal.pgen.0030226.sd001 (100 KB PDF).
Acknowledgments
We are very grateful to Be´ne´dicte Michel for the gift of strains, the many helpful discussions, and the critical reading of the manuscript. Author contributions.EE, MV, OE, and FB conceived and designed the experiments, performed the experiments, and analyzed the data. FB wrote the paper.
Funding. This study was supported by Centre National de la Recherche Scientifique, Agence Nationale de la Recherche, Associ-ation pour la Recherche sur le Cancer, and Action Concerte´e Incitative BCMS grants.
Competing interests.The authors have declared that no competing interests exist.
References
1. Lawrence JG (2005) The dynamic bacterial genome. In: Higgins NP, editor. The bacterial chromosome. Washington (D. C.): ASM Press. pp. 19–37. 2. Eisen JA, Heidelberg JF, White O, Salzberg SL (2000) Evidence for
symmetric chromosomal inversions around the replication origin in bacteria. Genome Biol 1: RESEARCH0011.
3. Lobry JR (1996) Asymmetric substitution patterns in the two DNA strands of bacteria. Mol Biol Evol 13: 660–665.
4. Lobry JR, Louarn JM (2003) Polarisation of prokaryotic chromosomes. Curr Opin Microbiol 6: 101–108.
5. Salzberg SL, Salzberg AJ, Kerlavage AR, Tomb JF (1998) Skewed oligomers and origins of replication. Gene 217: 57–67.
6. Blattner FR, Plunkett G 3rd, Bloch CA, Perna NT, Burland V, et al. (1997) The complete genome sequence of Escherichia coli K-12. Science 277: 1453–1474.
7. Hendrickson H, Lawrence JG (2007) Mutational bias suggests that replication termination occurs near the dif site, not at Ter sites. Molecular Microbiology 64: 42–56.
8. El Karoui M, Biaudet V, Schbath S, Gruss A (1999) Characteristics of Chi distribution on different bacterial genomes. Res Microbiol 150: 579–587. 9. Bigot S, Saleh OA, Lesterlin C, Pages C, El Karoui M, et al. (2005) KOPS:
10. Brewer BJ (1988) When polymerases collide: replication and the transcrip-tional organization of the E. coli chromosome. Cell 53: 679–686. 11. Rocha EP, Danchin A (2003) Essentiality, not expressiveness, drives
gene-strand bias in bacteria. Nat Genet 34: 377–378.
12. Couturier E, Rocha EP (2006) Replication-associated gene dosage effects shape the genomes of fast-growing bacteria but only for transcription and translation genes. Mol Microbiol 59: 1506–1518.
13. Hendrickson H, Lawrence JG (2006) Selection for chromosome architec-ture in bacteria. J Mol Evol 62: 615–629.
14. Coskun-Ari FF, Hill TM (1997) Sequence-specific interactions in the Tus-Ter complex and the effect of base pair substitutions on arrest of DNA replication in Escherichia coli. J Biol Chem 272: 26448–26456.
15. Horiuchi T, Fujimura Y (1995) Recombinational rescue of the stalled DNA replication fork: a model based on analysis of an Escherichia coli strain with a chromosome region difficult to replicate. J Bacteriol 177: 783–791. 16. Sharma B, Hill TM (1995) Insertion of inverted Ter sites into the terminus region of the Escherichia coli chromosome delays completion of DNA replication and disrupts the cell cycle. Mol Microbiol 18: 45–61. 17. Bidnenko V, Ehrlich SD, Michel B (2002) Replication fork collapse at
replication terminator sequences. EMBO J 21: 3898–3907.
18. Bidnenko V, Lestini R, Michel B (2006) The Escherichia coli UvrD helicase is essential for Tus removal during recombination-dependent replication restart from Ter sites. Mol Microbiol 62: 382–396.
19. Nielsen HJ, Li Y, Youngren B, Hansen FG, Austin S (2006) Progressive segregation of the Escherichia coli chromosome. Mol Microbiol 61: 383– 393.
20. Nielsen HJ, Ottesen JR, Youngren B, Austin SJ, Hansen FG (2006) The Escherichia coli chromosome is organized with the left and right chromosome arms in separate cell halves. Mol Microbiol 62: 331–338. 21. Teleman AA, Graumann PL, Lin DC, Grossman AD, Losick R (1998)
Chromosome arrangement within a bacterium. Curr Biol 8: 1102–1109. 22. Viollier PH, Thanbichler M, McGrath PT, West L, Meewan M, et al. (2004)
Rapid and sequential movement of individual chromosomal loci to specific subcellular locations during bacterial DNA replication. Proc Natl Acad Sci U S A 101: 9257–9262.
23. Wang X, Liu X, Possoz C, Sherratt DJ (2006) The two Escherichia coli chromosome arms locate to separate cell halves. Genes Dev 20: 1727–1731. 24. Niki H, Yamaichi Y, Hiraga S (2000) Dynamic organization of chromosomal
DNA in Escherichia coli. Genes Dev 14: 212–223.
25. Valens M, Penaud S, Rossignol M, Cornet F, Boccard F (2004) Macrodomain organization of the Escherichia coli chromosome. EMBO J 23: 4330–4341. 26. Yamaichi Y, Niki H (2004) migS, a cis-acting site that affects bipolar positioning of oriC on the Escherichia coli chromosome. EMBO J 23: 221– 233.
27. Perals K, Cornet F, Merlet Y, Delon I, Louarn JM (2000) Functional polarization of the Escherichia coli chromosome terminus: the dif site acts in chromosome dimer resolution only when located between long stretches of opposite polarity. Mol Microbiol 36: 33–43.
28. Bigot S, Sivanathan V, Possoz C, Barre FX, Cornet F (2007) FtsK, a literate chromosome segregation machine. Mol Microbiol 64: 1434–1441. 29. Lesterlin C, Barre FX, Cornet F (2004) Genetic recombination and the cell
cycle: what we have learned from chromosome dimers. Mol Microbiol 54: 1151–1160.
30. Rebollo JE, Francois V, Louarn JM (1988) Detection and possible role of two large nondivisible zones on the Escherichia coli chromosome. Proc Natl Acad Sci U S A 85: 9391–9395.
31. Konrad EB (1977) Method for the isolation of Escherichia coli mutants with enhanced recombination between chromosomal duplications. J Bacteriol 130: 167–172.
32. Segall A, Mahan MJ, Roth JR (1988) Rearrangement of the bacterial chromosome: forbidden inversions. Science 241: 1314–1318.
33. Hill CW, Gray JA (1988) Effects of chromosomal inversion on cell fitness in Escherichia coli K-12. Genetics 119: 771–778.
34. Miesel L, Segall A, Roth JR (1994) Construction of chromosomal rearrange-ments in Salmonella by transduction: inversions of non-permissive segments are not lethal. Genetics 137: 919–932.
35. Guijo MI, Patte J, del Mar Campos M, Louarn JM, Rebollo JE (2001) Localized remodeling of the Escherichia coli chromosome: the patchwork of segments refractory and tolerant to inversion near the replication terminus. Genetics 157: 1413–1423.
36. Campo N, Dias MJ, Daveran-Mingot ML, Ritzenthaler P, Le Bourgeois P (2004) Chromosomal constraints in Gram-positive bacteria revealed by artificial inversions. Mol Microbiol 51: 511–522.
37. Lesterlin C, Mercier R, Boccard F, Barre FX, Cornet F (2005) Roles for replichores and macrodomains in segregation of the Escherichia coli chromosome. EMBO Rep 6: 557–562.
38. Louarn JM, Kuempel PL, Cornet F (2005) The terminus region of the E. coli chromosome, or, all’s well that ends well. In: Higgins NP, editor. The bacterial chromosome. Washington (D. C.): ASM Press. pp. 251–273. 39. Huisman O, D’Ari R, Gottesman S (1984) Cell-division control in
Escherichia coli: specific induction of the SOS function SfiA protein is sufficient to block septation. Proc Natl Acad Sci U S A 81: 4490–4494. 40. Mirkin EV, Castro Roa D, Nudler E, Mirkin SM (2006) Transcription
regulatory elements are punctuation marks for DNA replication. Proc Natl Acad Sci U S A 103: 7276–7281.
41. French S (1992) Consequences of replication fork movement through transcription units in vivo. Science 258: 1362–1365.
42. Mirkin EV, Mirkin SM (2005) Mechanisms of transcription-replication collisions in bacteria. Mol Cell Biol 25: 888–895.
43. Cornet F, Louarn J, Patte J, Louarn JM (1996) Restriction of the activity of the recombination site dif to a small zone of the Escherichia coli chromosome. Genes Dev 10: 1152–1161.
44. Corre J, Louarn JM (2005) Extent of the activity domain and possible roles of FtsK in the Escherichia coli chromosome terminus. Mol Microbiol 56: 1539–1548.
45. Espeli O, Levine C, Hassing H, Marians KJ (2003) Temporal regulation of topoisomerase IV activity in E. coli. Mol Cell 11: 189–201.
46. Lin DC, Grossman AD (1998) Identification and characterization of a bacterial chromosome partitioning site. Cell 92: 675–685.
47. de Boer PA, Crossley RE, Rothfield LI (1989) A division inhibitor and a topological specificity factor coded for by the minicell locus determine proper placement of the division septum in E. coli. Cell 56: 641–649. 48. Bernhardt TG, de Boer PA (2005) SlmA, a nucleoid-associated, FtsZ binding
protein required for blocking septal ring assembly over chromosomes in E. coli. Mol Cell 18: 555–564.
49. Moulin L, Rahmouni AR, Boccard F (2005) Topological insulators inhibit diffusion of transcription-induced positive supercoils in the chromosome of Escherichia coli. Mol Microbiol 55: 601–610.