ISSN 1557-4555
© 2010 Science Publications
Corresponding Author: Mehran Torki, Department of Animal Science, Faculty of Agriculture, RaziUniversity, Imam Avenue, Postal Code: 6715685418, Kermanshah, Iran
Effects of Dietary Inclusion of Guar Meal Supplemented by
β
-Mannanase on Performance of Laying Hens, Egg Quality
Characteristics and Diacritical Counts of White Blood Cells
Mohammad Ehsani and Mehran Torki
Department of Animal Science, Faculty of Agriculture, RaziUniversity, Imam Avenue, Postal Code: 6715685418, Kermanshah, Iran
Abstract: Problem statement: Using Guar Meal (GM) in poultry diets has being limited because of having β-mannan, one of the Nonstarch Polysaccharides (NSP). In this study we try evaluating effects of enzyme supplementation of GM-included diets on productive performance of laying hens.
Approach: A total number of 144 Lohmann LSL-Lite hens were divided in 24 cages (n = 6). Based on a 3 × 2 factorial arrangement of treatments, six iso-caloric and iso-nitrogenous diets including 3 levels of GM (0.0, 35.0 and 70.0 g kg−1) with and without enzyme (Hemicell® a β-mannanase-based enzyme, 0.0 and 0.6 g kg−1) were assigned to hens in 4 cages (replicates). Data was analyzed based on completely randomized design using GLM procedure of SAS. Results: Dietary GM inclusion significantly affected on Egg Production (EP) on weeks 2, 4 and 6 as well as the overall trail period. Hens fed the GM-included diets did have decreased EP compared to hens fed the control diet. Almost the same trend was observed in terms of Egg Mass (EM); so that hens fed the GM-included diets showed decreased EM compared to the hens fed the control diet. Enzyme supplementation did not have significant effect on EP in the present experiment, but EM was significantly improved in the hens fed the β-mannanase-supplemented diets on weeks 3, 6 and the overall experimental period. Dietary inclusion GM increased Feed Conversion Ratio (FCR) of laying hens compared to the hens fed the control diets on weeks 2, 4, 6 and overall trial period. Conclusion/Recommendations: Including GM in laying hens’ diets more than 3% may decrease productive performance. Supplementing corn-soybean or corn-corn-soybean-GM diets by β-mannanase would have beneficial effects on performance of hens especially in terms of FCR and EP.
Key words: Guar meal, enzyme, β-mannanase, performance, egg characteristics, laying hens
INTRODUCTION
Guar Meal (GM), a relatively inexpensive high protein meal, produced as a by-product of guar gum manufacture. The protein content of GM ranges between 33-60% depending on fraction type. GM results from combinations of two fractions, the germ and hull. The germ and hull constitute approximately 44 and 21% of the guar bean, respectively. However, the germ and hull proportions of the guar bean are not consistent with the relative amounts of the fractions mixed in guar meal. Also, the degree of contamination of the germ and hull fractions with guar gum is not equivalent within these proportions when mixed into commercial GM. Guar gum residue contained in the meal increases the viscosity of digesta, thereby decreasing growth and feed efficiency.
The objectives of the present study were to investigate effects of dietary including graded levels of GM supplemented by enzyme on productive performance of laying hens, egg quality characteristics and diacritical counts of white blood cells.
MATERIALS AND METHODS
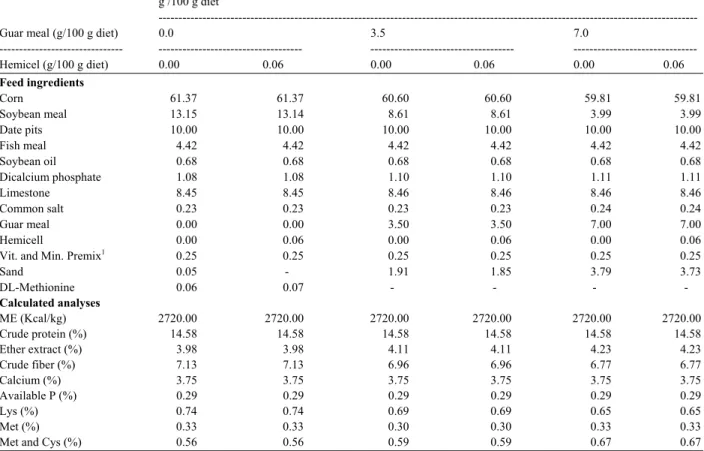
A total number of 144 Lohmann LSL-Lite hens were divided in 24 cages (n = 6) with almost equal distribution of average body weight and egg production among cages. Hens in 4 cages (replicates) were assigned to feed on one the 6 experimental diets. Based on a 3×2 factorial arrangement of treatments, 6 iso-caloric and iso-nitrogenous diets (ME =2720 Kcal kg−1 and CP =145 g kg−1) including GM (0.0, 35.0 and 70.0 g kg−1) and enzyme (0.0 and 0.6 g kg−1) were formulated (Table 1). Collected data of Feed Intake (FI), Egg Production (EP), Egg Mass (EM) and calculated Feed Conversion Ratio (FCR) during 6 week
trial period was analyzed based on completely randomized design using GLM procedure of SAS.
RESULTS
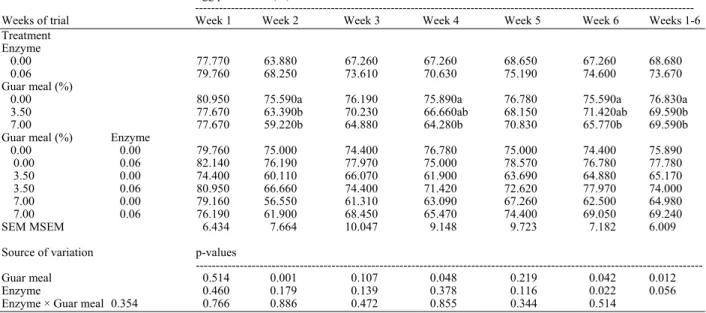
Effects of dietary GM inclusion and enzyme supplementation on EP, FI, FCR, Egg Weight (EW) and EM during experimental period (6 weeks) are presented in Table 1-6, respectively. There was no interaction between dietary GM inclusion and enzyme supplementation on any of productive performance and egg quality traits (p>0.05). Dietary GM inclusion significantly affected on EP on weeks 2, 4 and 6 as well as the overall trail period (weeks 1-6). Hens fed the GM-included diets did have decreased EP compared to hens fed the control diet. Almost the same trend was observed in terms of EM; so that hens fed the GM-included diets showed decreased EM compared to hens fed the control diet (Table 6).
Table 1: Composition of the experimental diets g /100 g diet
---
Guar meal (g/100 g diet) 0.0 3.5 7.0
--- --- --- ---
Hemicel (g/100 g diet) 0.00 0.06 0.00 0.06 0.00 0.06
Feed ingredients
Corn 61.37 61.37 60.60 60.60 59.81 59.81
Soybean meal 13.15 13.14 8.61 8.61 3.99 3.99
Date pits 10.00 10.00 10.00 10.00 10.00 10.00
Fish meal 4.42 4.42 4.42 4.42 4.42 4.42
Soybean oil 0.68 0.68 0.68 0.68 0.68 0.68
Dicalcium phosphate 1.08 1.08 1.10 1.10 1.11 1.11
Limestone 8.45 8.45 8.46 8.46 8.46 8.46
Common salt 0.23 0.23 0.23 0.23 0.24 0.24
Guar meal 0.00 0.00 3.50 3.50 7.00 7.00
Hemicell 0.00 0.06 0.00 0.06 0.00 0.06
Vit. and Min. Premix1 0.25 0.25 0.25 0.25 0.25 0.25
Sand 0.05 - 1.91 1.85 3.79 3.73
DL-Methionine 0.06 0.07 - - - -
Calculated analyses
ME (Kcal/kg) 2720.00 2720.00 2720.00 2720.00 2720.00 2720.00
Crude protein (%) 14.58 14.58 14.58 14.58 14.58 14.58
Ether extract (%) 3.98 3.98 4.11 4.11 4.23 4.23
Crude fiber (%) 7.13 7.13 6.96 6.96 6.77 6.77
Calcium (%) 3.75 3.75 3.75 3.75 3.75 3.75
Available P (%) 0.29 0.29 0.29 0.29 0.29 0.29
Lys (%) 0.74 0.74 0.69 0.69 0.65 0.65
Met (%) 0.33 0.33 0.30 0.30 0.33 0.33
Met and Cys (%) 0.56 0.56 0.59 0.59 0.67 0.67
1The vitamin and mineral premix provide the following quantities per kilogram of diet: vitamin A, 10,000 IU (all-trans-retinal); cholecalciferol,
Table 2: Effects of dietary guar meal inclusion (0, 35.0 and 70 g kg−1) and enzyme supplementation (0.0 and 0.6 g kg−1) on egg production (%) Egg production (%)
---
Weeks of trial Week 1 Week 2 Week 3 Week 4 Week 5 Week 6 Weeks 1-6
Treatment
Enzyme
0.00 77.770 63.880 67.260 67.260 68.650 67.260 68.680
0.06 79.760 68.250 73.610 70.630 75.190 74.600 73.670
Guar meal (%)
0.00 80.950 75.590a 76.190 75.890a 76.780 75.590a 76.830a
3.50 77.670 63.390b 70.230 66.660ab 68.150 71.420ab 69.590b
7.00 77.670 59.220b 64.880 64.280b 70.830 65.770b 69.590b
Guar meal (%) Enzyme
0.00 0.00 79.760 75.000 74.400 76.780 75.000 74.400 75.890
0.00 0.06 82.140 76.190 77.970 75.000 78.570 76.780 77.780
3.50 0.00 74.400 60.110 66.070 61.900 63.690 64.880 65.170
3.50 0.06 80.950 66.660 74.400 71.420 72.620 77.970 74.000
7.00 0.00 79.160 56.550 61.310 63.090 67.260 62.500 64.980
7.00 0.06 76.190 61.900 68.450 65.470 74.400 69.050 69.240
SEM MSEM 6.434 7.664 10.047 9.148 9.723 7.182 6.009
Source of variation p-values
---
Guar meal 0.514 0.001 0.107 0.048 0.219 0.042 0.012
Enzyme 0.460 0.179 0.139 0.378 0.116 0.022 0.056
Enzyme × Guar meal 0.354 0.766 0.886 0.472 0.855 0.344 0.514
a-b: Means within a column (within main effects) with no common superscript differ significantly (p<0.05), SEM = Standard Error of Means
Table 3: Effects of dietary guar meal inclusion (0, 35.0 and 70 g kg−1) and enzyme supplementation (0.0 and 0.6 g kg−1) on feed intake Feed intake (g hen−1 day−1)
---
Weeks of trial Week 1 Week 2 Week 3 Week 4 Week 5 Week 6 Weeks 1-6
Treatment
Enzyme
0.00 119.470a 119.470 119.730 119.890 119.200 119.780 119.590
0.06 119.040b 118.730 119.400 119.360 118.930 119.180 119.110
Guar meal
0.00 119.410 119.770 119.830 119.370 119.240 119.280 119.480
3.50 119.220 119.130 119.770 119.920 119.270 119.490 119.470
7.00 119.120 118.400 119.090 119.580 118.700 119.670 119.090
Guar meal Enzyme
0.00 0.00 119.700 119.820 119.880 120.000 120.000 120.000 119.900
0.00 0.06 119.130 119.730 119.790 118.750 118.480 118.570 119.070
3.50 0.00 119.400 119.370 120.000 119.850 119.730 120.000 119.720
3.50 0.06 119.050 118.900 119.550 119.850 118.810 118.980 119.210
7.00 0.00 119.310 119.220 119.310 119.820 117.880 119.340 119.150
7.00 0.06 118.930 117.580 118.870 119.340 119.520 120.000 119.040
SEM 0.387 1.327 1.077 0.826 2.158 1.525 0.755
Source of variation p-values
---
Guar meal 0.329 0.147 0.331 0.423 0.842 0.880 0.518
Enzyme 0.013 0.192 0.467 0.136 0.765 0.352 0.136
Enzyme × Guar meal 0.847 0.492 0.929 0.263 0.322 0.372 0.646
a-b: Means within a column (within main effects) with no common superscript differ significantly (p<0.05), SEM = Standard Error of Means
Although, enzyme supplementation did not have significant effect on EP in the present experiment (Table 2), EM was significantly improved in hens fed the β-mannanase-supplemented diets on weeks 3, 6 and the overall experimental period (weeks 1-6, Table 6). Hens fed the GM-included diets had decreased FI compared to hens fed the control diet on week 1 of the trial; however, FI of hens during week 2-6 did not significantly affected by dietary GM inclusion or
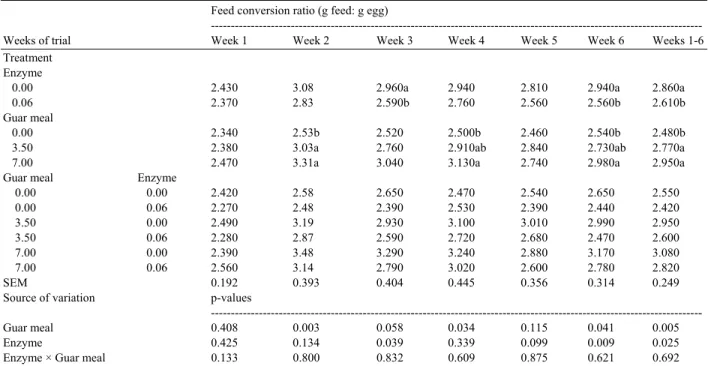
Table 4: Effects of dietary guar meal inclusion (0, 35.0 and 70 g kg−1) and enzyme supplementation (0.0 and 0.6 g kg−1) on Feed Conversion Ratio (FCR)
Feed conversion ratio (g feed: g egg)
---
Weeks of trial Week 1 Week 2 Week 3 Week 4 Week 5 Week 6 Weeks 1-6
Treatment
Enzyme
0.00 2.430 3.08 2.960a 2.940 2.810 2.940a 2.860a
0.06 2.370 2.83 2.590b 2.760 2.560 2.560b 2.610b
Guar meal
0.00 2.340 2.53b 2.520 2.500b 2.460 2.540b 2.480b
3.50 2.380 3.03a 2.760 2.910ab 2.840 2.730ab 2.770a
7.00 2.470 3.31a 3.040 3.130a 2.740 2.980a 2.950a
Guar meal Enzyme
0.00 0.00 2.420 2.58 2.650 2.470 2.540 2.650 2.550
0.00 0.06 2.270 2.48 2.390 2.530 2.390 2.440 2.420
3.50 0.00 2.490 3.19 2.930 3.100 3.010 2.990 2.950
3.50 0.06 2.280 2.87 2.590 2.720 2.680 2.470 2.600
7.00 0.00 2.390 3.48 3.290 3.240 2.880 3.170 3.080
7.00 0.06 2.560 3.14 2.790 3.020 2.600 2.780 2.820
SEM 0.192 0.393 0.404 0.445 0.356 0.314 0.249
Source of variation p-values
---
Guar meal 0.408 0.003 0.058 0.034 0.115 0.041 0.005
Enzyme 0.425 0.134 0.039 0.339 0.099 0.009 0.025
Enzyme × Guar meal 0.133 0.800 0.832 0.609 0.875 0.621 0.692
a-b: Means within a column (within main effects) with no common superscript differ significantly (p<0.05), SEM = Standard Error of Means
Table 5: Effects of dietary guar meal inclusion (0, 35.0 and 70 g kg−1) and enzyme supplementation (0.0 and 0.6 g kg−1) on average egg weight Egg weight (g)
---
Weeks of trial Week 1 Week 2 Week 3 Week 4 Week 5 Week 6 Weeks 1-6
Treatment
Enzyme
0.00 63.55 62.40 62.260 62.747 62.910 61.760 62.600
0.06 63.36 62.48 63.300 62.152 62.810 63.540 62.940
Guar meal
0.00 63.60 62.72 63.600 63.070 63.720 62.450 63.190
3.50 64.32 62.94 62.710 62.930 62.750 62.640 63.050
7.00 62.46 61.67 62.030 61.330 62.100 62.860 62.070
Guar meal Enzyme
0.00 0.00 62.68ab 62.01 62.400 63.200 63.400 61.070 62.460
0.00 0.06 64.52a 63.43 64.800 62.940 64.040 63.830 63.930
3.50 0.00 64.22a 63.26 63.020 63.450 63.220 62.980 63.360
3.50 0.06 64.42a 62.62 62.400 62.420 62.280 62.300 62.740
7.00 0.00 63.76a 61.94 61.350 61.580 62.090 61.220 61.990
7.00 0.06 61.16b 61.41 62.720 61.090 62.100 64.500 62.160
SEM 1.920 2.131 2.712 2.612 2.278 3.485 2.137
Source of variation P values
---
Guar meal 0.095 0.462 0.525 0.356 0.378 0.972 0.534
Enzyme 0.780 0.926 0.357 0.583 0.914 0.225 0.703
Enzyme × Guar meal 0.040 0.564 0.537 0.954 0.787 0.481 0.622
a-b: Means within a column (within main effects) with no common superscript differ significantly (p<0.05), SEM = Standard Error of Means
As it is shown in Table 7, among the egg quality traits, only the thickness of egg shell was significantly affected by dietary GM inclusion. Hens fed diet included 7% GM did have lower egg shell thickness compared to hens fed the other two experimental diets.
Enzyme supplementation did not have any beneficial effects on the measured egg traits in this study.
Table 6: Effects of dietary guar meal inclusion (0, 35.0 and 70 g kg−1) and enzyme supplementation (0.0 and 0.6 g kg−1) on egg mass Egg mass (g hen−1 day−1)
---
Weeks of trial Week 1 Week 2 Week 3 Week 4 Week 5 Week 6 Weeks 1-6
Treatment
Enzyme
0.00 49.360 39.750 41.640b 42.100 43.150 41.420b 42.910b
0.06 50.600 42.720 46.430a 43.780 47.060 46.970a 46.260a
Guar meal
0.00 51.450 47.390a 48.220a 47.790a 48.760 47.160 48.460a
3.50 50.250 39.980b 43.910ab 41.740b 42.760 44.640 43.880b
7.00 48.240 36.330b 39.980b 39.280b 43.790 40.800 41.400b
Guar meal Enzyme
0.00 0.00 50.000 46.430 46.190 48.570 47.560 45.390 47.350
0.00 0.06 52.910 48.360 50.260 47.020 49.970 48.930 49.570
3.50 0.00 48.120 38.060 41.420 39.190 40.290 40.830 41.320
3.50 0.06 52.380 41.900 46.390 44.280 45.230 48.450 46.440
7.00 0.00 49.970 34.760 37.320 38.540 41.600 38.060 40.045
7.00 0.06 46.510 37.910 42.650 40.030 45.980 43.540 42.770
SEM 4.143 4.879 5.287 5.282 5.590 4.860 3.253
Source of variation p-values
---
Guar meal 0.316 0.000 0.020 0.013 0.099 0.053 0.001
Enzyme 0.473 0.152 0.039 0.447 0.104 0.012 0.021
Enzyme × Guar meal 0.167 0.924 0.970 0.468 0.893 0.707 0.643
a-b: Means within a column (within main effects) with no common superscript differ significantly (p<0.05), SEM = Standard Error of Means
Table 7: Effects of dietary guar meal inclusion (0, 35.0 and 70 g kg−1) and enzyme supplementation (0.0 and 0.6 g kg−1) on egg quality characteristics (egg index, yolk index, Haugh unit, egg shell weight and egg shell thickness)
Egg quality characteristics
--- Egg index Yolk index Haugh unit Egg shell weight Egg shell thickness
Treatment
Enzyme
0.00 75.700 43.890 69.080 6.900 38.950
0.06 75.070 43.920 68.620 7.080 39.220
Guar meal
0.00 75.680 43.460 69.910 7.060 39.000ab
3.50 75.400 43.920 69.670 7.030 40.180a
7.00 75.080 44.340 66.970 6.880 38.090b
SEM 2.074 0.896 2.957 0.302 1.563
Source of variation p-values
---
Guar meal 0.848 0.175 0.115 0.460 0.048
Enzyme 0.470 0.944 0.708 0.174 0.676
Enzyme × Guar meal 0.614 0.577 0.576 0.579 0.501
a-b: Means within a column (within main effects) with no common superscript differ significantly (p<0.05), SEM = Standard Error of Means
Table 8: Effects of dietary guar meal inclusion (0, 35.0 and 70 g kg−1) and enzyme supplementation (0.0 and 0.6 g kg−1) on white blood cell counts (heterophil, lymphocyte, monocyte, eosinophil and basophil)
Heterophile Lymphocyte Monocyte Eosinophile Basophile
Treatment Enzyme
0.00 26.330 71.41 0.660 0.660 1.000
0.06 26.580 70.83 1.080 0.410 1.080
Guar meal
0.00 28.120 69.25 1.120 0.620 0.870
3.50 25.370 72.12 0.870 0.500 1.120
7.00 25.870 72.00 0.620 0.500 1.120
SEM 4.151 3.998 1.006 0.716 1.006
Source of variation p-values
---
Guar meal 0.388 0.291 0.618 0.922 0.849
Enzyme 0.884 0.725 0.324 0.404 0.841
Enzyme × Guar meal 0.971 0.989 0.849 0.786 0.849
DISCUSSION
Some studies reported that there was no negative impact on productive performance after adding GM without enzyme to diets at concentrations up to 2.5% in broiler chicks (Lee et al., 2003a; 2003b) or 5% in laying hen diets (Gutierrez et al., 2007). Different indigestible polysaccharides, such as pectin, gum Arabic, gum agar, locust bean gum and guar gum, increase intestinal viscosity, which decreases growth and increases feed conversion. Degradation of these gums could allow for by-product meals to be used in poultry diets to decrease the cost of feeding. Generally, viscosity increased with each treatment as digesta traveled through the small intestine from duodenum to jejunum to ileum. Lee et al. (2005) reported that GM can be used at up to 5% with β-mannanase enzyme in broilers. Jackson et al. (2004) reported that Hemicell improved weight gain and FCR of broilers.
Hydrolyzing the gum and decreasing digesta viscosity should increase starch digestibility in the small intestine, thereby leading to improved growth and feed efficiency. It has been reported that laying hens induced to molt by GM feeding exhibit improved resistance to Salmonella Enteritidis colonization when compared with hens molted by complete feed withdrawal. Furthermore, supplementation of β -mannanase (Hemicell) to diets containing high levels of GM appears to enhance resistance to Salmonella
Enteritidis colonization in molted laying hens (Gutierrez et al., 2008).
In the study by Lee et al. (2003a), the hull fraction of gaur increased intestinal viscosity at all inclusion levels fed (0, 2.5, 5.0, 7.5 and 10.0%). In their investigation, although FCR was not affected until the inclusion rate exceeded 5.0%; whereas, the germ fraction significantly increased intestinal viscosity at 7.5 and 10% inclusion rates. Lee et al. (2005) reported that Hemicell significantly reduced the FCR of guar germ diets to a level comparable with the positive and negative control diets. Daskiran et al. (2004) added Hemicell at 0.5, 1 and 1.5% in a corn-soy-based starter diet containing 1% GM and found that Hemicell improved FCR at all inclusion levels.
The significant effect of Hemicell on immunity of broilers may be explained by the findings of Wu et al. (2005) who reported that substrate of Hemicell entering the intestinal tract resulted in a reduction of the β-mannan content associated with a reduction of innate immune stimulation. An important mode of action is a reduction in innate immune stimulation associated with a reduction in the β-mannan content of substrate entering the intestinal tract. β-mannans crossing the intestinal mucosa are potent
stimulators of the innate immune system, resulting in increased proliferation of macrophages and monocytes and resultant cytokine production.
CONCLUSION
From the results of the present investigation it can be concluded that including GM in laying hens more than 3 % may cause decrease productive performance. In addition, supplementing soybean or corn-soybean-guar meal diets by β-mannanase would have beneficial effects on performance of hens especially in terms of feed conversation ratio and egg production.
REFERENCES
Daskiran, M., R.G. Teeter, D.W. Fodge and H.Y. Hsiao, 2004. An evaluation of endo-β-D-mannanase (Hemicell) effects on broiler performance and energy use in diets varying in β-mannan content. Poult. Sci., 83: 662-668. PMID: 15109064.
Fanooci, M. and M. Torki, 2010. Effects of qualitative dietary restriction on performance, carcass characteristics, white blood cell count and humoral immune response of broiler chicks. Global Vet., 4: 277-282.
Ghasemi, R., M. Zarei and M. Torki, 2010. Adding dedicinal herbs including garlic (Allium sativum) and thyme (Thymus vulgaris) to diet of laying hens and evaluating productive performance and egg quality characteristics. Am. J. Anim. Vet. Sci., 5: 151-154. DOI: 10.3844/ajavsp.2010.151.154 Gutierrez, O., C. Zhang, D.J. Caldwell, J.B. Carey and
A.L. Cartwright et al., 2008. Guar meal diets as an aternative approach to inducing molt and improving Salmonella enteritidis resistance in late-phase laying hens. Poult. Sci., 87: 536-540. DOI:10.3382/ps.2007-00337.
Gutierrez, O., C. Zhang, A.L. Cartwright, J.B. Carey and C.A. Bailey, 2007. Use of guar by product in high production laying hen diets. Poult. Sci., 86: 1115-1120. PMID: 17495081.
Jackson, M.E., K. Geronian, A. Knox, J. McNab and E. McCartney, 2004. A dose-response study with the feed enzyme β-mannanase in broilers provided with corn-soybean meal based diets in the absence of antibiotic. Poult. Sci., 83: 1992-1996. PMID: 15615012
Lee, J.T., C.A. Bailey and A.L. Cartwright, 2003b. β -mannanase ameliorates viscosity-associated depression of growth in broiler chickens fed guar germ and hull fractions. Poult. Sci., 82: 1925-1931. PMID: 14717550
Lee, J.T., S. Connor-Appleton, C.A. Bailey, A.L. Cartwright,
2005. Effects of guar meal by-product with and without beta-mannanase Hemicell1 on broiler performance. Poult. Sci., 84: 1261-1267. PMID: 16156210
Mahdavi, R. and M. Torki. 2009. Study on usage period of dietary protected butyric acid on performance, carcass characteristics, serum metabolite levels and humoral immune response of broiler chickens. J. Anim. Vet. Adv., 8: 1702-1709. DOI: 10.3923/javaa.2009.1702.1709
Maroufyan, E., A. Kasim, S.R. Hashemi, T.C. Loh and M.H. Bejo, 2010. Change in growth performance and liver function enzymes of broiler chickens challenged with infectious bursal disease virus to dietary supplementation of methionine and threonine. Am. J. Anim. Vet. Sci., 5: 20-26. DOI: 10.3844/ajavsp.2010.20.26
Najafi, P. and M. Torki, 2010. Performance, blood metabolite and immunocompetence of broiler chicks fed diets included essential oils of medicinal plants. J. Anim. Vet. Adv., 9: 1164-1168. DOI: 10.3923/javaa.2010.1164.1168
Wu, G., M.M. Bryant, R.A. Voitle and D.A. S. Roland, 2005. Effects of β-mannanase in corn-soy diets on commercial leghorns in second-cycle hens. Poult. Sci., 84: 894- 897. PMID: 15971526
Zangiabadi, H.R. and M. Torki, 2010. The effect of a β -mannanase-based enzyme on growth performance and humoral immune response of broiler chickens fed diets containing graded levels of whole dates. Trop. Anim. Health Prod., 42: 1209-1217. DOI: 10.1007/s11250-010-9550-1