BGD
5, 3267–3305, 2008DON and PON in the equatorial Pacific
X. J. Wang et al.
Title Page
Abstract Introduction
Conclusions References
Tables Figures
◭ ◮
◭ ◮
Back Close
Full Screen / Esc
Printer-friendly Version
Interactive Discussion Biogeosciences Discuss., 5, 3267–3305, 2008
www.biogeosciences-discuss.net/5/3267/2008/ © Author(s) 2008. This work is distributed under the Creative Commons Attribution 3.0 License.
Biogeosciences Discussions
Biogeosciences Discussionsis the access reviewed discussion forum ofBiogeosciences
Spatial and temporal variations in
dissolved and particulate organic
nitrogen in the equatorial Pacific:
biological regulations and physical
influences
X. J. Wang1, R. Le Borgne2, R. Murtugudde1, A. J. Busalacchi1, and M. Behrenfeld3
1
University of Maryland, College Park, Maryland, USA 2
Institut de Recherche pour le D ´eveloppement, Noum ´ea C ´edex, New Caledonia, France 3
Oregon State University, Corvallis, Oregon, USA
Received: 18 July 2008 – Accepted: 25 July 2008 – Published: 25 August 2008 Correspondence to: X. J. Wang ([email protected])
BGD
5, 3267–3305, 2008DON and PON in the equatorial Pacific
X. J. Wang et al.
Title Page
Abstract Introduction
Conclusions References
Tables Figures
◭ ◮
◭ ◮
Back Close
Full Screen / Esc
Printer-friendly Version
Interactive Discussion Abstract
To quote Libby and Wheeler (1997), “we have only a cursory knowledge of the distribu-tions of dissolved and particulate organic nitrogen” in the equatorial Pacific. A decade later, we are still in need of spatial and temporal analyses of these organic nitrogen pools. To address this issue, we employ a basin scale physical-biogeochemical model 5
to study the spatial and temporal variations of dissolved organic nitrogen (DON) and particulate organic nitrogen (PON). The model is able to reproduce many observed features of nitrate, ammonium, DON and PON in the central and eastern equatorial Pacific, including the asymmetries of nitrate and ammonium, and the meridional dis-tributions of DON and PON. Modeled DON (5–8 mmol m−3) shows small zonal and
10
meridional variations in the mixed layer whereas modeled PON (0.4–1.5 mmol m−3)
shows considerable spatial variability. While there is a moderate seasonality in both DON and PON in the mixed layer, there is a much weaker interannual variability in DON than in PON. The interannual variability in PON is largely associated with the El Ni ˜no/Southern Oscillation (ENSO) phenomenon, showing high values during cold 15
ENSO phase but low values during warm ENSO phase. Overall, DON and PON have significant positive correlations with phytoplankton and zooplankton in the mixed layer. However, the relationships with phytoplankton and zooplankton are much weaker for DON (r=0.18–0.71) than for PON (r=0.25–0.97). Such a difference is ascribed to a larger degree of physical control (e.g., upwelling of low-organic-N deep waters into the 20
surface) on DON than PON. On the whole, distribution of organic nitrogen appears to be controlled by biological influences in the equatorial Pacific.
1 Introduction
The central and eastern equatorial Pacific displays persistent High-Nutrient-Low-Chlorophyll (HNLC) conditions, which are attributable to both the micro-nutrient limi-25
BGD
5, 3267–3305, 2008DON and PON in the equatorial Pacific
X. J. Wang et al.
Title Page
Abstract Introduction
Conclusions References
Tables Figures
◭ ◮
◭ ◮
Back Close
Full Screen / Esc
Printer-friendly Version
Interactive Discussion by micro-zooplankton (Landry et al., 1997; Landry and Kirchman, 2002; Le Borgne
and Landry, 2003; Wang et al., 2005a). It is believed that community growth is limited by insufficient iron in the euphotic zone (Coale et al., 1996; Martin et al., 1994; Wang et al., 2005a; Behrenfeld et al., 2006), and diatom growth also by silica (Dugdale and Wilkerson, 1998; Chai et al., 2002). To date, most studies of the marine nitrogen cycle 5
have largely focused on the distribution and behavior of nitrate in the equatorial Pa-cific. As Libby and Wheeler (1997) stated, “we have only a cursory knowledge of the distributions of dissolved and particulate organic nitrogen in this region,” and “a com-prehensive evaluation of both inorganic and organic N-pools is important to achieve an understanding of the transport and regeneration of nitrogen in the equatorial Pacific.” 10
While there are several field studies which have measured particulate organic ni-trogen (PON) in the equatorial Pacific (Libby and Wheeler, 1997; Eppley et al., 1992; Raimbault et al., 1999; Pena et al., 1991, 1992), there are only two studies reported concentrations of dissolved organic nitrogen (DON) (Raimbault et al., 1999; Libby and Wheeler, 1997). The limited data show little variations in both PON and DON concen-15
trations below 150 m in the central equatorial Pacific (Raimbault et al., 1999). Overall, observations show considerable variations in the surface PON (>0.7µm) concentra-tions (0.4–1.6 mmol m−3
) but a relatively small range of the surface DON concentration (4–9 mmol m−3).
Overall, the surface DON concentrations show relatively weak meridional variations 20
in the central and eastern equatorial Pacific. Interestingly, there is a considerable dif-ference (≈2 mmol m−3) in the surface DON concentration between the two reports with
relatively higher values along 125◦W and 140◦W during September–November 1992
(Libby and Wheeler, 1997) than along 150◦
W during November 1994 (Raimbault et al., 1999). One would ask if such a difference is ascribed to the spatial variability (i.e., 25
125◦W–140◦W vs. 150◦W), the interannual variability (i.e., 1992 vs. 1994), or both?
BGD
5, 3267–3305, 2008DON and PON in the equatorial Pacific
X. J. Wang et al.
Title Page
Abstract Introduction
Conclusions References
Tables Figures
◭ ◮
◭ ◮
Back Close
Full Screen / Esc
Printer-friendly Version
Interactive Discussion 2006a and b). However, little is known about the large scale spatial and temporal
vari-ations of DON and PON in the equatorial Pacific. Observvari-ations are limited not only in terms of spatial and temporal coverage, but also in terms of a lack of key param-eters representing the sources and sinks of the DON pool. Hence, modeling studies offer considerable promise not only for filling the gaps in the spatio-temporal variability, 5
but also for enhancing our understanding of the mechanisms underlying the observed variability.
In this study, we apply a fully coupled basin-scale physical-biogeochemical model that is developed for the equatorial Pacific (Christian et al., 2002; Wang et al., 2006b). The model has shown the ability of simulating the ecosystem dynamic, and spatial and 10
temporal variations in biogeochemical fields (e.g., chlorophyll, primary productivity, new production, sea surfacepCO2and ocean-atmosphere CO2fluxes) (Wang et al., 2005a,
2006a and b). The objective of this study is to understand the spatial and temporal variability of DON and PON and underlying mechanisms. Our approach includes model validations of main nitrogen components, and analyses of relationships of DON and 15
PON with various physical and biogeochemical parameters.
2 Materials and methods
2.1 Ocean physical-biogeochemical model
The ocean general circulation model (OGCM) is based on a primitive equation, σ -coordinate model that is coupled to an advective atmospheric mixed layer model (Gent 20
and Cane, 1989; Murtugudde et al., 1996). The model has 20 vertical layers with variable thickness. The first layer, the mixed layer, is determined by surface turbulent kinetic energy generation, dynamic instability mixing, and convective mixing to remove static instabilities (Chen et al., 1994). The model is set up for the Pacific domain be-tween 30◦S–30◦N, with zonal resolution of 1◦longitude, and stretched meridionally 0.3◦
25
within 5◦
S–5◦
N to 0.5◦
in the off-equatorial regions (5◦
–15◦
) and 1◦
BGD
5, 3267–3305, 2008DON and PON in the equatorial Pacific
X. J. Wang et al.
Title Page
Abstract Introduction
Conclusions References
Tables Figures
◭ ◮
◭ ◮
Back Close
Full Screen / Esc
Printer-friendly Version
Interactive Discussion and northern boundaries.
The model is forced by solar radiation, cloudiness, surface wind stress, and pre-cipitation. The air temperature and humidity are computed by the atmospheric mixed layer model. The solar radiation, precipitation, and cloudiness are climatologic monthly means. The surface wind stresses are 6-day means from the NCEP reanalysis (Kalnay 5
et al., 1996). Wind-speeds are computed from wind-stresses, resulting in interannual wind forcing and latent and sensible heat fluxes which are the most important surface forcings at interannual time-scales in the equatorial Pacific. Initial conditions are taken from a climatological run, which has been spun up for 30 years with initial conditions from the WOA98 atlas (http://www.nodc.noaa.gov/OC5/data woa.html). We then per-10
form an interannual run starting from 1948, and use model outputs from the period of 1990–2007 for our analyses.
The biogeochemical model, modified from that of Wang et al. (2006b), consists of three nutrients: nitrate, ammonium, and dissolved iron, and seven biological pools: small (S) and large (L) sizes of phytoplankton (PS and PL), zooplankton (ZS and ZL) 15
and detritus (DS and DL), and dissolved organic nitrogen (DON) (Fig. 12). All bio-geochemical variables are computed in a similar manner to physical fields for all 20 layers without restoration. The biological source/sink term is calculated by the equa-tions given in Appendix A. Model biological parameters are given in Table 1. Modeled total inorganic nitroegen (TIN) is a sum of nitrate and ammonium whereas modeled 20
PON is estimated as a sum of phytoplankton, small zooplankton, and detritus:
PON=PS+PL+ZS+DS+DL.
3 Results
3.1 Model-data comparisons
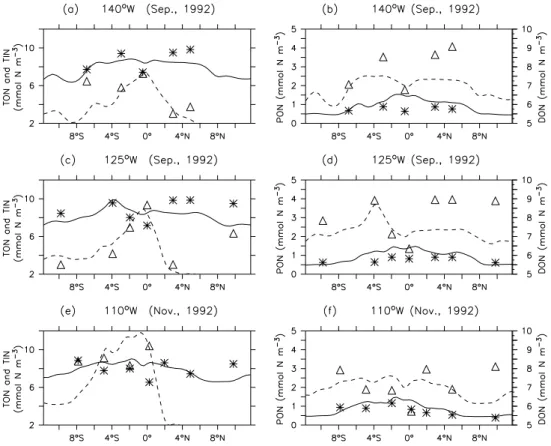
Figure 1 presents the comparisons of surface TON, TIN, DON and PON between the 25
BGD
5, 3267–3305, 2008DON and PON in the equatorial Pacific
X. J. Wang et al.
Title Page
Abstract Introduction
Conclusions References
Tables Figures
◭ ◮
◭ ◮
Back Close
Full Screen / Esc
Printer-friendly Version
Interactive Discussion modeled surface TON and TIN show good agreement with observations in the eastern
equatorial Pacific (Libby and Wheeler, 1997). For example, model simulations cap-ture the observed meridional variations of surface TIN, which is the highest on the equator, and relatively higher to the south than to the north. While the model simu-lates reasonable surface TON concentrations, the model underestimates the surface 5
DON concentrations especially north of the equator along 140◦W and 125◦W. Modeled
PON concentration is slightly higher than the observed on the equator. Interestingly, the magnitude and meridional variation of PON (∼0.5 mmol N m−3 offthe equator and ∼1 mmol N m−3on the equator) from the model are similar to those measured at 135◦W
during April 1988 (Pena et al., 1991). 10
Hydrological and biological data were collected along 150◦W during November 1994
in the equatorial Pacific (Raimbault et al., 1999), which allows us to further validate the biogeochemical model. Here, we present model simulations of nitrate, ammonium, DON and PON for the same period, to compare with those presented in their Figs. 4 and 5. Our model does not have other inorganic nitrogen pools such as nitrite and 15
urea so we expect that modeled nitrate concentration may be slightly higher than in situ nitrate concentration. Model simulations capture some of the observed features, as documented by Raimbault et al. (1999), for nitrate and ammonium (Fig. 2), including the deep ammonium maximum at∼100 m, and the asymmetric features of nitrate and
ammonium. The model simulates a relatively uniformly-distributed DON and PON in 20
the upper 100 m, which is consistent with observations. For instance, modeled surface DON variations (4.5–7 mmol m−3) are similar to the observed values (5–6.5 mmol m−3).
However, modeled surface PON variations (0.3–1.2 mmol m−3) are considerably larger
than the observed (0.3–0.6 mmol m−3
), which may be partly due to the inclusion of zooplankton (see discussion in the Sect. 4.1).
25
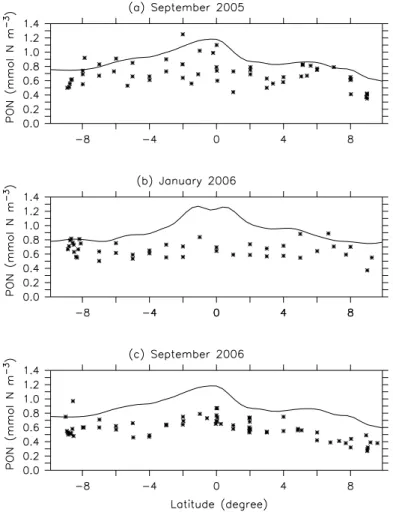
Recent observations show that the near surface (3 m) PON concentrations range from 0.5 to 1 mmol m−3
with slightly higher values near the equator along 125◦
W– 140◦W (Fig. 3). These recent data also show considerable short-term variations (e.g.,
pos-BGD
5, 3267–3305, 2008DON and PON in the equatorial Pacific
X. J. Wang et al.
Title Page
Abstract Introduction
Conclusions References
Tables Figures
◭ ◮
◭ ◮
Back Close
Full Screen / Esc
Printer-friendly Version
Interactive Discussion sibility of a diel cycle. It is not meaningful to inter-compare the model and data at
shorter than weekly time-scales since the model is forced by weekly mean surface conditions. Here, we show monthly mean concentrations of mixed layer PON from the model. The modeled PON concentrations (0.8–1.2 mmol m−3) in the mixed layer are
systematically higher than the measured PON concentration near the surface. We will 5
further discuss the issues of model-data and data-data comparisons in the Discussion section.
3.2 Spatial distributions and seasonal variability
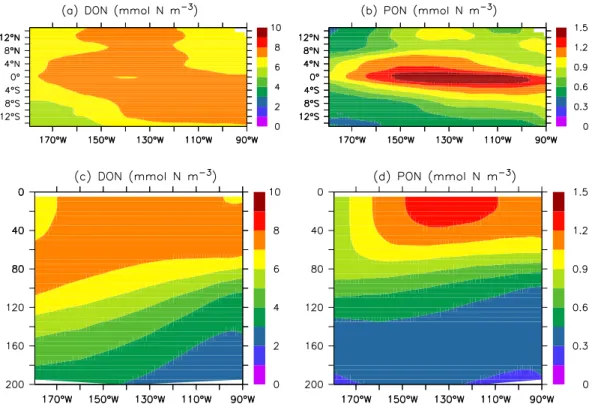
Figure 4 shows the climatology (1990–2007) of the mixed layer and vertical distribu-tions of DON and PON from the model. Model simuladistribu-tions show small zonal and 10
meridional variations in the mixed layer DON (5–7 mmol m−3), which is di
fferent to most of the other biogeochemical parameters such as phytoplankton and zooplank-ton biomass, primary productivity or new production (e.g., Wang et al., 2006b). Model simulations show little change in the mixed layer DON concentrations from 150◦W to
140◦W–125◦W, which rules out the possible responsibility of spatial variability for the
15
reported DON differences between along 150◦
W during November 1994 (Raimbault et al., 1999) and along 125◦W and 140◦W during September–November 1992 (Libby
and Wheeler, 1997).
Modeled surface PON shows considerable spatial variability with the highest concen-trations revealed along the equator, which is similar to those of phytoplankton and zoo-20
plankton biomass, primary productivity and new production (e.g., Wang et al., 2006b). Similar meridional variations have been found in the in situ surface PON in 1988 (Pena et al., 1991) and 2005–2006 (Fig. 3), and in the satellite-derived surface particulate organic carbon (POC) in the equatorial Pacific (Gardner et al., 2006). The subsurface DON shows relatively higher concentrations in the central equatorial Pacific then in the 25
BGD
5, 3267–3305, 2008DON and PON in the equatorial Pacific
X. J. Wang et al.
Title Page
Abstract Introduction
Conclusions References
Tables Figures
◭ ◮
◭ ◮
Back Close
Full Screen / Esc
Printer-friendly Version
Interactive Discussion weak wind mixing (Cronin and Kessler, 2002), and the upwelling season with strong
winds in boreal fall. Our previous studies have shown seasonal patterns and asym-metric features in physical and biogeochemical fields. This study shows marked diff er-ences in the seasonal variations of the mixed layer DON and PON between the north band (5◦
N–0◦
) and south band (0◦
–5◦
S) (Fig. 5). In the north band, modeled iron, 5
DON and PON concentrations show considerable seasonal variations in the mixed layer (∼10 nmol m−3,∼1 mmol m−3and>0.3 mmol m−3in amplitude, respectively) with
the highest values in boreal spring in the central equatorial Pacific. In contrast, there is a strong seasonality in the mixed layer iron concentration (>20 nmol m−3
) with the high-est values in boreal summer/fall in the south band of the eastern equatorial Pacific. 10
While high concentrations of DON and PON coincide with high iron concentrations, the seasonality is relatively weak in the mixed layer DON (∼1 mmol m−3) and PON
(<0.3 mmol m−3) given the strong seasonality in the mixed layer iron concentration.
Figure 6 presents the simulated mixed layer depth (MLD), the 20◦C isotherm depth
(Z20), and DON profiles along 150◦
W and 110◦
W during boreal spring (March–May) 15
and fall (September–November). Clearly, there are pronounced asymmetries in MLD and Z20. Asymmetric features have been found in nitrate, silicate, dissolved inorganic carbon, and sea surfacepCO2 in the equatorial Pacific (Feely et al., 1997; Jiang and
Chai, 2005; Murray et al., 1995; Archer et al., 1997; Dugdale et al., 2002), which may be largely associated with the asymmetries in mass exchanges between the equa-20
torial and off-equatorial Pacific Ocean (Kug et al., 2003). However, modeled DON reveals weak to moderate asymmetric features in the upper 200 m. Model simulations show subsurface DON maxima offthe equator, which has been observed along 150◦W
(Raimbault et al., 1999). In general, DON concentrations below 120 m are lower on the equator than offthe equator particularly in the eastern equatorial Pacific, which may 25
reflect upwelling of low-DON waters from deep layers.
BGD
5, 3267–3305, 2008DON and PON in the equatorial Pacific
X. J. Wang et al.
Title Page
Abstract Introduction
Conclusions References
Tables Figures
◭ ◮
◭ ◮
Back Close
Full Screen / Esc
Printer-friendly Version
Interactive Discussion et al., 1992). The subsurface PON maxima appear when the off-equatorial MLD is
relatively shallow. Unlike DON, PON concentrations below 120 m are higher on the equator than off the equator along 110◦W, indicating enhanced biological activities,
and thus PON accumulations in association with upwelling. While upwelling may bring PON-poor waters from the deep ocean into the surface (Pena et al., 1991), this study 5
shows that biological accumulations exceed physical removals in the equatorial up-welling regions.
3.3 Interannual variability
The equatorial Pacific is known to undergo significant changes of physical and bio-geochemical properties at interannual time-scales, which are associated with the El 10
Ni ˜no/Southern Oscillation (ENSO). Our previous studies have shown significant inter-annual variations in phytoplankton and zooplankton biomass, primary productivity, new production, export production, net community production, and sea-air CO2exchanges
(Wang et al., 2005a, 2006a and b). Here, we present model simulations of DON and PON for the period of 1990–2007. Following our early studies, we employ an annual 15
mean longitude of the HNLC front estimated from the Southern Oscillation Index (SOI): 173.2–10.75 SOI (Le Borgne et al., 2002). The SOI values are annual means of the standardized Tahiti minus Darwin sea-level pressures obtained from the Climate Pre-diction Centre (http://www.cpc.ncep.noaa.gov).
Figure 8 presents the time series of iron, DON and PON concentrations in the mixed 20
layer (averaged over 5◦N–5◦S), together with the estimated HNLC front. Overall, there
is a weak relationship between DON and iron concentration in the mixed layer. How-ever, the mixed layer PON shows similar spatial and temporal variations to the mixed layer iron concentration. The model simulates a narrow range for the mixed layer DON (6–8 mmol m−3
) in the HNLC region. Interestingly, modeled mixed layer DON concen-25
trations are similar between fall, 1992 and fall, 1994, ruling out the possible responsi-bility of interannual variaresponsi-bility for the reported DON differences between along 150◦W
during November, 1994 (Raimbault et al., 1999) and along 125◦
W and 140◦
BGD
5, 3267–3305, 2008DON and PON in the equatorial Pacific
X. J. Wang et al.
Title Page
Abstract Introduction
Conclusions References
Tables Figures
◭ ◮
◭ ◮
Back Close
Full Screen / Esc
Printer-friendly Version
Interactive Discussion September–November 1992 (Libby and Wheeler, 1997).
The mixed layer PON concentration ranges from 0.5 to 1.5 mmol m−3
in the HNLC region, varying approximately by a factor of 3. The temporal variations in the mixed layer DON and PON are smaller than most of the other biogeochemical parameters reported (varying by a factor of 3 to 10), including nutrients, chlorophyll, phytoplankton 5
and zooplankton biomass, new production and export production (Chavez et al., 1999; McClain et al., 2002; Murtugudde et al., 1999; Wang et al., 2005a, 2006b).
Considering the differences in the DON and PON asymmetries between the eastern and central equatorial Pacific, we separate our analyses into four regions: the north-central (NCP: 5◦N–0◦, 150◦W), the south-central (SCP: 0◦–5◦S, 150◦W), the
north-10
eastern (NEP: 5◦N–0◦, 110◦W), and the south-eastern equatorial Pacific (SEP: 0◦–
5◦
S, 110◦
W). Model simulations show considerable seasonal-to-interannual variations in the mixed layer iron concentration (Figs. 5 and 8) and the ferricline (defined as the depth where iron concentration=125 nmol m−3) in all the regions (Fig. 9). Apparently,
the surface DON has little or weak relationships with the surface iron concentration in 15
all the four regions (Fig. 9). However, the subsurface DON varies with the ferricline: low DON concentration corresponding to a shallow ferricline. Statistical analyses indicate that the DON concentration at 120 m has highly significant (r>0.77,p<0.001) correla-tions with the Z20, indicating strong implicacorrela-tions of physical transport (i.e., upwelling of low-DON waters) for the subsurface DON variability in these regions.
20
Figure 10 shows depth-time distributions of PON and iron concentrations. The sur-face PON reveals moderate seasonal variations, except in the SCP. Unlike the sursur-face DON, the temporal variations in the surface PON are consistent with those of the sur-face iron concentration. Overall, the sursur-face PON shows considerab interannual vari-ations with low concentrvari-ations (<0.6 mmol m−3) during the warm ENSO events (e.g.,
25
BGD
5, 3267–3305, 2008DON and PON in the equatorial Pacific
X. J. Wang et al.
Title Page
Abstract Introduction
Conclusions References
Tables Figures
◭ ◮
◭ ◮
Back Close
Full Screen / Esc
Printer-friendly Version
Interactive Discussion 4 Discussion
4.1 Model-data and data-data comparisons
There are generally good agreements in the magnitudes, meridional and vertical dis-tributions between the modeled PON and observed PON. Interestingly, the simulated surface PON peak on the equator was not observed in boreal fall 1992 (Libby and 5
Wheeler, 1997) or in boreal fall 1994 (Raimbault et al., 1999), but was observed in April 1988 (Pena et al., 1991, 1992) and in 2005–2006 (Fig. 3). The recent obser-vations (at 3 m depth) show slightly higher PON concentrations along 140◦W–125◦W
near the equator. These recent data also show some indication of diel cycle in the sur-face PON (Fig. 11a). For instance, high sursur-face PON concentrations (>1 mmol m−3
) 10
are normally found before sunrise, which may reflect zooplankton migration to the top few meters during the night (Champalbert et al., 2003). Our model does not simulate zooplankton vertical migration. Here, we assume that zooplankton do not appear in near surface waters so modeled PON only consists of phytoplankton and detritus. This assumption leads to a better agreement between the modeled PON and measured 15
PON (Fig. 11b). However, zooplankton alone can not explain the observed PON vari-ability. Apparently, more studies, both field measurements and modeling, are needed to better understand the spatial and temporal variability.
The modeled surface DON concentrations are≈2 mmol m−3lower than those from
observations along 140◦W and 125◦W during September 1992 (Fig. 1). However, there
20
is generally good agreement in the vertical-meridional distributions between modeled and measured DON along 150◦
W during November 1994 though the model overesti-mates the surface DON on the equator. There have been only two field studies of DON distribution in the equatorial Pacific which show approximately 2 mmol m−3higher
sur-face DON concentration along 125◦
W and 140◦
W during September–November, 1992 25
(Libby and Wheeler, 1997) than along 150◦W during November, 1994 (Raimbault et al.,
1999). While there are no other in situ DON data in the equatorial Pacific, a field study shows that the surface TON concentrations are less than 6 mmol m−3
along 103◦
BGD
5, 3267–3305, 2008DON and PON in the equatorial Pacific
X. J. Wang et al.
Title Page
Abstract Introduction
Conclusions References
Tables Figures
◭ ◮
◭ ◮
Back Close
Full Screen / Esc
Printer-friendly Version
Interactive Discussion 110◦W in boreal spring 1994 (Hansell and Waterhouse, 1997), suggesting that the
surface DON concentration might be close to those reported by Raimbault et al. (1999). There have been reports of DON concentration in other parts of the ocean, showing a narrow range (4 to 7 mmol m−3) in a majority of the surface open ocean (Bronk, 2002;
Aminot and Kerouel, 2004; Davis and Benner, 2005; Kahler and Koeve, 2001; Wong 5
et al., 2002; Church et al., 2002). As Bronk (2002) summarized, the averaged DON concentration in the surface open ocean is 5.8 mmol m−3 with a standard deviation of
2 mmol m−3
. There are a few studies showing relatively high DON concentrations (e.g., surface DON>7 mmol m−3) (Bronk, 2002; Vidal et al., 1999). In the field, DON
con-centration is often obtained by subtracting TIN and PON from total nitrogen (TN) of 10
unfiltered water samples (Libby and Wheeler, 1997; Raimbault et al., 1999), or by the difference between TN and TIN in filtered water samples (Aminot and Kerouel, 2004; Davis and Benner, 2005). Therefore, in some published studies, the in situ DON pool may represent a small portion of other materials such as living matter and small de-tritus. Moreover, different approaches may yield inconsistent results because of the 15
potential biases associated with the estimates of TON, PON, TN and TIN and uncer-tainties dealing with sample handling and analyzing. For instance, Vidal et al. (1999) reported relatively high DON concentrations (5–11 mmol m−3) with a subsurface
maxi-mum in the central equatorial Atlantic due to exclusion of ammonium in TIN measure-ments. Clearly, more field studies, including development of improved techniques to 20
measure DON and large scale observations, are in need for model development and validation.
4.2 Spatial and temporal variations
The equatorial Pacific experiences significant seasonal to interannual physical forc-ings. Numerous studies have demonstrated that ENSO is the dominant mode regu-25
BGD
5, 3267–3305, 2008DON and PON in the equatorial Pacific
X. J. Wang et al.
Title Page
Abstract Introduction
Conclusions References
Tables Figures
◭ ◮
◭ ◮
Back Close
Full Screen / Esc
Printer-friendly Version
Interactive Discussion parameters, including nutrients, phytoplankton and zooplankton biomass, primary
pro-ductivity, new production, export production, and sea-air CO2exchanges (Wang et al., 2006a and b).
Limited observations show considerable meridional, zonal and vertical variations in PON in the central and eastern equatorial Pacific (Libby and Wheeler, 1997; Pena et 5
al., 1991, 1992; Raimbault et al., 1999). Our model simulations show significant spatial and temporal variations in PON in the central and eastern equatorial Pacific. Spatially, the highest PON concentrations are found along the equator in the surface waters of the eastern equatorial Pacific, which is similar to the spatial patterns of phytoplank-ton, zooplankphytoplank-ton, primary production, and new production (Wang et al., 2006b). On 10
average, the mixed layer PON ranges from∼0.5 mmol m−3during the extremely warm
ENSO events to>1 mmol m−3
during the cold ENSO phase. To quantify the temporal variability, we conducted One Way Analyses of Variance (ANOVA; Storch and Zwiers, 2003) followed by the Least Significant Difference (LSD) test for both in situ PON and modeled PON. Table 3 shows that measured and modeled surface PON concentra-15
tions follow the same order: September 2005>January 2006>September 2006. The differences in both measured and modeled surface PON are significant (e.g., greater than the LSDs) among the three periods. At the interannual time scale, high surface PON coincides with high SOI. For instance, both SOI and surface PON concentrations are higher during September 2005 than during September 2006. The significant dif-20
ferences in surface PON between September 2005 and January 2006 reflect seasonal variability in the eastern equatorial Pacific (e.g., high PON during boreal fall).
While there are relatively few DON measurements in the equatorial Pacific, there is evidence of the surface DON varying spatially by less than a factor of two. This modeling study and other regional in situ data (see summary in Bronk, 2002) suggest 25
BGD
5, 3267–3305, 2008DON and PON in the equatorial Pacific
X. J. Wang et al.
Title Page
Abstract Introduction
Conclusions References
Tables Figures
◭ ◮
◭ ◮
Back Close
Full Screen / Esc
Printer-friendly Version
Interactive Discussion differences in the surface DON concentration between Libby and Wheeler (1997) and
Raimbault et al. (1999) result from the spatial or temporal variability.
4.3 Relationships to other parameters
Researches have indicated that phytoplankton and zooplankton are responsible for DON and PON variations in the euphotic zone (Davis and Benner, 2005; Aminot and 5
Kerouel, 2004; Bronk, 2002). Many studies have shown that phytoplankton and zoo-plankton biomass are affected by physical and biogeochemical conditions such as up-welling intensity, nutrient concentration and nutricline (Wang et al., 2005a, 2006b; Le Borgne et al., 1999, 2003), suggesting implications for the DON and PON variability.
Here, we examine the relationships of mixed layer DON and PON with the Z20, mixed 10
layer iron concentration, ferricline, phytoplankton and zooplankton in four different re-gions. Statistical analyses indicate that the mixed layer DON has no relationship with Z20 or ferricline in three of four regions (Table 3). The positive correlation (0.15) of the mixed layer DON and Z20 in the SCP reflect the significance of upwelling of low-DON deep waters into the surface layer (Libby and Wheeler, 1997). In contrast, the mixed 15
layer PON has significant negative correlations with Z20 and ferricline in three of four regions, indicating that strong upwelling (e.g., shallow Z20 and ferricline) results in high surface PON concentrations.
Overall, the mixed layer DON and PON have significant positive correlations with the mixed layer iron concentration (except north of the equator), phytoplankton and 20
zooplankton. Interestingly, the relationships with phytoplankton and zooplankton are much stronger for PON than for DON. While both phytoplankton and zooplankton are key players for DON and PON abundance in the euphotic zone (Davis and Benner, 2005; Aminot and Kerouel, 2004; Bronk, 2002), upwelling of deep waters into the euphotic zone has larger impacts on DON than PON (Table 3). As a result, local 25
BGD
5, 3267–3305, 2008DON and PON in the equatorial Pacific
X. J. Wang et al.
Title Page Abstract Introduction Conclusions References Tables Figures ◭ ◮ ◭ ◮ Back Close
Full Screen / Esc
Printer-friendly Version
Interactive Discussion of DON and PON with phytoplankton and zooplankton indicate that biological effects
exert physical influences in controlling the distributions of organic nitrogen (Hansell and Waterhouse, 1997).
Appendix A 5
Biogeochemical equations
A1 Phytoplankton equations:
∂PS
∂t =µSPS−gP S
1−e−ΛPS
ZS−mSPS (A1)
∂PL
∂t =µLPL−gP L1
1−e−ΛPL
ZL−gP L2
1−e−ΛPL
ZS−mLPL (A2)
A2 Zooplankton equations: 10
∂ZS ∂t =
h
λgP S
1−e−ΛPS
+gP L2
1−e−ΛPL
+gDS
1−e−ΛDS
+gDL2
1−e−ΛDL
−(rS +δS) i
ZS −gZ S
1−e−ΛZS
ZL (A3)
∂ZL ∂t =
h
λgP L1
1−e−ΛPL
+gZ S
1−e−ΛZS
+gDL1
1−e−ΛDL
−(rL+δL) i
ZL (A4)
A3 DON equation
∂DON
∂t =(mSPS +mLPL+(rSZS +rLZL)χ)γ+(cDSDS +cDLDL)ζ−cDONDON (A5)
BGD
5, 3267–3305, 2008DON and PON in the equatorial Pacific
X. J. Wang et al.
Title Page Abstract Introduction Conclusions References Tables Figures ◭ ◮ ◭ ◮ Back Close
Full Screen / Esc
Printer-friendly Version
Interactive Discussion A4 Detritus equations:
∂DS
∂t =(mSPS+mLPL+(rSZS+rLZL)χ) (1−γ)
−gDS
1−e−ΛDS
ZS −
cDS+wDSh−1D
S (A6)
∂DL
∂t =(1−λ)
h
gP S
1−e−ΛPS
+gP L2
1−e−ΛPL
ZS
+gP L1
1−e−ΛPL
+gZ S
1−e−ΛZS
ZL i 5
+δSZS+δLZL−
cDL+wDLh−1D
L−gDL2
1−e−ΛDL
ZS
−gDL1
1−e−ΛDL
ZL (A7)
A5 Nutrient equations:
∂NO3
∂t =−µSPS
NS UP NS UP+AUP
−µLPL
NL UP NL UP+AUP
+ϕNH4 (A8)
∂NH4
∂t =−µSPS
Aup
NS UP+AUP
−µLPL
Aup
NL UP+AUP
+(rSZS+rLZL) (1−χ)
10
+cDONDON+(cDSDS+cDLDL) (1−ζ)−ϕNH4 (A9)
∂Fe
∂t =−(µSPSRS+µLPLRL−sFeDLFe)+RS[(rSZS+rLZL) (1−χ)
+cDONDON+cDSDS +cDLDL(1−ζ)
BGD
5, 3267–3305, 2008DON and PON in the equatorial Pacific
X. J. Wang et al.
Title Page
Abstract Introduction
Conclusions References
Tables Figures
◭ ◮
◭ ◮
Back Close
Full Screen / Esc
Printer-friendly Version
Interactive Discussion A6 Other equations:
A6.1 Phytoplankton growth rate:
µS=µS0ekTTf (I)ψS(N,Fe) (A11)
µL=µL0ekTTf(I)ψL(N,Fe) (A12)
A6.2 Nutrient limitation: 5
ψS(N,Fe)=min
NO
3+NH4 KS N+NO3+NH4
, Fe
KS Fe+Fe
(A13)
ψL(N,Fe)=min
NO
3+NH4 KLN+NO3+NH4
, Fe
KLFe+Fe
(A14)
A6.3 Light limitation:
f(I)=1−e
−ηPαIc
max (A15)
A6.4 Light attenuation: 10
I(z)= I0exp−kAZ (A16)
kA= kW+kCChl+kD(DS+DL) (A17)
A6.5 Carbon to chlorophyll ratio (η):
Chl=
P S
ηS
+PL
ηL
RC:N (A18)
ηS =ηS0−(ηS0−ηMIN)
lnI0−lnI
4.605 (A19)
BGD
5, 3267–3305, 2008DON and PON in the equatorial Pacific
X. J. Wang et al.
Title Page Abstract Introduction Conclusions References Tables Figures ◭ ◮ ◭ ◮ Back Close
Full Screen / Esc
Printer-friendly Version
Interactive Discussion
ηL=ηL0−(ηL0−ηMIN)
lnI0−lnI
4.605 (A20)
ηS0=ηS MAX−kP Sµ∗S (A21)
ηL0=ηL MAX−kP Lµ∗L (A22)
µ∗
S =µS0e kTT
min
NO
3 KS N+NO3
, Fe
KS Fe+Fe
(A23)
µ∗
L=µL0ekTTmin
NO
3 KLN+NO3,
Fe
KL Fe+Fe
(A24) 5
A6.6 Nitrogen uptake:
NS UP=
NO3
KS NO
3+NO3 1−
NH4 KNH4+NH4
!
(A25)
NL UP=
NO3
KL NO
3+NO3 1−
NH4 KNH
4+NH4 !
(A26)
AUP= NH4
KNH
4+NH4
(A27)
A6.7 DON remineralization: 10
cDON=cDON0ekB(T−26) (A28)
A6.8 Detritus decomposition:
cDS=cDS0ekB(T−26) (A29)
BGD
5, 3267–3305, 2008DON and PON in the equatorial Pacific
X. J. Wang et al.
Title Page
Abstract Introduction
Conclusions References
Tables Figures
◭ ◮
◭ ◮
Back Close
Full Screen / Esc
Printer-friendly Version
Interactive Discussion Acknowledgements. This work is supported by grants from the National Aeronautics and
Space Administration. We thank J. Arrington for the in situ PON measurements.
References
Aminot, A. and Kerouel, R.: Dissolved organic carbon, nitrogen and phosphorus in the N-E Atlantic and the N-W Mediterranean with particular reference to non-refractory fractions and
5
degradation, Deep-Sea Res. Pt. I, 51, 1975–1999, 2004.
Archer, D., Aiken, J., Balch, W., Barber, D., Dunne, J., Flament, P., Gardner, W., Garside, C., Goyet, C., Johnson, E., Kirchman, D., McPhaden, M., Newton, J., Peltzer, E., Welling, L., White, J., and Yoder, J.: A meeting place of great ocean currents: shipboard observations of a convergent front at 2 degrees N in the Pacific, Deep-Sea Res. Pt. II, 44, 1827–1849, 1997.
10
Behrenfeld, M. J., Worthington, K., Sherrell, R. M., Chavez, F. P., Strutton, P., McPhaden, M., and Shea, D. M.: Controls on tropical Pacific Ocean productivity revealed through nutrient stress diagnostics, Nature, 442, 1025–1028, 2006.
Bronk, D. A.: Dynamics of DON, in: Biogeochemistry of Marine Dissolved Organic Matter, edited by: Hansell, D. A. and Carlson, C. A., Academic Press, San Diego, USA, 153–247,
15
2002.
Chai, F., Dugdale, R. C., Peng, T. H., Wilkerson, F. P., and Barber, R. T.: One-dimensional ecosystem model of the equatorial Pacific upwelling system. Part I: model development and silicon and nitrogen cycle, Deep-Sea Res. Pt. II, 49, 2713–2745, 2002.
Champalbert, G., Neveux, J., Gaudy, R., and Le Borgne, R.: Diel variations of copepod feeding
20
and grazing impact in the high-nutrient, low-chlorophyll zone of the equatorial Pacific Ocean (0◦; 3◦S, 180◦), J. Geophys. Res.-Oceans, 108, 8145, doi:10.1029/2001JC000810, 2003.
Chavez, F. P., Strutton, P. G., Friederich, C. E., Feely, R. A., Feldman, G. C., Foley, D. C., and McPhaden, M. J.: Biological and chemical response of the equatorial Pacific Ocean to the 1997–98 El Nino, Science, 286, 2126–2131, 1999.
25
Chen, D., Rothstein, L. M., and Busalacchi, A. J.: A hybrid vertical mixing scheme and its application to tropical ocean models, J. Phys. Oceanogr., 24, 2156–2179, 1994.
Christian, J. R., Verschell, M. A., Murtugudde, R., Busalacchi, A. J., and McClain, C. R.: Bio-geochemical modelling of the tropical Pacific Ocean – 1: Seasonal and interannual variability, Deep-Sea Res. Pt. II, 49, 509–543, 2002.
BGD
5, 3267–3305, 2008DON and PON in the equatorial Pacific
X. J. Wang et al.
Title Page
Abstract Introduction
Conclusions References
Tables Figures
◭ ◮
◭ ◮
Back Close
Full Screen / Esc
Printer-friendly Version
Interactive Discussion
Church, M. J., Ducklow, H. W., and Karl, D. M.: Multiyear increases in dissolved organic matter inventories at station ALOHA in the North Pacific Subtropical Gyre, Limnol. Oceanogr., 47, 1–10, 2002.
Coale, K. H., Fitzwater, S. E., Gordon, R. M., Johnson, K. S., and Barber, R. T.: Control of community growth and export production by upwelled iron in the equatorial Pacific Ocean,
5
Nature, 379, 621–624, 1996.
Cronin, M. F. and Kessler, W. S.: Seasonal and interannual modulation of mixed layer variability at 0◦, 110◦W, Deep-Sea Res. Pt. I, 49, 1–17, 2002.
Davis, J., and Benner, R.: Seasonal trends in the abundance, composition and bioavailability of particulate and dissolved organic matter in the Chukchi/Beaufort Seas and western Canada
10
Basin, Deep-Sea Res. Pt. II, 52, 3396–3410, 2005.
Dugdale, R. C. and Wilkerson, F. P.: Silicate regulation of new production in the equatorial Pacific upwelling, Nature, 391, 270–273, 1998.
Dugdale, R. C., Wischmeyer, A. G., Wilkerson, F. P., Barber, R. T., Chai, F., Jiang, M. S., and Peng, T. H.: Meridional asymmetry of source nutrients to the equatorial Pacific upwelling
15
ecosystem and its potential impact on ocean-atmosphere CO2 flux; a data and modeling approach, Deep-Sea Res. Pt. II, 49, 2513–2531, 2002.
Eppley, R. W., Chavez, F. P., and Barber, R. T.: Standing stocks of particulate carbon and nitrogen in the Equatorial Pacific at 150-Degrees-W, J. Geophys. Res.-Oceans, 97, 655– 661, 1992.
20
Feely, R. A., Wanninkhof, R., Goyet, C., Archer, D. E., and Takahashi, T.: Variability of CO2 distributions and sea-air fluxes in the central and eastern equatorial pacific during the 1991– 1994 El Ni ˜no, Deep-Sea Res. Pt. II, 44, 1851–1867, 1997.
Feely, R. A., Wanninkhof, R., Takahashi, T., and Tans, P.: Influence of El Nino on the equatorial Pacific contribution to atmospheric CO2accumulation, Nature, 398, 597–601, 1999.
25
Feely, R. A., Boutin, J., Cosca, C. E., Dandonneau, Y., Etcheto, J., Inoue, H. Y., Ishii, M., Quere, C. L., Mackey, D. J., and McPhaden, M.: Seasonal and interannual variability of CO2in the equatorial Pacific, Deep-Sea Res. Pt. II, 49, 2443–2469, 2002.
Feely, R. A., Takahashi, T., Wanninkhof, R., McPhaden, M. J., Cosca, C. E., Sutherland, S. C., and Carr, M. E.: Decadal variability of the air-sea CO2fluxes in the equatorial Pacific Ocean,
30
Journal of Geophysical Research-Oceans, 111, C08S90, doi:10.1029/2005JC003129, 2006.
BGD
5, 3267–3305, 2008DON and PON in the equatorial Pacific
X. J. Wang et al.
Title Page
Abstract Introduction
Conclusions References
Tables Figures
◭ ◮
◭ ◮
Back Close
Full Screen / Esc
Printer-friendly Version
Interactive Discussion
and satellite data, Deep-Sea Res. Pt. II, 53, 718–740, 2006.
Gent, P. R. and Cane, M. A.: A reduced gravity, primitive equation model of the upper Equatorial Ocean, J. Comput. Phys., 81, 444–480, 1989.
Hansell, D. A. and Waterhouse, T. Y.: Controls on the distributions of organic carbon and nitrogen in the eastern Pacific Ocean, Deep-Sea Res. Pt. I, 44, 843–857, 1997.
5
Jiang, M. S. and Chai, F.: Physical and biological controls on the latitudinal asymmetry of surface nutrients andpCO2 in the central and eastern equatorial Pacific, J. Geophys. Res.-Oceans, 110, C06007, doi:10.1029/2004JC002715, 2005.
Kahler, P. and Koeve, W.: Marine dissolved organic matter: can its C:N ratio explain carbon overconsumption?, Deep-Sea Res. Pt. I, 48, 49–62, 2001.
10
Kalnay, E., Kanamitsu, M., Kistler, R., Collins, W., Deaven, D., Gandin, L., Iredell, M., Saha, S., White, G., Woollen, J., Zhu, Y., Chelliah, M., Ebisuzaki, W., Higgins, W., Janowiak, J., Mo, K. C., Ropelewski, C., Wang, J., Leetmaa, A., Reynolds, R., Jenne, R., and Joseph, D.: The NCEP/NCAR 40-year reanalysis project, B. Am. Meteorol. Soc., 77, 437–471, 1996.
Kug, J. S., Kang, I. S., and An, S. I.: Symmetric and antisymmetric mass exchanges between
15
the equatorial and off-equatorial Pacific associated with ENSO, J. Geophys. Res.-Oceans, 108, 3284, doi:10.1029/2002JC001671, 2003.
Landry, M. R., Barber, R. T., Bidigare, R. R., Chai, F., Coale, K. H., Dam, H. G., Lewis, M. R., Lindley, S. T., McCarthy, J. J., Roman, M. R., Stoecker, D. K., Verity, P. G., and White, J. R.: Iron and grazing constraints on primary production in the central equatorial Pacific – an
20
EqPac synthesis, Limnol. Oceanogr., 42, 405–418, 1997.
Landry, M. R. and Kirchman, D. L.: Microbial community structure and variability in the tropical Pacific, Deep-Sea Res. Pt. II, 49, 2669–2693, 2002.
Le Borgne, R., Rodier, M., Le Bouteiller, A., and Murray, J. W.: Zonal variability of plankton and particle export flux in the equatorial Pacific upwelling between 165 degrees E and 150
25
degrees W, Oceanol. Acta, 22, 57–66, 1999.
Le Borgne, R., Barber, R. T., Delcroix, T., Inoue, H. Y., Mackey, D. J., and Rodier, M.: Pacific warm pool and divergence: temporal and zonal variations on the equator and their effects on the biological pump, Deep-Sea Res. Pt. II, 49, 2471–2512, 2002.
Le Borgne, R., Champalbert, G., and Gaudy, R.: Mesozooplankton biomass and
com-30
position in the equatorial Pacific along 180 degrees, J. Geophys. Res., 108, 8143, doi:10.1029/2001JC000745, 2003.
BGD
5, 3267–3305, 2008DON and PON in the equatorial Pacific
X. J. Wang et al.
Title Page
Abstract Introduction
Conclusions References
Tables Figures
◭ ◮
◭ ◮
Back Close
Full Screen / Esc
Printer-friendly Version
Interactive Discussion
trophic interactions in the equatorial Pacific (180 degrees), J. Geophys. Res., 108, 8136, doi:10.1029/2001JC001252, 2003.
Libby, P. S. and Wheeler, P. A.: Particulate and dissolved organic nitrogen in the central and eastern equatorial Pacific, Deep-Sea Res. Pt. I, 44, 345–361, 1997.
Martin, J. H., Coale, K. H., Johnson, K. S., Fitzwater, S. E., Gordon, R. M., Tanner, S. J., Hunter,
5
C. N., Elrod, V. A., Barber, R. T., Lindley, S., Watson, A. J., and Van Scoy, K.: Testing the iron hypothesis in ecosystems of the equatorial Pacific Ocean, Nature, 371, 123–129, 1994. McClain, C. R., Christian, J. R., Signorini, S. R., Lewis, M. R., Asanuma, I., Turk, D., and
Dupouy-Douchement, C.: Satellite ocean-color observations of the tropical Pacific Ocean, Deep-Sea Res. Pt. II, 49, 2533–2560, 2002.
10
McPhaden, M. J., Busalacchi, A. J., Cheney, R., Donguy, J. R., Gage, K. S., Halpern, D., Ji, M., Julian, P., Meyers, G., Mitchum, G. T., Niiler, P. P., Picaut, J., Reynolds, R. W., Smith, N., and Takeuchi, K.: The tropical ocean global atmosphere observing system: A decade of progress, J. Geophys. Res.-Oceans, 103, 14 169–14 240, 1998.
Murray, J. W., Johnson, E., and Garside, C.: A U.S. JGOFS process study in the equatorial
15
Pacific (EqPac): Introduction, Deep-Sea Res. Pt. II, 42, 275–293, 1995.
Murtugudde, R., Seager, R., and Busalacchi, A.: Simulation of the tropical oceans with an ocean GCM coupled to an atmospheric mixed-layer model, J. Climate, 9, 1795–1815, 1996. Murtugudde, R. G., Signorini, S. R., Christian, J. R., Busalacchi, A. J., McClain, C. R., and
Picaut, J.: Ocean color variability of the tropical Indo-Pacific basin observed by SeaWiFS
20
during 1997–1998, J. Geophys. Res., 104, 18 351–18 366, 1999.
Pena, M. A., Lewis, M. R., and Harrison, W. G.: Particulate organic-matter and chlorophyll in the surface layer of the equatorial Pacific Ocean along 135◦W, Mar. Ecol.-Prog. Ser., 72,
179–188, 1991.
Pena, M. A., Harrison, W. G., and Lewis, M. R.: New production in the central equatorial Pacific
25
Marine Ecology-Progress Series, 80, 265–274, 1992.
Raimbault, P., Slawyk, G., Boudjellal, B., Coatanoan, C., Conan, P., Coste, B., Garcia, N., Moutin, T., and Pujo-Pay, M.: Carbon and nitrogen uptake and export in the equatorial Pacific at 150 degrees W: Evidence of an efficient regenerated production cycle, J. Geophys. Res., 104, 3341–3356, 1999.
30
Vidal, M., Duarte, C. M., and Agusti, S.: Dissolved organic nitrogen and phosphorus pools and fluxes in the central Atlantic Ocean, Limnol. Oceanogr., 44, 106–115, 1999.
BGD
5, 3267–3305, 2008DON and PON in the equatorial Pacific
X. J. Wang et al.
Title Page
Abstract Introduction
Conclusions References
Tables Figures
◭ ◮
◭ ◮
Back Close
Full Screen / Esc
Printer-friendly Version
Interactive Discussion
Press, Cambridge, UK, 484 pp., 2003.
Wang, X. J., Christian, J., Murtugudde, R., and Busalacchi, A.: Ecosystem dynamics and export production in the central and eastern equatorial Pacific: a modeling study of impact of ENSO, Geophys. Res. Lett., 32, L02608, doi:10.1029/2004GL021538, 2005a.
Wang, X. J., Murtugudde, R., Busalacchi, A., and Le Borgne, R.: De-coupling of net community
5
production and new production in the equatorial Pacific ocean: a model study, Geophys. Res. Lett., 32, L21601, doi:10.1029/2005GL024100, 2005b.
Wang, X. J., Christian, J. R., Murtugudde, R., and Busalacchi, A. J.: Spatial and tem-poral variability of the surface water pCO2 and air-sea CO2 flux in the equatorial Pa-cific during 1980-2003: a basin-scale carbon model, J. Geophys. Res., 111, C07S04,
10
doi:10.1029/2005JC002972, 2006a.
Wang, X. J., Christian, J. R., Murtugudde, R., and Busalacchi, A. J.: Spatial and temporal variability in new production in the equatorial Pacific during 1980–2003: Physical and bio-geochemical controls, Deep-Sea Res. Pt. II, 53, 677–697, 2006b.
Wong, C. S., Yu, Z., Waser, N. A. D., Whitney, F. A., and Johnson, W. K.: Seasonal changes in
15
BGD
5, 3267–3305, 2008DON and PON in the equatorial Pacific
X. J. Wang et al.
Title Page Abstract Introduction Conclusions References Tables Figures ◭ ◮ ◭ ◮ Back Close
Full Screen / Esc
Printer-friendly Version
Interactive Discussion Table 1.Model biological parameters.
Parameter Symbol Unit Value
Maximum growth rate at 0◦C µ
S0 d− 1
0.58
µL0 d− 1
1.16 Temp. dependent coefficient forµ kT ◦C−1 0.06
Half saturation constant for N limitation KS N mmol m−3 0.2
KL N mmol m−
3
0.6 Half saturation constant for iron limitation KS Fe nmol m−
3
14
KL Fe nmol m− 3
150 Half saturation constant for nitrate uptake KS NO3 mmol m−3 0.3
KL NO3 mmol m−3 0.9
Half saturation constant for ammonium uptake KNH4 mmol m−3 0.05 Phytoplankton mortality rate mS d−
1
0.17
mL d−
1
0.31
Zooplankton excretion rate rS d−1 0.5
rL d−
1
0.4 Zooplankton mortality rate δS d−
1
0.12
δL d−
1
0.09
Maximum grazing rate gP S d−1 2.9
gP L1 d−1 1.2
gZ S d−
1
1.7
gP L2 d− 1
0.9
gDS d−
1
1.0
gDL1 d−1 1.5
gDL2 d−1 1.0
Ivlev coefficient Λ (mmol N m−3)−1 0.5 Zooplankton assimilation coefficient λ % 75
BGD
5, 3267–3305, 2008DON and PON in the equatorial Pacific
X. J. Wang et al.
Title Page
Abstract Introduction
Conclusions References
Tables Figures
◭ ◮
◭ ◮
Back Close
Full Screen / Esc
Printer-friendly Version
Interactive Discussion Table 1.Continued.
Parameter Symbol Unit Value
Initial slope of theP −Icurve α mg C mg chl−1h−1 0.02 (µmol E m−2s−1)−1
Maximum carbon specific growth rate PmaxC h−1 0.036
Minimum C:Chl ratio ηS min g:g 30
ηL min g:g 15
Maximum C:Chl ratio ηS max g:g 200
ηLmax g:g 120
Photoacclimation coefficient kP S (g:g)d 95
kP L (g:g) d 70
Light attenuation constant for water kW m−
1
0.028 Light attenuation constant for chlorophyll kC m−
1
(mg chl m−3)−1 0.058 Light attenuation constant for detritus kD m−
1
(mmol N m−3)−1 0.008
Sinking velocity wDS m d−1 1
wDL m d−1 3.5
Remineralization rate at 26◦C (0–100 m)c
DON0 d− 1
0.0025
(100–300 m) cDON0 d−1 0.0008–
0.0025
(>300 m) cDON0 d−1 0.0008
Decomposition rate cDS0 d−1 0.01
cDL0 d−1 0.01
Temp. dependent coefficient forc kB ◦C−
1
0.03 Iron scavenge coefficientsFe d−1 (nmol Fe m−3)−1 0.00001 Nitrification rate (whenI<5µmol E m−2s−1) φ d−1 0.04
Dissolution coefficient γ % 90
ζ % 90
C:N ratio RC:N mol mol−1 6.625
Fe:N ratio RS µmol mol−
1
25
RL µmol mol−
1
BGD
5, 3267–3305, 2008DON and PON in the equatorial Pacific
X. J. Wang et al.
Title Page
Abstract Introduction
Conclusions References
Tables Figures
◭ ◮
◭ ◮
Back Close
Full Screen / Esc
Printer-friendly Version
Interactive Discussion Table 2. Southern Oscillation Index (SOI), PON and DON concentrations (mmol m−3) in the
area of 140◦W–125◦W, 8◦N–8◦S, and the least significant di
fference (LSD) among three peri-ods.
Year Month SOI Data PON Model PON Model DON
2005 September 0.4 0.73 1.16 6.62
2006 January 1.8 0.67 1.12 6.72
2006 September −0.7 0.61 1.06 6.57
BGD
5, 3267–3305, 2008DON and PON in the equatorial Pacific
X. J. Wang et al.
Title Page
Abstract Introduction
Conclusions References
Tables Figures
◭ ◮
◭ ◮
Back Close
Full Screen / Esc
Printer-friendly Version
Interactive Discussion Table 3.Correlations (r) of the mixed layer DON and PON with Z20, ferricline, mixed layer iron
concentration, phytoplankton biomass (Phyto), and zooplankton biomass (Zoo) using monthly averages for the period of 1990–2007.
Region Z20 Ferricline Iron Phyto Zoo DON
NCP (5◦N–0◦, 150◦W)
−0.03 −0.11 0.00 0.50∗∗∗ 0.56∗∗∗ NEP (5◦N–0◦, 110◦W) 0.10
−0.06 −0.01 0.40∗∗∗ 0.18∗ SCP (0◦–5◦S, 150◦W) 0.15∗ 0.14 0.20∗∗ 0.48∗∗∗ 0.60∗∗∗
SEP (0◦–5◦S, 110◦W)
−0.01 0.18∗ 0.28∗∗ 0.66∗∗∗ 0.71∗∗∗ PON
NCP (5◦N–0◦, 150◦W)
−0.29∗∗ −0.34∗∗∗ 0.75∗∗∗ 0.66∗∗∗ 0.97∗∗∗ NEP (5◦N–0◦, 110◦W)
−0.38∗∗∗ −0.32∗∗∗ 0.69∗∗∗ 0.25∗∗ 0.97∗∗∗ SCP (0◦–5◦S, 150◦W) 0.03
−0.01 0.81∗∗∗ 0.74∗∗∗ 0.97∗∗∗ SEP (0◦–5◦S, 110◦W)
−0.26∗∗ −0.39∗∗∗ 0.72∗∗∗ 0.74∗∗∗ 0.92∗∗∗
BGD
5, 3267–3305, 2008DON and PON in the equatorial Pacific
X. J. Wang et al.
Title Page
Abstract Introduction
Conclusions References
Tables Figures
◭ ◮
◭ ◮
Back Close
Full Screen / Esc
Printer-friendly Version
Interactive Discussion Fig. 1. Modeled (lines) versus observed (symbols) surface (0–40 m) concentrations of TON,
TIN, PON and DON along (a) and (b) 140◦W, (c) and (d) 125◦W, and (e) and (f) 110◦W.
BGD
5, 3267–3305, 2008DON and PON in the equatorial Pacific
X. J. Wang et al.
Title Page
Abstract Introduction
Conclusions References
Tables Figures
◭ ◮
◭ ◮
Back Close
Full Screen / Esc
Printer-friendly Version
Interactive Discussion Fig. 2.Modeled contour plots of(a)nitrate,(b)ammonium,(c)DON, and(d)PON along 150◦W
BGD
5, 3267–3305, 2008DON and PON in the equatorial Pacific
X. J. Wang et al.
Title Page
Abstract Introduction
Conclusions References
Tables Figures
◭ ◮
◭ ◮
Back Close
Full Screen / Esc
Printer-friendly Version
Interactive Discussion
Fig. 3. Modeled (lines) versus measured (symbols) surface concentrations of PON (140◦W–
125◦
BGD
5, 3267–3305, 2008DON and PON in the equatorial Pacific
X. J. Wang et al.
Title Page
Abstract Introduction
Conclusions References
Tables Figures
◭ ◮
◭ ◮
Back Close
Full Screen / Esc
Printer-friendly Version
Interactive Discussion Fig. 4. Modeled climatology (1990–2007) of (a)mixed layer DON, (b) mixed layer PON,(c)
BGD
5, 3267–3305, 2008DON and PON in the equatorial Pacific
X. J. Wang et al.
Title Page
Abstract Introduction
Conclusions References
Tables Figures
◭ ◮
◭ ◮
Back Close
Full Screen / Esc
Printer-friendly Version
Interactive Discussion Fig. 5.Modeled seasonal climatology (over two years) of(a)DON (5◦N–0◦),(b)PON (5◦N–0◦),
(c)DON (5◦S–0◦), and(d)PON (5◦S–0◦) in the mixed layer. Superimposed black lines denote
iron concentrations (nmol m−3
BGD
5, 3267–3305, 2008DON and PON in the equatorial Pacific
X. J. Wang et al.
Title Page
Abstract Introduction
Conclusions References
Tables Figures
◭ ◮
◭ ◮
Back Close
Full Screen / Esc
Printer-friendly Version
Interactive Discussion Fig. 6. Modeled DON profiles for the period of March–May along (a)150◦W and (b)110◦W,
and for September–November along(c)150◦W and(d)110◦W. Superimposed white and black
BGD
5, 3267–3305, 2008DON and PON in the equatorial Pacific
X. J. Wang et al.
Title Page
Abstract Introduction
Conclusions References
Tables Figures
◭ ◮
◭ ◮
Back Close
Full Screen / Esc
Printer-friendly Version
Interactive Discussion Fig. 7. Modeled PON profiles for the period of March-May along (a)150◦W and(b) 110◦W,
and for September-November along(c)150◦W and(d)110◦W. Superimposed white and black
BGD
5, 3267–3305, 2008DON and PON in the equatorial Pacific
X. J. Wang et al.
Title Page
Abstract Introduction
Conclusions References
Tables Figures
◭ ◮
◭ ◮
Back Close
Full Screen / Esc
Printer-friendly Version
Interactive Discussion Fig. 8.Time-longitude contours of(a)DON (color contour) and iron concentrations (black lines),
and(b)PON (color contour) and iron concentrations (black lines) averaged over the 5◦N–5◦S
BGD
5, 3267–3305, 2008DON and PON in the equatorial Pacific
X. J. Wang et al.
Title Page
Abstract Introduction
Conclusions References
Tables Figures
◭ ◮
◭ ◮
Back Close
Full Screen / Esc
Printer-friendly Version
Interactive Discussion Fig. 9.Time-depth contours of DON averaged over(a)5◦N–0◦, 150◦W,(b)5◦N–0◦, 110◦W,(c)
0◦
–5◦
S, 150◦
W, and(d)0◦
–5◦
S, 110◦
BGD
5, 3267–3305, 2008DON and PON in the equatorial Pacific
X. J. Wang et al.
Title Page
Abstract Introduction
Conclusions References
Tables Figures
◭ ◮
◭ ◮
Back Close
Full Screen / Esc
Printer-friendly Version
Interactive Discussion Fig. 10. Time-depth contours of PON averaged over(a)5◦N–0◦, 150◦W,(b)5◦N–0◦, 110◦W,
(c)0◦–5◦S, 150◦W, and(d)0◦–5◦S, 110◦W. Superimposed black lines denote iron
BGD
5, 3267–3305, 2008DON and PON in the equatorial Pacific
X. J. Wang et al.
Title Page
Abstract Introduction
Conclusions References
Tables Figures
◭ ◮
◭ ◮
Back Close
Full Screen / Esc
Printer-friendly Version
Interactive Discussion Fig. 11.Measured (symbols) and modeled (lines) surface PON concentrations along 140◦W–
125◦W during September 2005. (a) diel cycle and(b)meridional distributions. Solid line
BGD
5, 3267–3305, 2008DON and PON in the equatorial Pacific
X. J. Wang et al.
Title Page
Abstract Introduction
Conclusions References
Tables Figures
◭ ◮
◭ ◮
Back Close
Full Screen / Esc
Printer-friendly Version
Interactive Discussion
(
)
μ −Λ
∂ = − − − ∂
(
)
(
)
μ −Λ −Λ
∂ = − − − − − ∂
(
)
(
)
(
)
(
)
(
)
(
)
(
)
λ −Λ −Λ −Λ −Λ δ
−Λ
∂ =⎡ − + − + − + − − + ⎤
⎣ ⎦
∂
− −
(
)
(
)
(
)
(
)
(
)
λ −Λ −Λ −Λ δ
∂ =⎡ − + − + − − + ⎤
⎣ ⎦
∂
Fig. 12. Flow diagram of ecosystem model. Red, green, blue and yellow lines and arrows denote nitrogen fluxes originating from inorganic forms, phytoplankton cells, zooplankton cells, and DON and detritus, respectively. Black lines and arrows denote physical supply of nutrients.